
21

使用KNN和SVM算法实现手写字体识别分类
source link: https://blog.csdn.net/qq_45176548/article/details/111405086
Go to the source link to view the article. You can view the picture content, updated content and better typesetting reading experience. If the link is broken, please click the button below to view the snapshot at that time.

下面分别采用的是k近邻算法(KNN)和SVM实现的手写数字识别。

项目训练目标
- 学会调用数据集, 利用Python相关程序从数据集中读取数据
- 学会根据数据集训练分类器, 并在Python下实现算法
- 学会运用已学的知识完成实际数据集的分类程序
- 学会观察分析算法里相关参数的意义,作用及其对结果产生的影响
- 学会对不同算法进行比较并学会分析各个算法优缺点
进入正文啦,如果是小白,不会安装模块的话,可以看看我哦
- 首先我们要导入所需要的库
from sklearn.model_selection import GridSearchCV
from sklearn import svm
from sklearn.model_selection import train_test_split
from sklearn.preprocessing import StandardScaler
from sklearn.neighbors import KNeighborsClassifier
import operator
import pandas as pd
import numpy as np
import os
import pprint
import matplotlib.pyplot as plt
from matplotlib.pylab import style
- 同时设置下matplotlib绘图中文显示乱码问题
%matplotlib inline
#解决中文显示问题
plt.rcParams['font.family'] = ['sans-serif']
plt.rcParams['font.sans-serif'] = ['SimHei']
plt.rcParams['axes.unicode_minus'] = False
- 切换到数据的路径
path = r"C:\Users\Administrator\homework\机器学习\digits"
os.chdir(path)
# 获取数据文件
fileList = os.listdir(r'trainingDigits')
# 定义数据标签列表
y_train = []
# 添加数据标签
for filename in fileList:
    y_train.append(int(filename.split('_')[0]))
# 定义矩阵数据格式
x_train = np.zeros((len(y_train),32*32))

# 获取矩阵数据
index = 0
for filename in fileList:
    with open(r'trainingDigits\%s'%filename, 'rb') as f:
        # 定义一个空矩阵
        vect = np.zeros((1,1024))
        # 循环32行
        for i in range(32):
            # 读取每一行数据
            line = f.readline()
            # 遍历每行数据索引  line[j] 即为数据
            for j in range(32):
                vect[0,32*i+j] = int(line[j])
        x_train[index,:] = vect
        index+=1
观察数据的结构
x_train.shape
(1934, 1024)
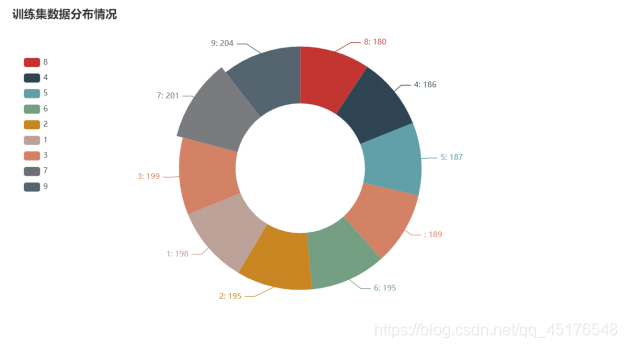
df = pd.DataFrame(y_train,columns=["数字"])
a = df["数字"].value_counts().sort_values()
分布情况
fileList2 = os.listdir(r'testDigits')
# 定义数据标签列表
y_test = []# 获取数据标签
for filename2 in fileList2:
    y_test.append(int(filename2.split('_')[0]))
# 定义矩阵数据格式
x_test = np.zeros((len(y_test),1024))
# 获取矩阵数据
index = 0
for filename2 in fileList2:
    with open(r'testDigits\%s'%filename2, 'rb') as f:
        # 定义一个空矩阵
        vect = np.zeros((1,1024))
        # 循环32行
        for i in range(32):
            # 读取每一行数据
            line = f.readline()
            # 遍历每行数据索引  line[j] 即为数据
            for j in range(32):
                vect[0,32*i+j] = int(line[j])
        x_test[index,:] = vect
        index+=1
df = pd.DataFrame(y_test,columns=["数字"])
c = df["数字"].value_counts().sort_index()

- 通过对数据分布的,可知数据在测试集和训练集中分布平稳
error = 0
total = len(y_train)
def KNN(n_neighbors):
    knn = KNeighborsClassifier(n_neighbors=n_neighbors)#超参数N
    #利用训练数据拟合模型
    knn.fit(x_train,y_train)
    # 预测数据
    y_predict = knn.predict(x_test)
#    print(1 - sum(y_predict ==y_test)/len(y_predict))
    print("超参数n="+str(n_neighbors)+"时,模型的错误率:"+str(1 - knn.score(x_test,y_test)))
    return 1-knn.score(x_test,y_test)
correct=[]
for i in range(1,11):
    correct.append(KNN(i))
超参数n=1时,模型的错误率:0.01374207188160681
超参数n=2时,模型的错误率:0.023255813953488413
超参数n=3时,模型的错误率:0.012684989429175508
超参数n=4时,模型的错误率:0.016913319238900604
超参数n=5时,模型的错误率:0.019027484143763207
超参数n=6时,模型的错误率:0.022198731501057112
超参数n=7时,模型的错误率:0.023255813953488413
超参数n=8时,模型的错误率:0.024312896405919715
超参数n=9时,模型的错误率:0.026427061310782207
超参数n=10时,模型的错误率:0.024312896405919715
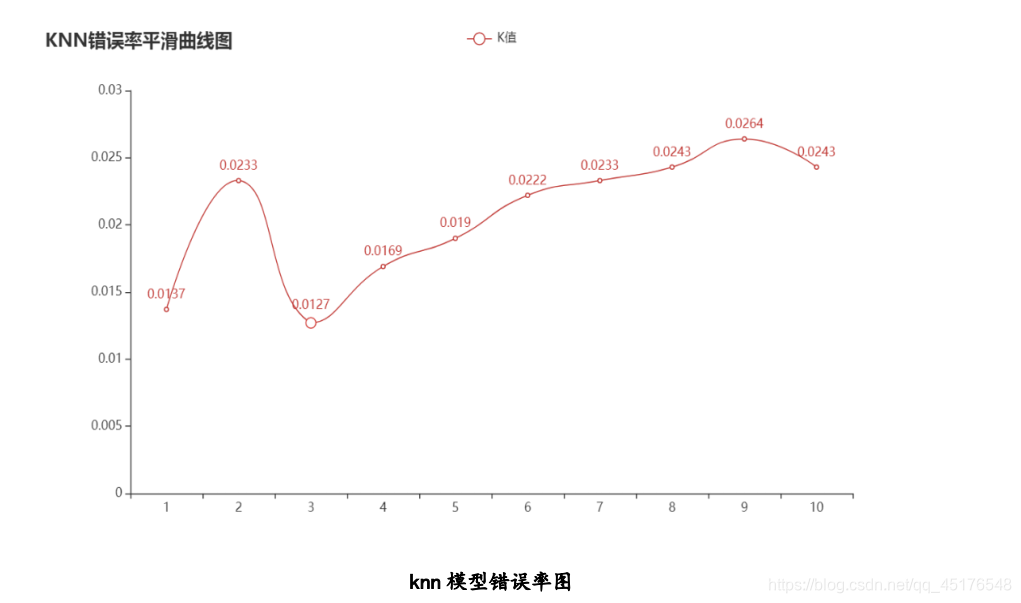
绘制不同k值下错误率图形
使用交叉验证网格搜索的方式选择最优模型
estimator = KNeighborsClassifier()
param_dict = {"n_neighbors": [1,2,3,4,5,6,7,8,9,10]}
estimator = GridSearchCV(estimator, param_grid=param_dict, cv=3)
estimator.fit(x_train,y_train)
y_predict = estimator.predict(x_test)
#print("比对预测结果和真实值:\n", y_predict == y_test)
score = estimator.score(x_test, y_test)
print("直接计算准确率:\n", score)
直接计算准确率:
 0.9873150105708245
使用f1-score来对进行模型评估
from sklearn.metrics import classification_report
target_names = [str(i) for i in range(0,10)]
print(classification_report(y_test, y_predict, target_names=target_names))
              precision    recall  f1-score   support

           0       1.00      1.00      1.00        87
           1       0.96      0.99      0.97        97
           2       1.00      1.00      1.00        92
           3       0.98      0.99      0.98        85
           4       1.00      1.00      1.00       114
           5       0.99      0.98      0.99       108
           6       0.98      1.00      0.99        87
           7       0.98      1.00      0.99        96
           8       1.00      0.95      0.97        91
           9       0.99      0.97      0.98        89

    accuracy                           0.99       946
   macro avg       0.99      0.99      0.99       946
weighted avg       0.99      0.99      0.99       946
- 根据 knn 模型错误率图可知,当增大 k 值时,错误率会先降低,因为有周围更多的样本可以借鉴了,分类效果会变好。但当 K 值更大时,错误率会逐渐增高。在本模型中,当 k=3 时模型得错误率最低。
接下来使用支持向量机对进行模型训练
from sklearn import svm

# 创建SVC/Support Vector Classification/支持向量机分类器模型
svc_model = svm.SVC(gamma="auto", C=10)
# 将数据拟合到SVC模型中,此处用到了标签值y_train,是有监督学习
svc_model.fit(x_train, y_train)
score = svc_model.score(x_test,y_test)
y_predict = svc_model.predict(x_test)
print("直接计算准确率:\n",score)
直接计算准确率:
 0.9862579281183932
from sklearn.metrics import classification_report
target_names = [str(i) for i in range(0,10)]
print(classification_report(y_test, y_predict, target_names=target_names))
              precision    recall  f1-score   support

           0       1.00      1.00      1.00        87
           1       0.98      0.99      0.98        97
           2       0.99      0.99      0.99        92
           3       0.99      0.94      0.96        85
           4       0.98      1.00      0.99       114
           5       0.98      1.00      0.99       108
           6       0.99      0.99      0.99        87
           7       0.99      0.99      0.99        96
           8       1.00      0.98      0.99        91
           9       0.97      0.98      0.97        89

    accuracy                           0.99       946
   macro avg       0.99      0.99      0.99       946
weighted avg       0.99      0.99      0.99       946
def SVM(C):
    # 创建SVC/Support Vector Classification/支持向量机分类器模型
    svc_model = svm.SVC( C=C)
    # 将数据拟合到SVC模型中,此处用到了标签值y_train,是有监督学习
    svc_model.fit(x_train, y_train)
    score = svc_model.score(x_test,y_test)
    y_predict = svc_model.predict(x_test)
    print("超参数C="+str(C)+"时,模型的正确率:"+str(score))
    return score
L2 = []
c = np.logspace(-5,5,11)
for i in c:
    L2.append(SVM(i))
超参数C=1e-05时,模型的正确率:0.09408033826638477
超参数C=0.0001时,模型的正确率:0.09408033826638477
超参数C=0.001时,模型的正确率:0.09408033826638477
超参数C=0.01时,模型的正确率:0.09513742071881606
超参数C=0.1时,模型的正确率:0.952431289640592
超参数C=1.0时,模型的正确率:0.985200845665962
超参数C=10.0时,模型的正确率:0.9904862579281184
超参数C=100.0时,模型的正确率:0.9904862579281184
超参数C=1000.0时,模型的正确率:0.9904862579281184
超参数C=10000.0时,模型的正确率:0.9904862579281184
超参数C=100000.0时,模型的正确率:0.9904862579281184
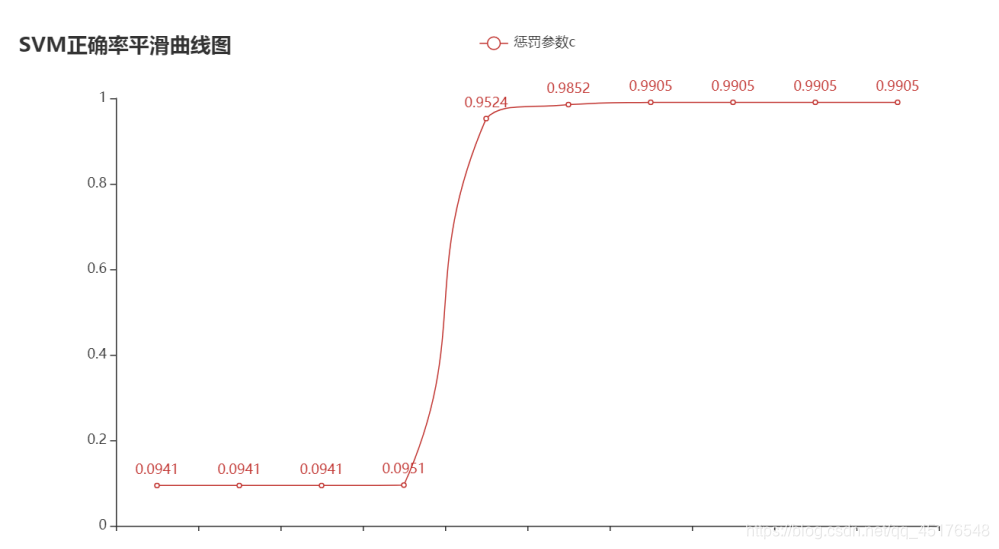
支持向量机,有大量的核函数可以使用,从而可以很灵活的来解决各种非线性的分类回归问题。样本量不是海量数据的时候,分类准确率高,泛化能力强。
Recommend
About Joyk
Aggregate valuable and interesting links.
Joyk means Joy of geeK