
This is how I helped YouTube improve performance with a simple JavaScript trick
source link: https://yonatankra.com/look-ma-my-codes-in-youtube/
Go to the source link to view the article. You can view the picture content, updated content and better typesetting reading experience. If the link is broken, please click the button below to view the snapshot at that time.

This is how I helped YouTube improve performance with a simple JavaScript trick
Google’s Material Web Components had a performance issue and I thought I could help. The results: 90% performance improvement in big lists removal. Here’s how I did it, and how you can duplicate it in your application.

At Vonage, we are working on a unified UI library called Vivid. A core library we are using is Google’s Material Web Components library (MWC). This library enables us to enjoy best practices like Material design, accessibility and cross-browser compatibility while delivering our components fast to our organisation.
Lately I was integrating the select box in an angular application. It went well, but after replacing one specific select box, I’ve noticed a slow in response time.
How to discover a JavaScript performance problem
The select box was part of a form that showed up in a modal window. When I closed the modal window, the UI was stuck – sometimes for around 30 seconds!
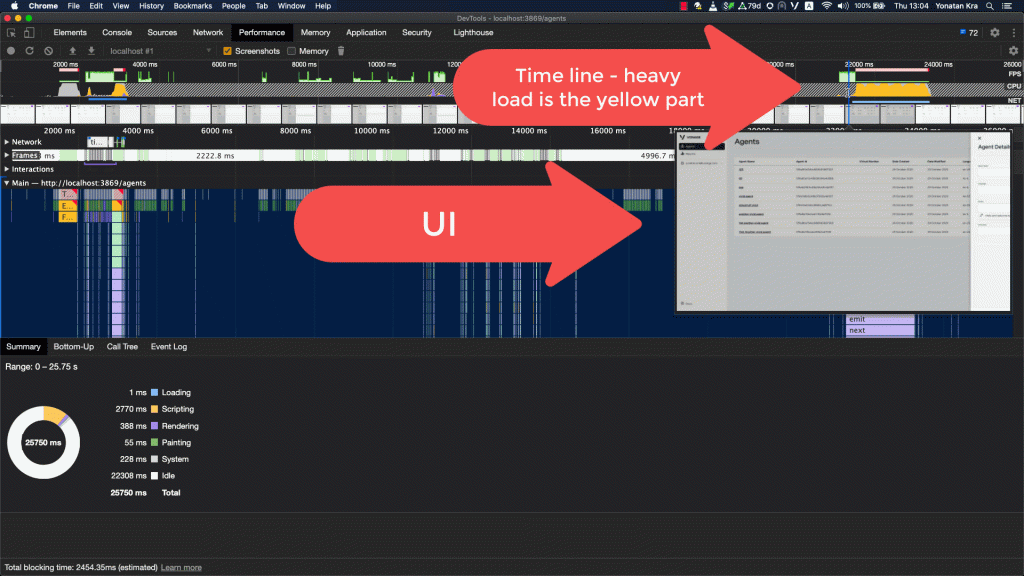
Opening the performance tab in Chrome, I’ve monitored the app and found this:

What we see in Figure 1 is an animation of the modal closing and then around 4 seconds of JavaScript running on… something.
The difference between the new select I’ve added and the other selects is the amount of options in the latest select. There were almost 400 options in this select – and it clogged the JavaScript thread.
Finding where the problem lies in the JavaScript code
In order to verify the error is not in our application, I’ve created a simple reproduction of the error in codesandbox. In this short reproduction, I’ve just created a new select box and added 300 options to it.
The profiling scenario is simple – start profiling, click the Clear everything button in the app, stop profiling. As simple as that.
Profiling the app in the sandbox I’ve found something interesting – removing 300 list items took around 200 milliseconds in a blank application. That’s a lot of time to just remove elements from the DOM. Figure 2 shows this performance recording – and the perliminary result that showed that the updateItems method and its children are the prime suspects.
I’ve opened an issue in the MWC repository. I then started to investigate this farther as we needed a quick fix for our application. After I’ve fixed it internally (we are extending the MWC classes), I thought I saw a way to solve it in MWC’s source code.
Solving the Performance Issue
Digging deeper into the recording on sandbox, I saw that one function was called a lot of times: list.layout.

The list’s layout function was being called by every list-item element. Looking at the layout‘s code, I saw that there was no real need to run this function for every list-item, as this function just updates the layout of the list after a change.
Because we are making lots of small changes, we can just bulk them into one big change!
An old article of mine came into mind. In this article, I’ve shown how to solve a similar problem, using a debounced method.
Armed with the general solution and the automated way to test it, I dove into the code. I first wrote a test that should verify my solution is working (code snippet 1).
After writing the code, I made sure the test has failed for the right reasons – the method ran 100 times instead of the expected 1 time. Cool!
And now to the fix – I’ve created a debounce function for the layout, and used it instead of the original layout inside the list-item.
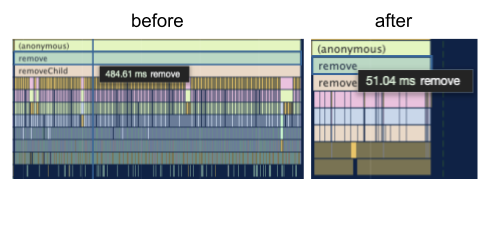
Here’s the performance result:

Completing the Pull Request
After solving the main issue, there were some small tasks that popped up. Internal automated processes (like linting) were failing and I had to cope with that.
I really enjoyed the process. Because of time differences, I worked on a fix during the day, and at around 5am had another message from the reviewer about the status. I was eagerly waiting for these messages – the whole process was positive and constructive.
I had to make some non-performance changes too. Because the debounced method is now async, I had to add a promise to the element’s updateComplete life cycle hook. In addition, apparently there were some hidden tests on IE that we not passing (IE took much longer than chrome and the testing framework’s timeout was not enough…).
After all was well and done, my PR was complete and ready for google.

Finding my code was going to be on YouTube
But it is wasn’t over yet. The day after, I’ve got the following message from the reviewer:

How cool is that?
Now I feel really good studying 10 years in the University. It really paid up, that after 10 years of hard studies, I switched to JavaScript completely! 😉
I hope you enjoyed this one as much as I did. If you are a new open source contributor, do not be intimidated by big projects. Sometimes, the smallest detail (like this simple debounce contribution) can make a big difference!
You can view the full PR here: https://github.com/material-components/material-components-web-components/pull/1928
Thanks to Omer Dolev from Microsoft for the kind review.
Recommend
-
 102
102
Oops! This is awkward. We encountered a 404 Not Found error. You are looking for something that doesn't exist or may have moved. Check out one of the links on this page or head back to
-
 53
53
Source: Deep Learning on Medium
-
 9
9
How to improve the performance of the simple search query mongo advertisements This is explanation of a simple search in mongodb, its taking m...
-
 12
12
Customer Experience How customer experience learnings helped Veolia improve the employee experience ...
-
 8
8
8 Things That Helped Me Improve My Software SkillsMay 6th 2021 new story8...
-
 4
4
A trick to improve your class names Original – May 17th 20...
-
 11
11
One weird trick to improve your website’s performance Posted December 5, 2021 by Nolan Lawson in performance, Web....
-
 10
10
Home ...
-
 11
11
SmartData Collective >
-
 5
5
Learn three quick setting changes to control your Google Ads spend on irrelevant clicks and impressions while improving campaign results.
About Joyk
Aggregate valuable and interesting links.
Joyk means Joy of geeK