

Best Practices For Microservices on Kubernetes
source link: https://piotrminkowski.wordpress.com/2020/03/10/best-practices-for-microservices-on-kubernetes/
Go to the source link to view the article. You can view the picture content, updated content and better typesetting reading experience. If the link is broken, please click the button below to view the snapshot at that time.
Best Practices For Microservices on Kubernetes
There are several best practices for building microservices architecture properly. You may find many articles about it online. One of them is my previous article Spring Boot Best Practices For Microservices. I focused there on the most important aspects that should be considered when running microservice applications built on top of Spring Boot on production. I didn’t assumed there any platform used for orchestration or management, but just a group of independent applications. In this article I’m going to extend the list of already introduced best practices with some new rules dedicated especially for microservices deployed on Kubernetes platform.
The first question is if it makes any difference when you deploy your microservices on Kubernetes instead of running them independently without any platform? Well, actually yes and no… Yes, because now you have a platform which is responsible for running and monitoring your applications, and it launches some its own rules. No, because you still have microservices architecture, a group of loosely coupled, independent applications, and you should not forget about it! In fact, many of previously introduced best practices are actual, some of them needs to be redefined a little. There are also some new, platform-specific rules, which should be mentioned.
One thing needs to be explained before proceeding. This list of best practices is build basing on my experience in running microservices-based architecture on cloud platform like Kubernetes. I didn’t copied it from other articles or books. In my organization we have already migrated our microservices from Spring Cloud (Eureka, Zuul, Spring Cloud Config) to OpenShift. We are continuously improving this architecture basing on experience in maintaining it.
Example
The sample Spring Boot application that implements currently described best practices is written in Kotlin. It is available on GitHub in repository sample-spring-kotlin-microservice under branch kubernetes: https://github.com/piomin/sample-spring-kotlin-microservice/tree/kubernetes.
1. Allow platform to collect metrics
I have also put a similar section in my article about best practices for Spring Boot. We were using there InfluxDB as a target metrics store. Since our approach to gathering metrics data is being changed after migration to Kubernetes I redefined a title of this point into Allow platform to collect metrics. The main difference between current and previous approach is in the way of collecting data. We use Prometheus, because that process may be managed by the platform. InfluxDB is a push based system, where your application actively push data into the monitoring system. Prometheus is a pull based system, where a server fetches the metrics values from the running application periodically. So, our main responsibility ant this point is to provide endpoints on the application side for Prometheus.
Fortunately, it is very easy to provide metrics for Prometheus with Spring Boot. You need to include Spring Boot Actuator and dedicated Micrometer library for integration with Prometheus.
<dependency><groupId>org.springframework.boot</groupId><artifactId>spring-boot-starter-actuator</artifactId></dependency><dependency><groupId>io.micrometer</groupId><artifactId>micrometer-registry-prometheus</artifactId></dependency>We should also enable exposing Actuator HTTP endpoints outside application. You can enable a single endpoint dedicated for Prometheus or just expose all Actuator endpoints as shown below.
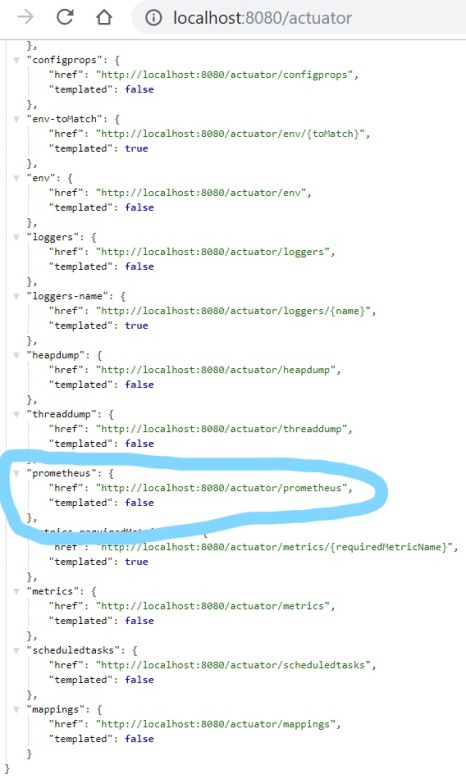
management.endpoints.web.exposure.include: '*'After running your application endpoint is by default available under path /actuator/prometheus.
Assuming you run your application on Kubernetes you need to deploy and configure Prometheus to scrape logs from your pods. The configuration may be delivered as Kubernetes ConfigMap. The prometheus.yml file should contain section scrape_config with path of endpoint serving metrics and Kubernetes discovery settings. Prometheus is trying to localize all application pods by Kubernetes Endpoints. The application should be labeled with app=sample-spring-kotlin-microservice and have port with name http exposed outside container.
apiVersion: v1kind: ConfigMapmetadata:name: prometheuslabels:name: prometheusdata:prometheus.yml: |-scrape_configs:- job_name: 'springboot'metrics_path: /actuator/prometheusscrape_interval: 5skubernetes_sd_configs:- role: endpointsnamespaces:names:- defaultrelabel_configs:- source_labels: [__meta_kubernetes_service_label_app]separator: ;regex: sample-spring-kotlin-microservicereplacement: $1action: keep- source_labels: [__meta_kubernetes_endpoint_port_name]separator: ;regex: httpreplacement: $1action: keep- source_labels: [__meta_kubernetes_namespace]separator: ;regex: (.*)target_label: namespacereplacement: $1action: replace- source_labels: [__meta_kubernetes_pod_name]separator: ;regex: (.*)target_label: podreplacement: $1action: replace- source_labels: [__meta_kubernetes_service_name]separator: ;regex: (.*)target_label: servicereplacement: $1action: replace- source_labels: [__meta_kubernetes_service_name]separator: ;regex: (.*)target_label: jobreplacement: ${1}action: replace- separator: ;regex: (.*)target_label: endpointreplacement: httpaction: replaceThe last step is to deploy Prometheus on Kubernetes. You should attach ConfigMap with Prometheus configuration to the Deployment via Kubernetes mounted volume. After that you may set the location of a configuration file using config.file parameter: --config.file=/prometheus2/prometheus.yml.
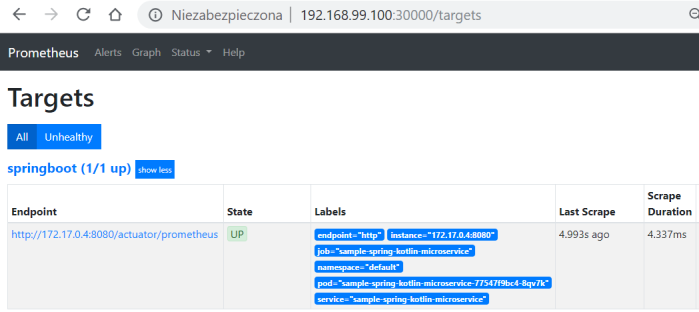
apiVersion: apps/v1kind: Deploymentmetadata:name: prometheuslabels:app: prometheusspec:replicas: 1selector:matchLabels:app: prometheustemplate:metadata:labels:app: prometheusspec:containers:- name: prometheusimage: prom/prometheus:latestargs:- "--config.file=/prometheus2/prometheus.yml"- "--storage.tsdb.path=/prometheus/"ports:- containerPort: 9090name: httpvolumeMounts:- name: prometheus-storage-volumemountPath: /prometheus/- name: prometheus-config-mapmountPath: /prometheus2/volumes:- name: prometheus-storage-volumeemptyDir: {}- name: prometheus-config-mapconfigMap:name: prometheusNow you can verify if Prometheus has discovered your application running on Kubernetes by accessing endpoint /targets.
2. Prepare logs in right format
The approach to collecting logs is pretty similar to collecting metrics. Our application should not handle the process of sending logs by itself. It just should take care of formatting logs sent to output stream properly. Since, Docker has built-in logging driver for Fluentd it very convenient to use it as log collector for applications running on Kubernetes. This means no additional agent is required on the container to push logs to Fluentd. Logs are directly shipped to Fluentd service from STDOUT and no additional logs file or persistent storage is required. Fluentd tries to structure data as JSON to unify logging across different sources and destinations.
In order to format our logs to JSON readable by Fluentd we may include the Logstash Logback Encoder library to our dependencies.
<dependency><groupId>net.logstash.logback</groupId><artifactId>logstash-logback-encoder</artifactId><version>6.3</version></dependency>Then we just need to set a default console log appender for our Spring Boot application in the file logback-spring.xml.
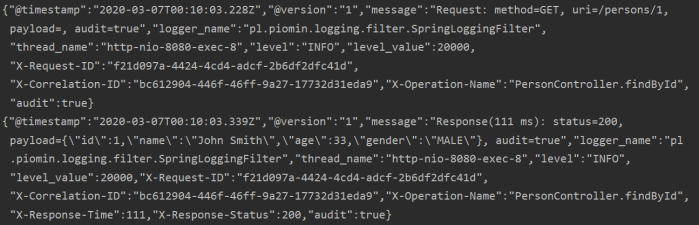
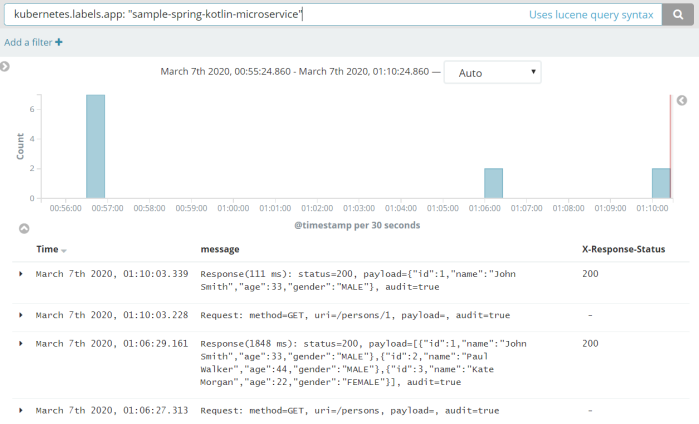
<configuration><appender name="consoleAppender" class="ch.qos.logback.core.ConsoleAppender"><encoder class="net.logstash.logback.encoder.LogstashEncoder"/></appender><logger name="jsonLogger" additivity="false" level="DEBUG"><appender-ref ref="consoleAppender"/></logger><root level="INFO"><appender-ref ref="consoleAppender"/></root></configuration>The logs are printed into STDOUT in the format visible below.
It is very simple to install Fluentd, Elasticsearch and Kibana on Minikube. Disadvantage of this approach is that we are installing older versions of these tools.
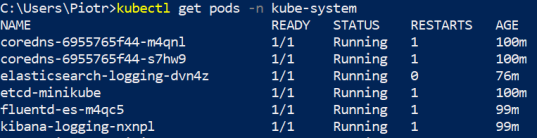
$ minikube addons enable efk* efk was successfully enabled$ minikube addons enable logviewer* logviewer was successfully enabledAfter enabling efk and logviewer addons Kubernetes pulls and starts all the required pods as shown below.
Thanks to logstash-logback-encoder library we may automatically create logs compatible with Fluentd including MDC fields. Here’s a screen from Kibana that shows logs from our test application.
Optionally, you can add my library for logging requests/responses for Spring Boot application.
<dependency><groupId>com.github.piomin</groupId><artifactId>logstash-logging-spring-boot-starter</artifactId><version>1.2.2.RELEASE</version></dependency>3. Implement both liveness and readiness health check
It is important to understand a difference between liveness and readiness probe in Kubernetes. If these probes are not implemented carefully, they can degrade the overall operation of a service, for example by causing its unnecessary restarts. Liveness probe is used to decide whether restart container or not. If an application is unavailable for any reason, restarting container sometimes can make sense. On the other hand, readiness probe is used to decide if a container can handle incoming traffic. If a pod has been recognized as not ready, it is removed from load balancing. Fail of readiness probe does not result in pod restart. The most typical liveness or readiness probe for web applications is realized via HTTP endpoint.
In typical web application running outside platform like Kubernetes you won’t distinguish liveness and readiness health checks. That’s why most of web frameworks provides only a single built-in health check implementation. For Spring Boot application you may easily enable health check by including Spring Boot Actuator to your dependencies. The important information about Actuator health check is that it may behave differently depending on integrations between your application and third-party systems. For example if you define Spring datasource for connecting with database or declare connection to message broker, health check may automatically include such validation through auto-configuration. Therefore, if you set a default Spring Actuator health check implementation as liveness probe endpoint, is may result in unnecessary restart if application is unable to connect database or message broker. Since such behaviour is not desired, I suggest you should implement very simple liveness endpoint, that just verifies an availability of application without checking connection to other external systems.
Adding custom implementation of health check is not very hard with Spring Boot. There are some different ways to do that. One of them is visible below. We are using mechanism provided within Spring Boot Actuator. It is worth noting that we won’t override default health check, but we are adding another, custom implementation. The following implementation is just checking if application is able to handle incoming request.
@Component@Endpoint(id = "liveness")class LivenessHealthEndpoint {@ReadOperationfun health() : Health = Health.up().build()@ReadOperationfun name(@Selector name: String) : String = "liveness"@WriteOperationfun write(@Selector name: String) {}@DeleteOperationfun delete(@Selector name: String) {}}In turn, a default Spring Boot Actuator health check may be a right solution for readiness probe. Assuming your application would connection to database Postgres and RabbitMQ message broker you should add the following dependencies to your Maven pom.xml.
<dependency><groupId>org.springframework.boot</groupId><artifactId>spring-boot-starter-amqp</artifactId></dependency><dependency><groupId>org.springframework.boot</groupId><artifactId>spring-boot-starter-data-jpa</artifactId></dependency><dependency><groupId>org.postgresql</groupId><artifactId>postgresql</artifactId><scope>runtime</scope></dependency>Now, just for information add the following property to your application.yml. It enables displaying detailed information for auto-configured Actuator /health endpoint.
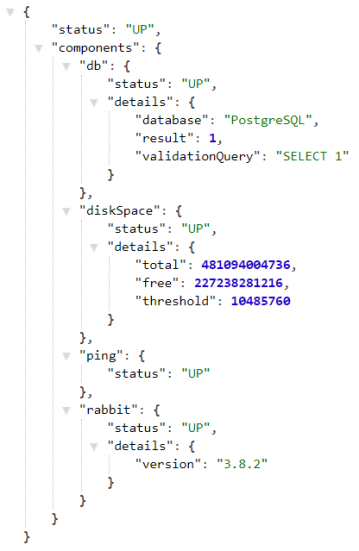
management:endpoint:health:show-details: alwaysFinally, let’s call /actuator/health to see the detailed result. As you see on the picture below health check returns information about Postgres and RabbitMQ connections.
There is another aspect of using liveness and readiness probes in your web application. It is related with thread pooling. In standard web container like Tomcat each request is handled by HTTP thread pool. If you are processing each request in the main thread and you have some long-running tasks in your application you may block all available HTTP threads. If your liveness will fail several times in row an application pod will be restarted. Therefore, you should consider to implement long-running tasks using another thread pool. Here’s the example of HTTP endpoint implementation with DeferredResult and Kotlin coroutines.
@PostMapping("/long-running")fun addLongRunning(@RequestBody person: Person): DeferredResult<Person> {var result: DeferredResult<Person> = DeferredResult()GlobalScope.launch {logger.info("Person long-running: {}", person)delay(10000L)result.setResult(repository.save(person))}return result}4. Consider your integrations
Hardly ever our application is able to exist without any external solutions like database, message brokers or just other applications. There are two aspects of integration with third-party applications that should be carefully considered: connection settings and auto-creation of resources.
Let’s start from connection settings. As you probably remember, in the previous section we were using default implementation of Spring Boot Actuator /health endpoint as readiness probe. However, if you leave default connection settings for Postgres and Rabbit each call of readiness probe take a long time if they are unavailable. That’s why I suggest to decrease these timeouts to lower values as shown below.
spring:application:name: sample-spring-kotlin-microservicedatasource:url: jdbc:postgresql://postgres:5432/postgresusername: postgrespassword: postgres123hikari:connection-timeout: 2000initialization-fail-timeout: 0jpa:database-platform: org.hibernate.dialect.PostgreSQLDialectrabbitmq:host: rabbitmqport: 5672connection-timeout: 2000Except properly configured connection timeouts you should also guarantee auto creation of resources required by the application. For example, if you use RabbitMQ queue for asynchronous messaging between two applications you should guarantee that queue is created on startup if does not exist. To do that first declare a queue – usually on the listener side.
@Configurationclass RabbitMQConfig {@Beanfun myQueue(): Queue {return Queue("myQueue", false)}}Here’s a listener bean with receiving method implementation.
@Componentclass PersonListener {val logger: Logger = LoggerFactory.getLogger(PersonListener::class.java)@RabbitListener(queues = ["myQueue"])fun listen(msg: String) {logger.info("Received: {}", msg)}}The similar case is with database integration. First, you should ensure that your application starts even if connection to database fails. That’s why I declared PostgreSQLDialect. It is required if application is not able to connect to database. Moreover, each change in the entities model should be applied on tables before application startup.
Fortunately, Spring Boot has auto-configured support for popular tools for managing database schema changes: Liquibase and Flyway. To enable Liquibase we just need to include the following dependency in Maven pom.xml.
<dependency><groupId>org.liquibase</groupId><artifactId>liquibase-core</artifactId></dependency>Then you just need to create change log and put in the default location db/changelog/db.changelog-master.yaml. Here’s sample Liquibase changelog YAML file for creating table person.
databaseChangeLog:- changeSet:id: 1author: piominchanges:- createTable:tableName: personcolumns:- column:name: idtype: intautoIncrement: trueconstraints:primaryKey: truenullable: false- column:name: nametype: varchar(50)constraints:nullable: false- column:name: agetype: intconstraints:nullable: false- column:name: gendertype: smallintconstraints:nullable: false5. Use Service Mesh
If you are building microservices architecture outside Kubernetes, such mechanisms like load balancing, circuit breaking, fallback or retrying are realized on the application side. Popular cloud native frameworks like Spring Cloud simplify implementation of these patterns in your application and just reduced it to adding dedicated library to your project. However, if you migrate your microservices to Kubernetes you should not still use these libraries for traffic management. It is becoming some kind of anti-pattern. Traffic management in communication between microservices should be delegated to the platform. This approach on Kubernetes is known as Service Mesh.
Since originally Kubernetes has not been dedicated for microservices, it does not provide any built-in mechanism for advanced managing of traffic between many applications. However, there are some additional solutions dedicated for traffic management, which may be easily installed on Kubernetes. One of the most popular of them is Istio. Besides traffic management it also solves problems related to security, monitoring, tracing and metrics collecting.
Istion can be easily installed on your cluster or on standalone development instance like Minikube. After downloading it just run the following command.
$ istioctl manifest applyIstio components need to be injected into a deployment manifest. After that we can define traffic rules using YAML manifests. Istio gives many interesting options of configuration. The following example shows how to inject faults to the existing route. It can be either delays or aborts. We can define a percentage level of error using percent field for the both types of fault. In the Istio resource I have defined 2 seconds delay for every single request sent to Service account-service.
apiVersion: networking.istio.io/v1alpha3kind: VirtualServicemetadata:name: account-servicespec:hosts:- account-servicehttp:- fault:delay:fixedDelay: 2spercent: 100route:- destination:host: account-servicesubset: v1Besides VirtualService we also need to define DestinationRule for account-service. It is really simple – we have just define version label of the target service.
apiVersion: networking.istio.io/v1alpha3kind: DestinationRulemetadata:name: account-servicespec:host: account-servicesubsets:- name: v1labels:version: v16. Be open for framework specific solutions
There are many interesting tools and solutions around Kubernetes, which may help you in running and managing applications. However, you should also do not forget about some interesting tools and solutions offered by a framework you use. Let me give you some examples. One of them is Spring Boot Admin. It is useful tool designed for monitoring Spring Boot applications across a single discovery. Assuming you are running microservices on Kubernetes you may also install Spring Boot Admin there.
There is another project interesting project within Spring Cloud – Spring Cloud Kubernetes. It provides some useful features that simplify integration between Spring Boot application and Kubernetes. One of them is a discovery across all namespaces. If you use that feature together with Spring Boot Admin, you may easily create a powerful tool, which is able to monitor all Spring Boot microservices running on your Kubernetes cluster. For more details about implementation details you may refer to my article Spring Boot Admin on Kubernetes.
Sometimes you may use Spring Boot integrations with third-party tools to easily deploy such solution on Kubernetes without building separated Deployment. You can even build a cluster of multiple instances. This approach may be used for products that can be embedded to Spring Boot application. It can be, for example RabbitMQ or Hazelcast (popular in-memory data grid). If you are interested in more details about running Hazelcast cluster on Kubernetes using this approach please refer to my article Hazelcast with Spring Boot on Kubernetes.
7. Be prepared for a rollback
Kubernetes provides a convenient way to rollback application to older version based on ReplicaSet and Deployment objects. By default Kubernetes keeps 10 previous ReplicaSets and lets you roll back to any of them. However, one thing needs to be pointed out. A rollback does not include configuration stored inside ConfigMap and Secret. Sometimes it is desired to rollback not only application binaries, but also configuration.
Fortunately, Spring Boot gives us really great possibilities for managing externalized configuration. We may keep configuration files inside application and also load them from external location. On Kubernetes we may use ConfigMap and Secret for defining Spring configuration files. The following definition of ConfigMap creates application-rollbacktest.yml Spring configuration containing only a single property. This configuration is loaded by the application only if Spring profile rollbacktest is active.
apiVersion: v1kind: ConfigMapmetadata:name: sample-spring-kotlin-microservicedata:application-rollbacktest.yml: |-property1: 123456A ConfigMap is included to the application through a mounted volume.
spec:containers:- name: sample-spring-kotlin-microserviceimage: piomin/sample-spring-kotlin-microserviceports:- containerPort: 8080name: httpvolumeMounts:- name: config-map-volumemountPath: /config/volumes:- name: config-map-volumeconfigMap:name: sample-spring-kotlin-microserviceWe also have application.yml on the classpath. The first version contains only a single property.
property1: 123In the second we are going to activate rollbacktest profile. Since, a profile-specific configuration file has higher priority than application.yml, the value of property1 property is overridden with value taken from application-rollbacktest.yml.
property1: 123spring.profiles.active: rollbacktestLet’s test the mechanism using simple HTTP endpoint that prints value of property.
@RestController@RequestMapping("/properties")class TestPropertyController(@Value("\${property1}") val property1: String) {@GetMappingfun printProperty1(): String = property1}Let’s take look how we are rolling back a version of deployment. First, let’s see how many revisions do we have.
$ kubectl rollout history deployment/sample-spring-kotlin-microservicedeployment.apps/sample-spring-kotlin-microserviceREVISION CHANGE-CAUSE1 2 3 Now, we are calling endpoint /properties of current deployment, that returns value of property property1. Since, profile rollbacktest is active it returns value from file application-rollbacktest.yml.
$ curl http://localhost:8080/properties123456Let’s rollback to the previous revision.
$ kubectl rollout undo deployment/sample-spring-kotlin-microservice --to-revision=2deployment.apps/sample-spring-kotlin-microservice rolled backAs you see below the revision=2 is not visible, it is now deployed as the newest revision=4.
$ kubectl rollout history deployment/sample-spring-kotlin-microservicedeployment.apps/sample-spring-kotlin-microserviceREVISION CHANGE-CAUSE1 3 4 In this version of application profile rollbacktest wasn’t active, so value of property property1 is taken from application.yml.
$ curl http://localhost:8080/properties123Recommend
About Joyk
Aggregate valuable and interesting links.
Joyk means Joy of geeK