

Infrastructure Monitoring
source link: https://logz.io/platform/infrastructure-monitoring/
Go to the source link to view the article. You can view the picture content, updated content and better typesetting reading experience. If the link is broken, please click the button below to view the snapshot at that time.

Get started in minutes, keep your data for months
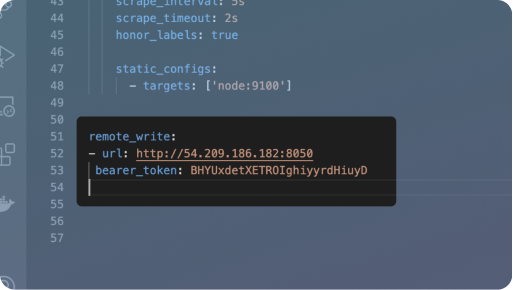
Add just three lines of code to your Prometheus config files to begin forwarding your metrics to Logz.io.
From there, they will be stored in Logz.io’s managed service for 18th months, out-of-the-box.
Leverage premade Grafana dashboards purpose-built to monitor popular cloud technologies

Stay notified with real-time alerting
Stay notified of high-priority production incidents on your favorite notification system.
- Straightforward, alerting based on open source grafana
- Use multiple trigger conditions to configure advanced alerts
- Stay notified via slack, PagerDuty, email, and other channels

Changing the threshold and condition for a metrics alert.
Correlate metric data with recent deployments
Give your dashboards context by adding Deployment Markers to indicate recent deployments.
- Deployment Markers are added automatically every time code is pushed
- Understand how specific deployments and configuration changes affect pods

The purple Markers (purple dotted lines) represent recent releases, which evidently caused a CPU spike that led to production downtime marked by the red Markers.

18 months retention
Logz.io automatically rolls over metrics to provide a cost efficient, optimized trend analysis experience over time.
Your data is safe
Use a fully secure platform that adheres to strict data security rules. Compliant with: PCI Level 1, SOC-2 Type II, HIPAA, GDPR and ISO-27001.
Recommend
-
41
Modernize your IT Infrastructure Monitoring by Combining Time Series Databases with Machine Learning
-
33
Home Blog
-
34
Home Blog
-
11
On any given day, we handle around 15% of daily retail trading volume across all stock exchanges in India. Billions of requests generated in the process are handled by a suite of systems we have built in-house. Also, we a...
-
21
For some companies, infrastructure is the heart of its business. Specifically, I am referring to...
-
6
“Kubernetes infrastructure can get expensive quite quickly without accurately monitoring” August 5, 2021JAXenter Edito...
-
3
NAKIVO Blog > VMware Administration and Backup > All You Should Know About IT Infrastructure Monitoring...
-
4
Log monitoring explained: The benefits of tracking events in apps & infrastructureSearch ComputingForGeeksI...
-
14
Infrastructure-as-Code series: Practical monitoring in an IaC universe Adrian Bridgwater Publishe...
-
5
Cloud monitoring software rank highly as companies overhaul infrastructure Illustration of server racksImage Credit: Westend61 via Getty ...
About Joyk
Aggregate valuable and interesting links.
Joyk means Joy of geeK