

Getting started with PySpark & GeoPandas on Databricks
source link: https://anitagraser.com/2019/12/07/getting-started-with-pyspark-geopandas-on-databricks/
Go to the source link to view the article. You can view the picture content, updated content and better typesetting reading experience. If the link is broken, please click the button below to view the snapshot at that time.
Getting started with PySpark & GeoPandas on Databricks
Over the last years, many data analysis platforms have added spatial support to their portfolio. Just two days ago, Databricks have published an extensive post on spatial analysis. I took their post as a sign that it is time to look into how PySpark and GeoPandas can work together to achieve scalable spatial analysis workflows.
If you sign up for Databricks Community Edition, you get access to a toy cluster for experimenting with (Py)Spark. This considerably lowers the entry barrier to Spark since you don’t need to bother with installing anything yourself. They also provide a notebook environment:

I’ve followed the official Databricks GeoPandas example notebook but expanded it to read from a real geodata format (GeoPackage) rather than from CSV.
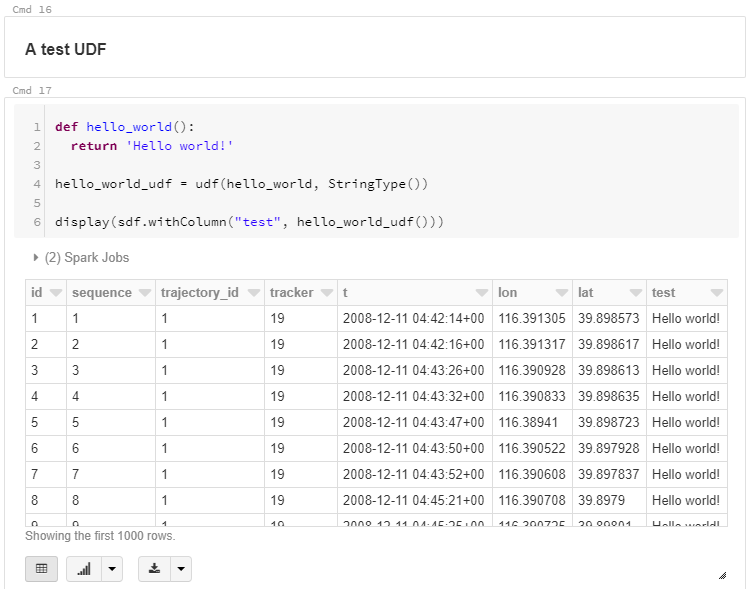
I’m using test data from the MovingPandas repository: demodata_geolife.gpkg contains a hand full of trajectories from the Geolife dataset. Demodata_grid.gpkg contains a simple 3×4 grid that covers the same geographic extent as the geolife sample:

Once the files are downloaded, we can use GeoPandas to read the GeoPackages:

The same applies to the grid data:

When the GeoDataFrames are ready, we can start using them in PySpark. To do so, it is necessary to convert from GeoDataFrame to PySpark DataFrame. Therefore, I’ve implemented a simple function that performs the conversion and turn the Point geometries into lon and lat columns:


To plot the results, I’m converting the joined PySpark DataFrame back to GeoDataFrame:

I’ve published this notebook so you can give it a try. (Any notebook published on Databricks is supposed to stay online for six months, so if you’re trying to access it after June 2020, this link may be broken.)
Recommend
About Joyk
Aggregate valuable and interesting links.
Joyk means Joy of geeK