

MLPerf Inference Virtualization in VMware vSphere Using NVIDIA vGPUs
source link: https://blogs.vmware.com/performance/2020/12/mlperf-inference-virtualization-in-vmware-vsphere-using-nvidia-vgpus.html
Go to the source link to view the article. You can view the picture content, updated content and better typesetting reading experience. If the link is broken, please click the button below to view the snapshot at that time.


MLPerf Inference Virtualization in VMware vSphere Using NVIDIA vGPUs
By Uday Kurkure, Ramesh Radhakrishnan, Lan Vu, Hari Sivaraman, and Juan Garcia-Rovetta
VMware delivered—through industry’s first virtualized MLPerf Inference benchmark—results that once again showcase VMware’s performance leadership in virtualized environments. In this blog, we present results for MLPerf Inference v0.7.0 in VMware vSphere using NVIDIA vGPUs. VMware vSphere 7.x using NVIDIA vGPUs has near bare-metal performance for MLPerf inference benchmarks.
We used the MLPerf Inference benchmark to measure how fast a VMware vSphere 7 virtualized system, configured with NVIDA virtual GPUs, performed ML inference using a trained model. We compared these results against a similarly outfitted bare-metal server and found that vSphere virtual performance was near that of the bare-metal server. This similar performance makes it easy to see how IT environments can leverage the vSphere configuration to take advantage of the features of vSphere that aren’t included in a bare-metal server. These include multiple VMs running on a single host, shared virtual GPUs, cloning, vMotion, distributed resource scheduling, and suspending/resuming VMs.
Machine Learning and NVIDIA GPU Virtualization in VMware vSphere and MLPerf
VMware virtualization technologies have pioneered compute, storage, and network virtualization—making yesterday’s bare-metal datacenters to be software-defined data centers (SDDC). However, dedicated bare-metal servers are often employed because of the computing intensity of workloads like machine learning and deep learning. With the availability of NVIDIA virtual GPUs, vSphere can now keep up with computing performance for these workloads.
Deep learning (DL) workloads are so compute-intensive that they require accelerators like NVIDIA GPUs. Many accelerators, however, are not yet fully virtualized, and deploying these unvirtualized accelerators makes such systems difficult to manage when deployed at scale in datacenters. Now, VMware’s partnership with NVIDIA brings virtualized GPUs to vSphere datacenters.
Machine learning (ML) workloads are quickly emerging as primary workloads in datacenters. Until recently, there was no standard way to measure the performance of machine learning systems. MLPerf addresses this problem—it provides fair and useful benchmarks for measuring training and inference of ML hardware, software, and services.
In this blog, we present the MLPerf Inference benchmark results for a virtualized platform using VMware vSphere 7 and NVIDIA vGPUs. Our results show that vSphere with vGPUs delivers near bare-metal performance.
Architectural Features of NVIDIA Turing T4, TensorRT, and Triton Inference Server
VMware used virtualized NVIDIA Turing T4 GPU in vSphere for MLPerf Inference benchmarks. Therefore, this blog will focus on the architectural features of Turing T4. VMware also used NVIDIA TensorRT and NVIDIA Triton Inference Server. NVIDIA TensorRT™ is an SDK for high performance deep learning inference. It includes a deep learning inference optimizer and runtime that delivers low latency and high throughput for deep learning inference applications.
In our testbed, we used the following NVIDIA products:
- NVIDIA Turing T4 GPU for acceleration. The NVIDIA® T4 GPU accelerates diverse cloud workloads, including high-performance computing, deep learning training and inference, machine learning, data analytics, and graphics. Turing T4 is packaged in an energy-efficient 70-watt, small PCIe form factor. Turing T4’s ability to accelerate diverse workloads is amplified in VMware vSphere making it a suitable for VMware ML/DL workloads as well as Horizon VDI product line.
- NVIDA TensorRT SDK for high performance DL inference. It includes a DL inference optimizer and runtime that delivers low latency and high throughput for DL inference applications.
- NVIDIA Triton Inference Server for serving the inference queries. It deploys AI models at scale in production from any framework from local storage or from any cloud, datacenter, or edge platform.
Turing T4 vs Other NVIDIA GPUs
Table 1 below compares Turing T4 with other NVIDIA GPUs. Turing T4 has 2560 CUDA cores, 320 Tensor Cores, and 40 Ray Tracing (RT) cores.
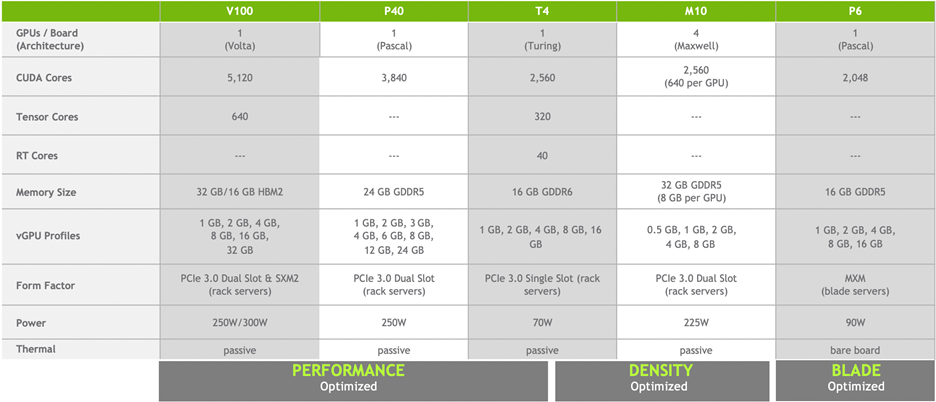
Turing T4 has Tensor Core technology with multi-precision computing to handle diverse workloads. Tensor Cores offer breakthrough performance from FP32 to FP16 to INT8, as well as INT4 precisions. Figure 1 depicts performance gains by appropriately selecting the precision. We chose INT8 precision for MLPerf Inference benchmarks.

Virtualized NVIDIA Turing T4 GPU in VMware vSphere 7
Installing NVIDIA vGPU manager in the vSphere 7 host virtualizes the underlying GPUs. All the different guest operating systems—like Windows and Linux—that are running in VMs share the GPU. The OS in each VM could be running diverse workloads like graphics or ML/AI. See figure 2. The Turing T4 time shares all of its CUDA cores, while the GPU memory is statically partitioned between the VMs.
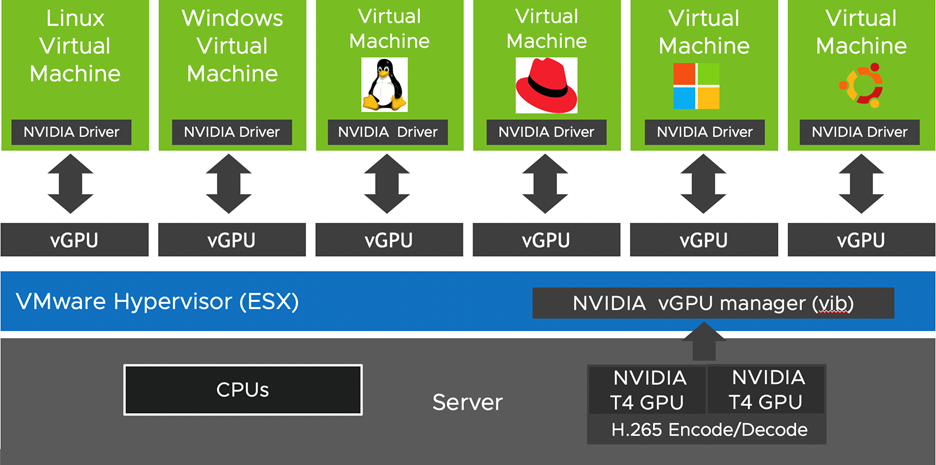
Table 2 below shows different types of vGPU profiles that can be attached to the VMs. The “q” profiles support CUDA/ML and graphics applications. The “c” profiles are compute-only profiles, which support CUDA/ML applications. The table also shows the maximum number of vGPUs per GPU.
Table 2. Turing T4 vGPU Profiles vGPU Type Graphics CUDA Max. # ofvGPUs per GPU GRID T4-1q q q 16 GRID T4-2q q q 8 GRID T4-4[q,c] q q,c 4 GRID T4-8[q,c] q q,c 2 GRID T4-16[q,c] q q,c 1
The MLPerf Inference benchmarks support both q and c profiles. We chose the q profile to highlight the benefits of virtualization; it allows two VMs (one Windows and another Linux) to concurrently run graphics and ML applications on the GPU.
MLPerf Inference Performance in vSphere with NVIDIA vGPU
We benchmarked the following datacenter applications from the MLPerf Inference v0.7.0 suite; see table 3 below. Image classification with ResNet50 and object detection with SSD-ResNet34 are shown in bold because we officially submitted these performance numbers to the MLperf organization. We also validated the vSphere/vGPU performance with benchmarks from different application domains—the results for BERT from natural language processing and 3D-UNET from medical imaging are also presented.
Table 3. MLPerf Inference Benchmarks presented Area Task Model Dataset QSL Size Quality Server Latency Constraint Vision Image classification ResNet50-v1.5 ImageNet (224×224) 1024 99% of FP32 (76.46%) 15 ms Vision Object detection (large) SSD-ResNet34 COCO (1200×1200) 64 99% of FP32 (0.20 mAP) 100 ms Vision Medical image segmentation 3D-UNET BraTS 2019 (224x224x160) 16 99% of FP32 and 99.9% of FP32 (0.85300 mean DICE score) N/A Language Language processing BERT SQuAD v1.1 (max_seq_len=384) 10833 99% of FP32 and 99.9% of FP32 (f1_score=90.874%) 130 msWe focused on Offline and Server scenarios. The Offline scenario processes queries in a batch where all the input data is immediately available. The latency is not a critical metric in this scenario. In the Server scenario, the query arrival is random. Each query has an arrival rate determined by the Poisson distribution parameter. Each query has only one sample. The latency for serving a query is a critical metric.
Hardware/Software Configurations
Table 4 describes the hardware configurations used for bare metal and virtual runs. The virtual configuration used virtualized Turing T4 GPUs denoted by GRID T4-16Q vGPU. Both the systems had the same 4x Turing T4 physical GPUs. The benchmarks were optimized using NVIDIA TensorRT. NVIDIA Triton Inference server was used to serve inference queries.
Table 4. Bare Metal vs. Virtual Server Configurations Bare Metal Virtual Configuration System Dell EMC PowerEdge R740 Dell EMC PowerEdge R740 Processors 2x Intel®Xeon® Gold 6248R CPU @ 3.00GHz 2 x Intel® Xeon® Gold 6232 CPU @ 2.60GH GPU 4x NVIDIA T4/16GB GPU 4x NVIDIA GRID T4-16Q vGPU Memory 384GB/12 x 32GB DIMMs, DDR-4/2933 MHz 384GB/12 x 32GB DIMMs, DDR-4/2933 MHz Disk Controller PERC H740P Adapter PERC H740P Adapter Storage 3.84 TB SSD vSAN 6TB OS Ubuntu 18.04.4 LTS Ubuntu 18.04.4 LTS VM invSphere 7.0 NVIDIA Driver 418.67 GRID Driver 450.51.05 CUDA 11.0 11.0 Container NVDIA-Docker2 NVIDIA-Docker2 MLPerf Inference V0.7.0 V0.7.0
MLPerf Inference Performance Results for Bare-Metal and Virtual Configurations
Figure 3 compares throughput (queries processed per second) for MLPerf Inference benchmarks using vSphere 7.x using NVIDIA vGPUs with the bare-metal configuration. vSphere with NVIDIA vGPUs delivers near bare-metal performance, ranging from 91% to 98% for Offline and Server scenarios for MLPerf Inference benchmarks.
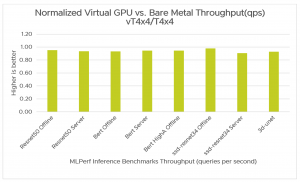
Table 5 shows throughput numbers for MLPerf inference benchmarks.
Table 5. Bare Metal vs. vGPU Throughput (queries/second) Benchmark Bare Metal Virtual vT4x4/BM *ResNet50 Offline 23,844 22725 0.95 *ResNet50 Server 21,805 20400 0.94 BERT Offline 1,738 1621 0.93 BERT Server 1,348 1273 0.94 BERT HighA Offline 743 702 0.94 *ssd-resnet34 Offline 546 534 0.98 *ssd-resnet34 Server 469 425 0.91 3d-unet 29 26.94 0.93* These results were obtained before the MLPerf Inference v0.7.0 submission deadline and were published by MLPerf.
Scaling with Number of vGPUs
Seeing how throughput increases as the number of vGPUs attached to the VM increases is another important dimension of our performance investigations. The scaling observed for different benchmarks is listed in table 6.
Table 6. Scaling with number of vGPUs Benchmark vT4x1 vT4x4 Scale ResNet50 Offline 5,810 22,725 3.91 BERT Offline 379 1,621 4.28 BERT High Accuracy Offline 176 702 3.99 ssd-resnet34 Offline 129 534 4.14The scaling is from the range 3.91 to 4.28 when the number of vGPUs scaled from 1 to 4. It is important to note that each independent run is subject to run-to-run variation in the system’s run-time conditions. The scaling with number of vGPUs is almost linear.
Takeaways
- VMware vSphere using NVIDIA vGPUs delivers near bare-metal performance for MLPerf Inference v0.7.0 benchmarks.
- The throughput (queries processed per second) increases linearly as the number of vGPUs attached to the VM increases.
- VMware vSphere 7 combines the power of NVIDIA vGPUs with the datacenter management benefits of virtualization.
Acknowledgements
VMware thanks Ramesh Radhakrishnan of Dell for providing the hardware and engaging with NVIDIA to achieve VMware’s first inference submission to MLPerf.
References
Recommend
About Joyk
Aggregate valuable and interesting links.
Joyk means Joy of geeK