

Product competitor research — a framework, tips and tricks
source link: https://treatwell.engineering/product-competitor-research-a-framework-tips-and-tricks-90cbb56e045b
Go to the source link to view the article. You can view the picture content, updated content and better typesetting reading experience. If the link is broken, please click the button below to view the snapshot at that time.
Product competitor research — a framework, tips and tricks

Summary
A real-world-tested framework, tips and tricks for conducting competitor analysis research with a marketplace account, checkout and payments product focus.
Introduction
Conducting your own market and competitor research is hard and time-consuming. But get it right and it could be an incredibly powerful tool to position your business, product or service offering in your market and identify unique opportunities, strengths and weaknesses.
There are already established frameworks for conducting market research, such as SWOT, Porter’s 5 Forces and my personal favourite Growth-Share Matrix (learn about these frameworks here). Equally, here’s another great resource for business, product, brand and marketing competitor research.
In this article, I want to focus on a specific aspect of the research: product and product strategy. My framework can help product managers, designers, marketeers and researchers collect, analyze, share and ultimately turn insights into actionable outcomes to drive valuable product change.
Competitor and market research at Treatwell
At Treatwell, our marketplace brings hair and beauty salons online allowing consumers to browse, book and manage all of their beauty appointments online.
Our product teams always sense-check solutions (the how) with market research during the design phase. Researching to identify opportunities (the what and the why) is less common and not quite yet part of our playbook.
My team and I own Checkout, Payments, Account and transactional communications like emails, SMS and App push notifications.
We embody our company value to put customers first and we aim to live by our mission to help our customers secure that perfect appointment to keep them coming back time and time again. With that in mind, the Account is the enabler for those delightful, personalised customer experiences and a driver for key business metrics like retention, organic growth through salon exploration and revenue generation.
Our remit is large. Opportunities are almost endless. With so many big bets to go after, it’s tricky to know how and where to focus. I wanted to see how we benchmark in our industry, but I couldn’t find any relevant online research. Searching for things like marketplace account competitor research would return the same generic medium blog posts on how to do competitor research, and energy providers, for some bizarre reason. So I decided to make my own.
A competitor analysis framework, tips and tricks
I found three clear stages in developing the framework and conducting my research.
Stage 1. Understand and define your research goals.
Stage 2. Explore your approach and value of findings. Then collect your data.
Stage 3. Document, share, learn, repeat, polish.
Stage 1. Understand and define your research goals.
Key takeaways: Before jumping into the weeds, it’s crucial to clearly understand and define why you are doing this research and focus on what’s important to you.

There are many different reasons why you may want to conduct this kind of research, and this will depend on factors such as your industry, your role, your product (and company) maturity etc.
My goal was to benchmark our product against some specific topics:
- product capabilities, strengths and weaknesses
- strategic design choices such as app/web product parity, guest checkout vs forced sign-in and upgrading web users to the app.
Stage 2. Explore the approach and value of findings. Then collect your data.
Key takeaways: Start broad to explore and define your approach before diving in. Validate that the data you’re capturing is interesting before increasing the scale of your research and documenting your findings. Embrace a fluid process over a rigid one, be prepared to adjust as you go along.

Once you’ve got your goals clearly defined, it’s time to get to work. As a researcher, this is the most enjoyable bit, right? You get to be curious and get answers, fast.
This kind of research takes time, so you need to be very careful to not go down rabbit holes at this point, but keep an open mind in case something interesting comes up.
Start off by identifying which competitors and other industries to focus on. Start playing around with their products. Use your gut (or previous research) to choose which ones to look at, but also try a few different ones that you have a hunch may be interesting to look into.
Since I was starting with a blank state, I wanted to spend a bit of time looking at a broad range of providers. I created accounts (on the different sites) and quickly identified which ones were interesting to look at more thoroughly. Besides our competitors, I knew that restaurant bookings and travel were the closest to our industry, but I also looked at retail e-commerce, challenger banks and food delivery. In total, I considered and explored 70 providers across 14 different industries.
I captured notes and interesting findings in a Google sheet and took screenshots for visual reminders. I literally captured a bullet point list of all the major features and capabilities as I was discovering them.
Initially, I had a few feature categories, which changed over time as the list grew. The nice thing was that clear patterns emerged quickly and I started to identify the key unique selling propositions (USPs) for each competitor, as well as gaps.
I used a traffic light system to give a (subjective) score for each USP, 0 being low and 4 being the maximum score. This helped simplify the findings and give a benchmark at a glance.

Most importantly, the approach was working and this gave me the confidence to progress, finish the data collection and start documenting the findings.
Stage 3. Document, share, learn, repeat, polish.
Key takeaways: Think carefully about why and how you share your research. Documenting is very time-consuming. Start with just enough quality and get feedback before polishing. Sharing will give rise to new ideas.

The true value of knowledge is how it is used. I had two uses in mind:
- Inspire similar research for our other products. Feedback from my peers was important to make that happen.
- Drive positive change in my product.
The challenge was distilling large, rich insights into something that can be easily digestible, objective, polished enough and relevant for a wide audience. The following tips helped me achieve my goals:
- Share early, learn and address feedback
- Making it presentable, polished (enough) and easy to digest
- Make it relevant and share engagingly
Share early, learn and address feedback
When I was happy with my draft findings, I shared it with some peers for some early feedback. I mainly wanted to see if this framework and content itself was likely to inspire the change I was looking for.
The most valuable feedback was that the Account strength traffic light system felt too subjective. The consequence of a lack of objective evidence is the ease at which it can be challenged. I had to rethink the entire approach to the collection and synthesis.
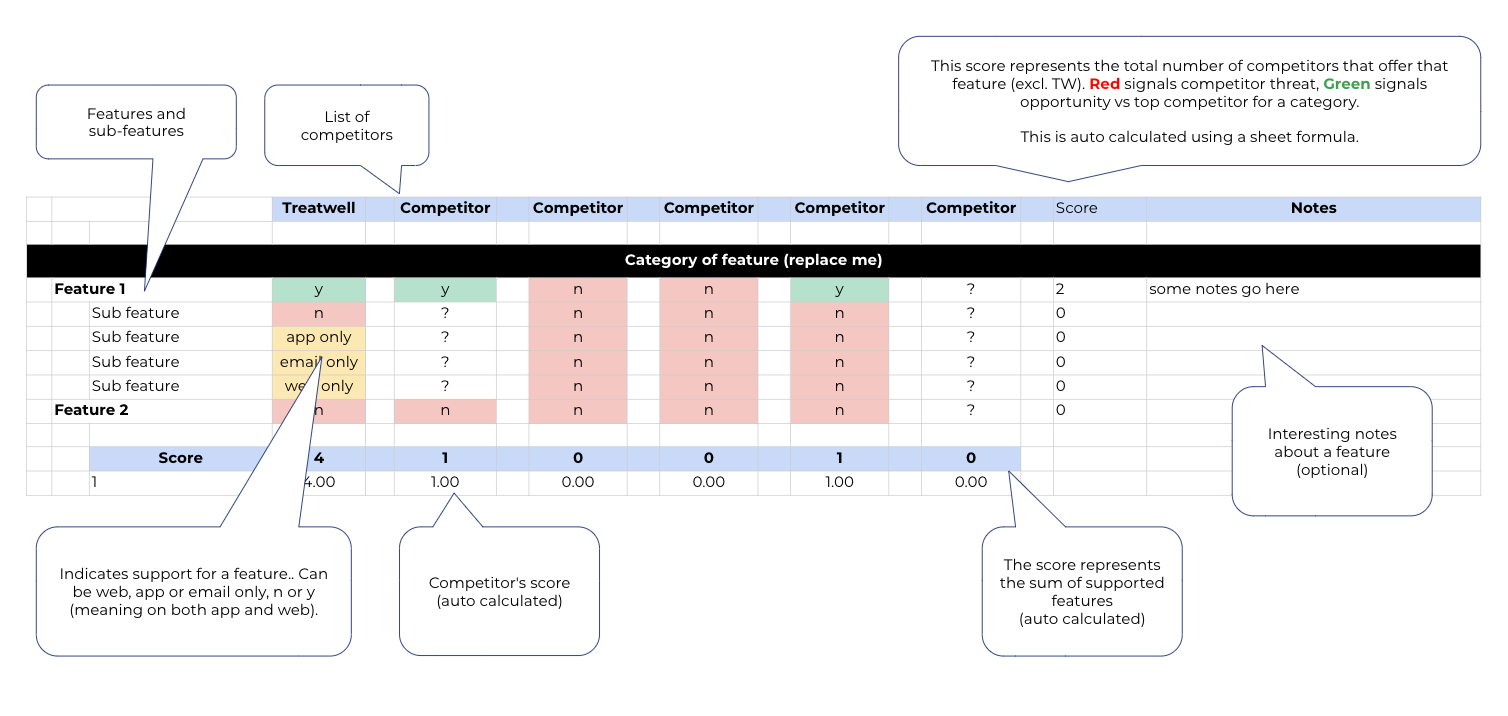
This led to a more standardised and consistent approach to capturing the data. I replaced the rough notes with a list of features (and sub-features) for each USP area, with its own traffic light system: a yes/no, indicating the support for that particular feature. If the feature was not available on all channels and platforms, this was indicated by app/web/email only.

This standardised data capture method had other, clear benefits:
- It further solidified the Account product USPs, and which USP features belonged to. For example, managing marketing preferences better belonged to Personalisation/Recommendations rather than Profile.
- It objectified the research via a scoring system for the overall Account benchmarking. A given score is calculated based on the number of features for a given USP.
- Ultimately, it transformed the findings into clear, actionable, objective insights

A caveat with this approach is its limitations, for which I go into a bit more detail later in this article. The rudimentary ranking and inferred optimum feature set can lead to a “featurist” approach to building products, which itself can lead to an over-complicated, unfit for purpose product. The scoring is not weighted so all features are essentially considered equal, which of course real life is not the case. Some capabilities are much more desired and useful than others.
Making it presentable, polished and easy to digest
The Google spreadsheet with the raw data was too noisy and not ideal to be consumed by a wider audience. A slide deck summarising the main findings was a far better choice.
In order to make it truly digestible, I included guides on how to read the framework, as well as screen recordings of the competitor products to help visualise the capabilities.
Screen recordings are way more useful because they keep the number of slides down (nobody likes death by PowerPoint) but also it gives the audience a better idea of the user journey and the experience. It also enables an easy way to capture their own insights (more on this in the next section).
To make it actionable, I included clear summaries and recommendations.
Make it relevant and share engagingly
To inspire further research in other product areas but also to generate other ideas and insights (other than my own), I hosted a Think Tank with the rest of the Product community (product managers, designers and analysts). The aim was to generate new insights and candidate ideas to drive product change and a discussion to critically evaluate the framework itself, towards future applications.
Limitations with this type of research
Any good product person knows that copying like for like is never a good idea. You need to interpret why a competitor chose specific features and designs.
To make the scoring more robust, weighing could be applied to each capability to reflect true nature: some capabilities are much more useful (and desired) than others.
As a general point, competitor research should be treated as just one data point that can influence product change, alongside other sources to understand customer needs and problems better. As previously highlighted, there’s no such thing as an optimum feature set for a product. Each product is unique and is bound to its context: the users, the industry, the (product and company) maturity and so on. The “featurist” approach to building products, can lead to an over-complicated, unfit for purpose products.
In conclusion. Has this framework been useful so far?
In short, yes. As a reminder, my goals were to inspire change in my own products but also organisational change to bring more competitive research into how we work.
An example on the product front is that we’ve decided to experiment with requiring users to sign-in at checkout, a change from our guest checkout approach. We’ve always been reluctant to try this because of the likely negative impact on conversion, however, this research has given us the confidence to at least experiment with this design change.
As a product community, we’ve committed to some next steps:
- Apply the framework to new competitors.
- Apply the framework to other industries, focusing specifically on high opportunity areas, such as loyalty.
- Work on developing the framework further, making it part of Treatwell’s product and design tool library
Want to know more? Get in touch.
If you’d like to know more about Product, Tech and research at Treatwell, this framework and research or if you’d love to give some feedback, please reach out. Find me at [email protected], on Twitter or Linkedin.
Recommend
About Joyk
Aggregate valuable and interesting links.
Joyk means Joy of geeK