

Linux top: Here’s how to customize it
source link: https://haydenjames.io/linux-top-customize-it/
Go to the source link to view the article. You can view the picture content, updated content and better typesetting reading experience. If the link is broken, please click the button below to view the snapshot at that time.
The top command – referred to below as Linux top – is a command on Unix and Unix-like systems such as Linux, which provides a dynamic real-time overview of a running system. It can display system summary information and a list of processes or threads currently being managed by the Linux kernel. The types of system summary information shown by Linux top command and the order and size of information displayed are all user-configurable, and configuration changes can be made persistent across restarts.

Of course, at times, you’ll need to dig a bit deeper than Linux top command. Especially for application performance monitoring, log analytics, etc. Please look at some of the solutions in my 100 Top Server Monitoring & Application Performance Monitoring (APM) Solutions list. Also see: atop, glances, htop.
Linux top command provides an interactive interface for process manipulation and a much more extensive interface for personal configuration that encompasses almost every aspect of its operation.
Customizing the Linux top command: Getting started
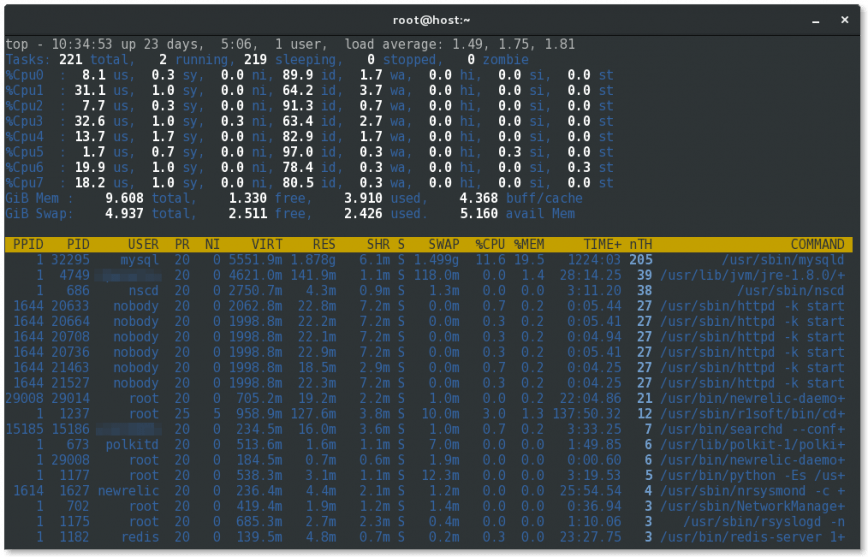
To run Linux top, type top from the command line. By default, the Linux top command will look similar to the above screenshot. To customize, let’s begin with the memory scale by pressing E (shift + e) and e then save changes using W (shift + w) and continue from there:
E: Extend-Memory-Scale in Summary Area – With this command, you can cycle through the available summary area memory scaling, which ranges from KiB (kibibytes or 1,024 bytes) through EiB (exbibytes or 1,152,921,504,606,846,976 bytes). If you see a `+’ between a displayed number and the following label, it means that top was forced to truncate some portion of that number. By raising the scaling factor, such truncation can be avoided.
e: Extend-Memory-Scale in Task Windows – With this command, you can cycle through the available task window memory scaling, which ranges from KiB (kibibytes or 1,024 bytes) through PiB (pebibytes or 1,125,899,906,842,624 bytes). While top will try to honor the selected target range, additional scaling might still be necessary to accommodate current values. If you wish to see a more homogeneous result in the memory columns, raising the scaling range will accomplish that goal. However, raising it too high is likely to produce an all zero result, which cannot be suppressed with the 0 (numeric not the letter) interactive command.
Next, when monitoring MySQL, Apache (and/or Nginx), and other threaded software. It can be useful to add a column for the number of threads (nTH). You can do this using Fields-Management.
f | F: Fields-Management – These keys display a separate screen where you can change which fields are displayed, their order, and also designate the sort field. I’ve added PPID (Parent Process Id), SWAP, and nTH.
Here are the other customization options I’ve used:
c: Command-Line/Program-Name toggle
This command will be honored whether or not the COMMAND column is currently visible. Later, should that field come into view; the change you applied will be seen.
f | F: Fields-Management
These keys display a separate screen where you can change which fields are displayed, their order, and also designate the sort field. For additional information on these interactive commands,
see topic 3b. MANAGING Fields.
1: Single/Separate-Cpu-States toggle
This command affects how the `t’ command’s Cpu States portion is shown. Although this toggle exists primarily to serve massively-parallel SMP machines, it is not restricted to solely SMP environments. When you see `%Cpu(s):’ in the summary area, the `1′ toggle is On, and all CPU information is gathered in a single line. Otherwise, each CPU is displayed separately as: `%Cpu0, %Cpu1, …’ up to available screen height.
b: Bold/Reverse toggle
This command will impact how the `x’ and `y’ toggles are displayed. It may also impact the summary area when a bar graph has been selected for CPU states or memory usage via the t or m toggles.
x: Column-Highlight toggle
Changes highlighting for the current sort field. If you forget which field is being sorted, this command can serve as a quick visual reminder, providing the sort field is being displayed. The sort field might not be visible because 1) there is insufficient Screen Width 2) the `f’ interactive command turned it Off. Note: Whenever Searching and/or Other Filtering is active in a window, column highlighting is temporarily disabled. See the notes at the end of topics 5d. SEARCHING and 5e. FILTERING for an explanation why.
y: Row-Highlight toggle
Changes highlighting for “running” tasks. For additional insight into this task state, see topic 3a. DESCRIPTIONS of Fields, the `S’ field (Process Status). Use of this provision provides important insight into your system’s health. The only costs will be a few additional TTY escape sequences.
z: Color/Monochrome toggle
Switches the `current’ window between your last used color scheme and the older form of black-on-white or white-on-black. This command will alter both the summary area and task area but does not affect the state of the `x,’ `y,’ or `b’ toggles.
i: Idle-Process toggle
Displays all tasks or just active tasks. When this toggle is Off, tasks that have not used any CPU since the last update will not be displayed. However, due to the granularity of the %CPU and TIME+ fields, some processes may still be displayed that appear to have used no CPU. If this command is applied to the last task display when in alternate-display mode, it will not affect the window’s size, as all prior task displays will have already been painted.
Z: Change-Color-Mapping
This key will take you to a separate screen where you can change the colors for the `current’ window or all windows.
W: Write-the-Configuration-File
This will save all of your options and toggles plus the current display mode and delay time. By issuing this command just before quitting top, you will be able to restart later in exactly that
same state.
You can continue to customize by reading the full Linux top man page using the command: man top, where you will find additional tips such as filtering Linux top command output by user. You can start top with top -u enteruser. You can also press h while viewing top to open the “Help for Interactive Commands” screen. This post should serve as a quick guide to encourage you to explore customization, allowing you to get the most out of the Linux top command! Below, or at the very top of this post (using color), you can see the result of Linux top tweaks:
How to revert/start over with default Linux top
mv ~/.toprc ~/.toprc_bk
rm ~/.toprc
Reference: man top.
Originally published: September 8th, 2017
Last updated: November 11th, 2020
Recommend
About Joyk
Aggregate valuable and interesting links.
Joyk means Joy of geeK