

Go, Graphs and Graphviz
source link: https://tpaschalis.github.io/golang-graphviz/
Go to the source link to view the article. You can view the picture content, updated content and better typesetting reading experience. If the link is broken, please click the button below to view the snapshot at that time.
Go, Graphs and Graphviz
Preparing for my latest interview this past summer, had me working with graphs again. I’m also trying to make some time to toy around with dgraph; I kind of enjoy dealing with that type of problems, mainly for those breakthrough a-ha! moments that come around once every while.
Building a simple graph in Go, is straightforward, but a visual representation is immensely helpful to get a quick overview and investigate edge-cases (no pun intended).
Unfortunately, many of the solutions I found were a little cumbersome, but why not use the magic of Graphviz? Let’s go through a demonstration of our own, without no external packages required! We’re going to recreate this example.
First off, we define the graph properties, the edges, the nodes, and a couple of helpers function.
Afterwards, we’ll define a simple Stringer interface for our graph and its edges, which we can then pipe to Graphviz.
Hope this doesn’t contain any glaring errors, as it was whipped up in a couple of minutes, seems to be working for most basic cases.
package main
import "fmt"
type edge struct {
node string
label string
}
type graph struct {
nodes map[string][]edge
}
func newGraph() *graph {
return &graph{nodes: make(map[string][]edge)}
}
func (g *graph) addEdge(from, to, label string) {
g.nodes[from] = append(g.nodes[from], edge{node: to, label: label})
}
func (g *graph) getEdges(node string) []edge {
return g.nodes[node]
}
func (e *edge) String() string {
return fmt.Sprintf("%v", e.node)
}
func (g *graph) String() string {
out := `digraph finite_state_machine {
rankdir=LR;
size="8,5"
node [shape = circle];`
for k := range g.nodes {
for _, v := range g.getEdges(k) {
out += fmt.Sprintf("\t%s -> %s\t[ label = \"%s\" ];\n", k, v.node, v.label)
}
}
out += "}"
return out
}
func main() {
g := newGraph()
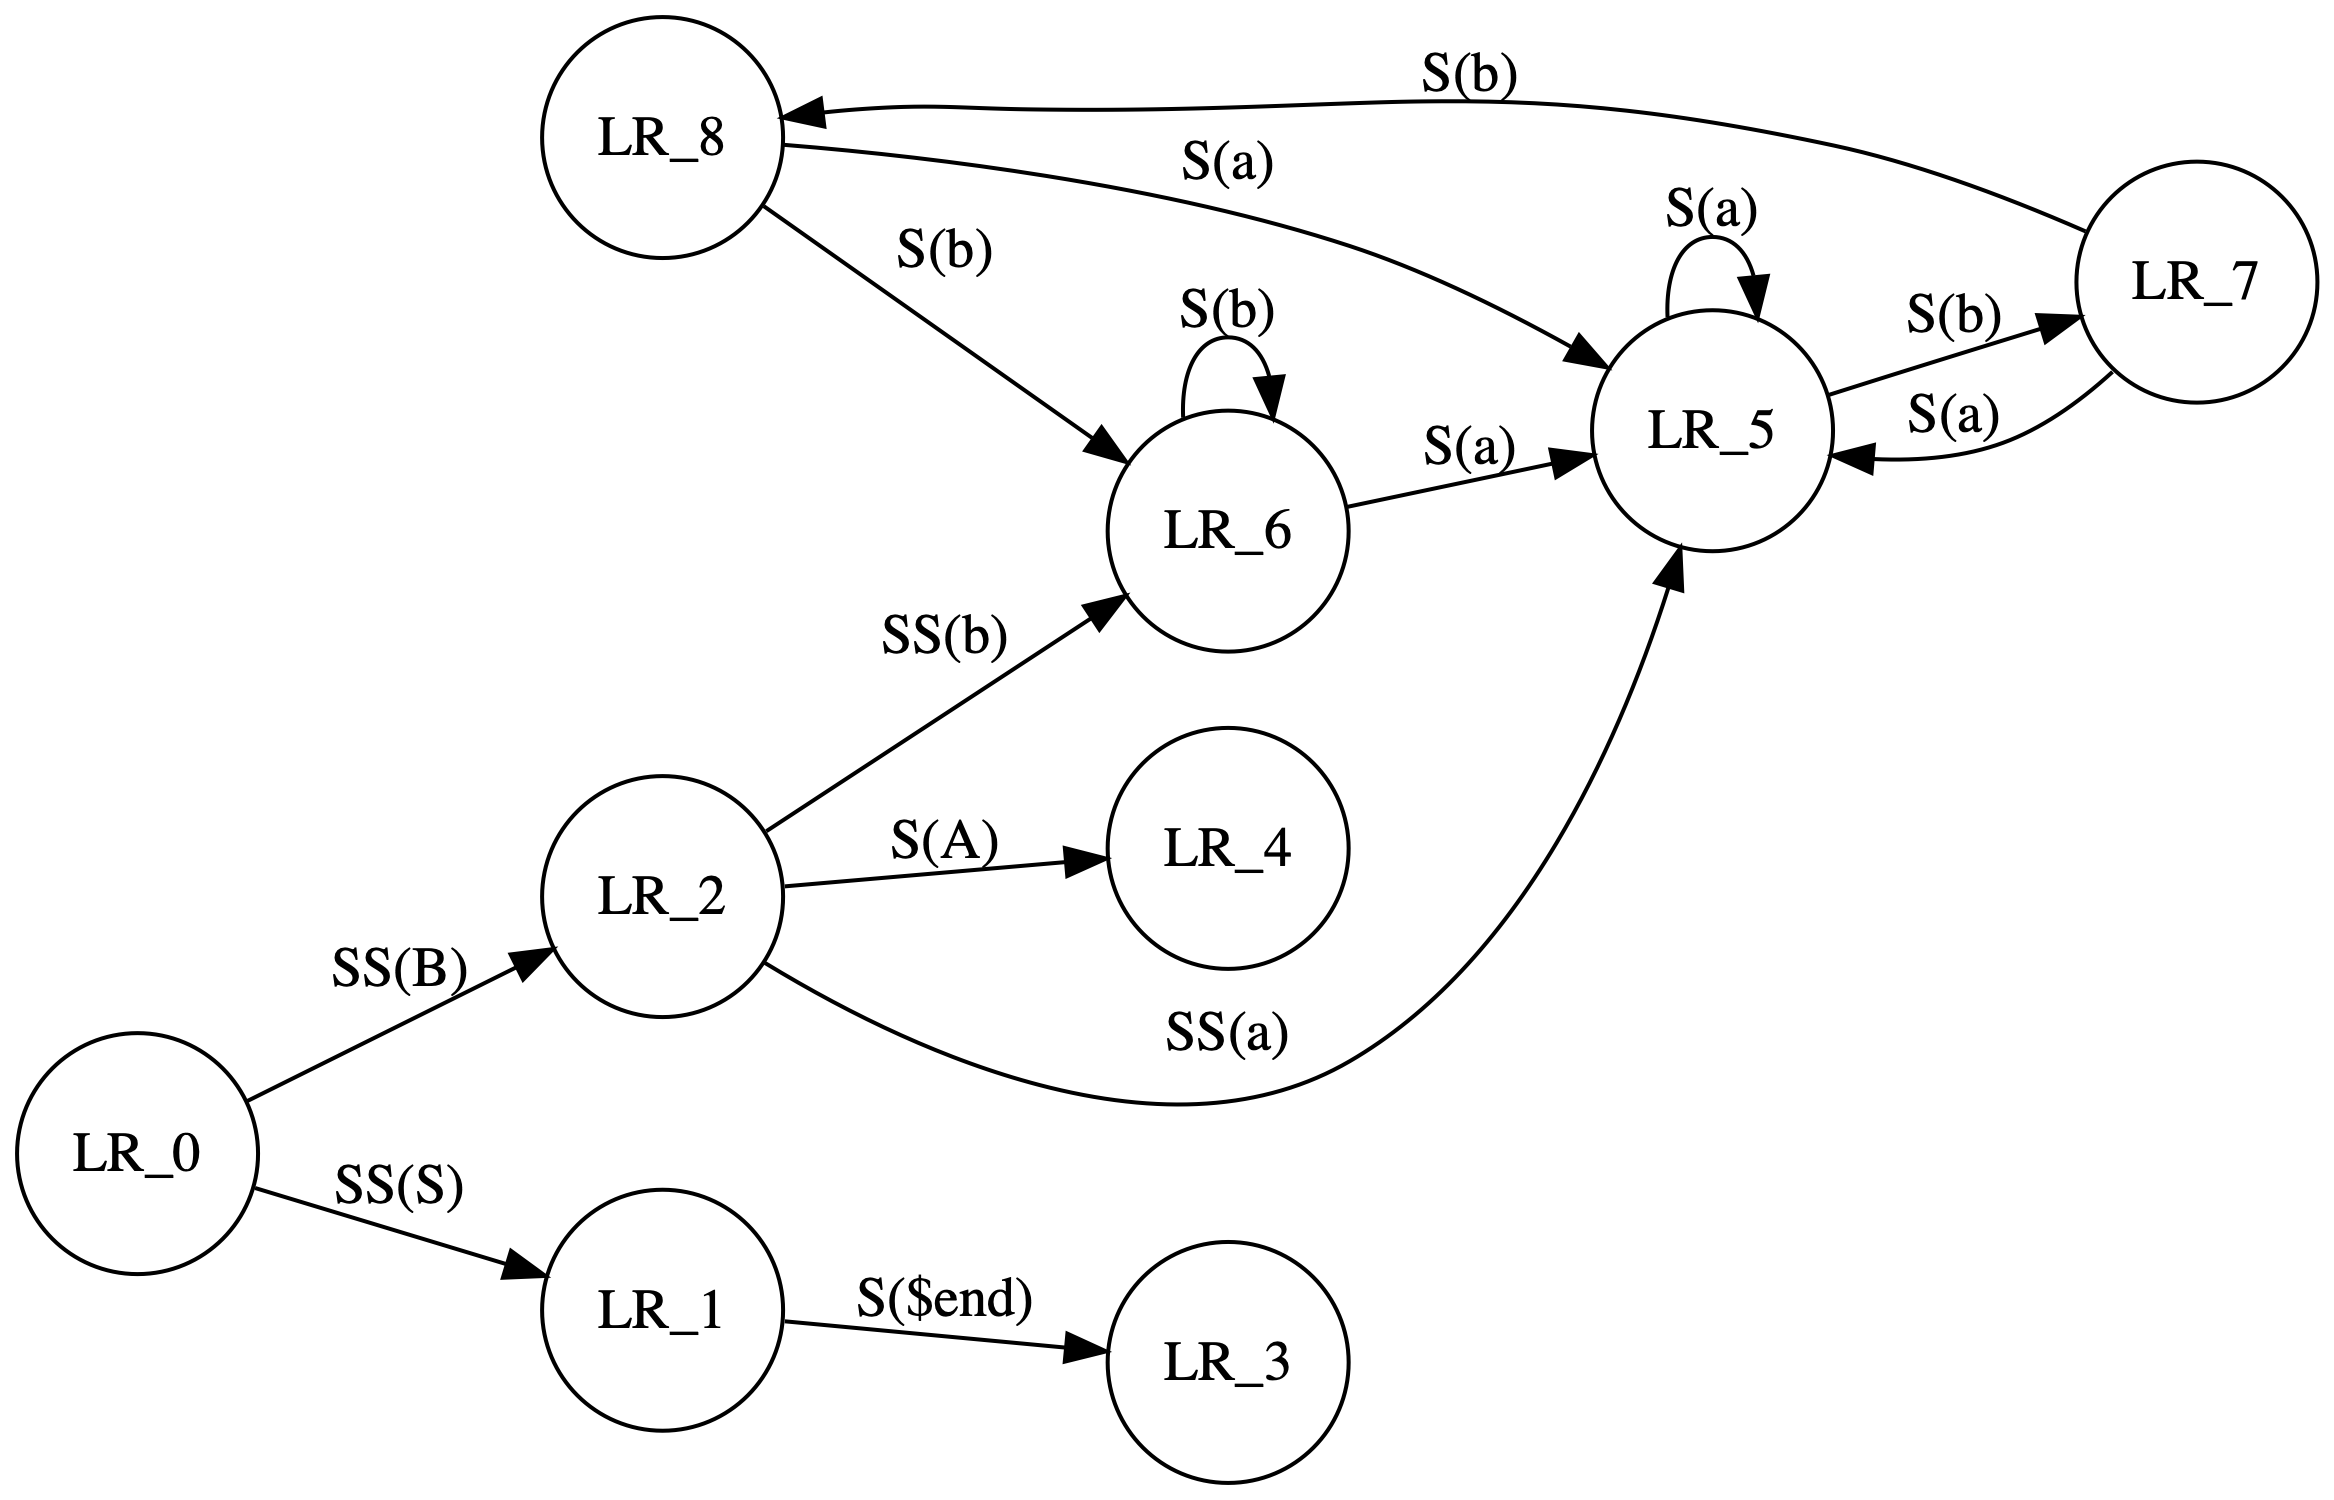
// https://graphviz.gitlab.io/_pages/Gallery/directed/fsm.html
g.addEdge("LR_0", "LR_2", "SS(B)")
g.addEdge("LR_0", "LR_1", "SS(S)")
g.addEdge("LR_1", "LR_3", "S($end)")
g.addEdge("LR_2", "LR_6", "SS(b)")
g.addEdge("LR_2", "LR_5", "SS(a)")
g.addEdge("LR_2", "LR_4", "S(A)")
g.addEdge("LR_5", "LR_7", "S(b)")
g.addEdge("LR_5", "LR_5", "S(a)")
g.addEdge("LR_6", "LR_6", "S(b)")
g.addEdge("LR_6", "LR_5", "S(a)")
g.addEdge("LR_7", "LR_8", "S(b)")
g.addEdge("LR_7", "LR_5", "S(a)")
g.addEdge("LR_8", "LR_6", "S(b)")
g.addEdge("LR_8", "LR_5", "S(a)")
fmt.Println(g)
}
We now can do something like
$ go run main.go > mygraph.dot
$ dot -Tps mygraph.dot -o mygraph.ps
$ dot -Tpng -Gdpi=300 mygraph.dot > mygraph.png
The result is a beautiful vector image that looks like
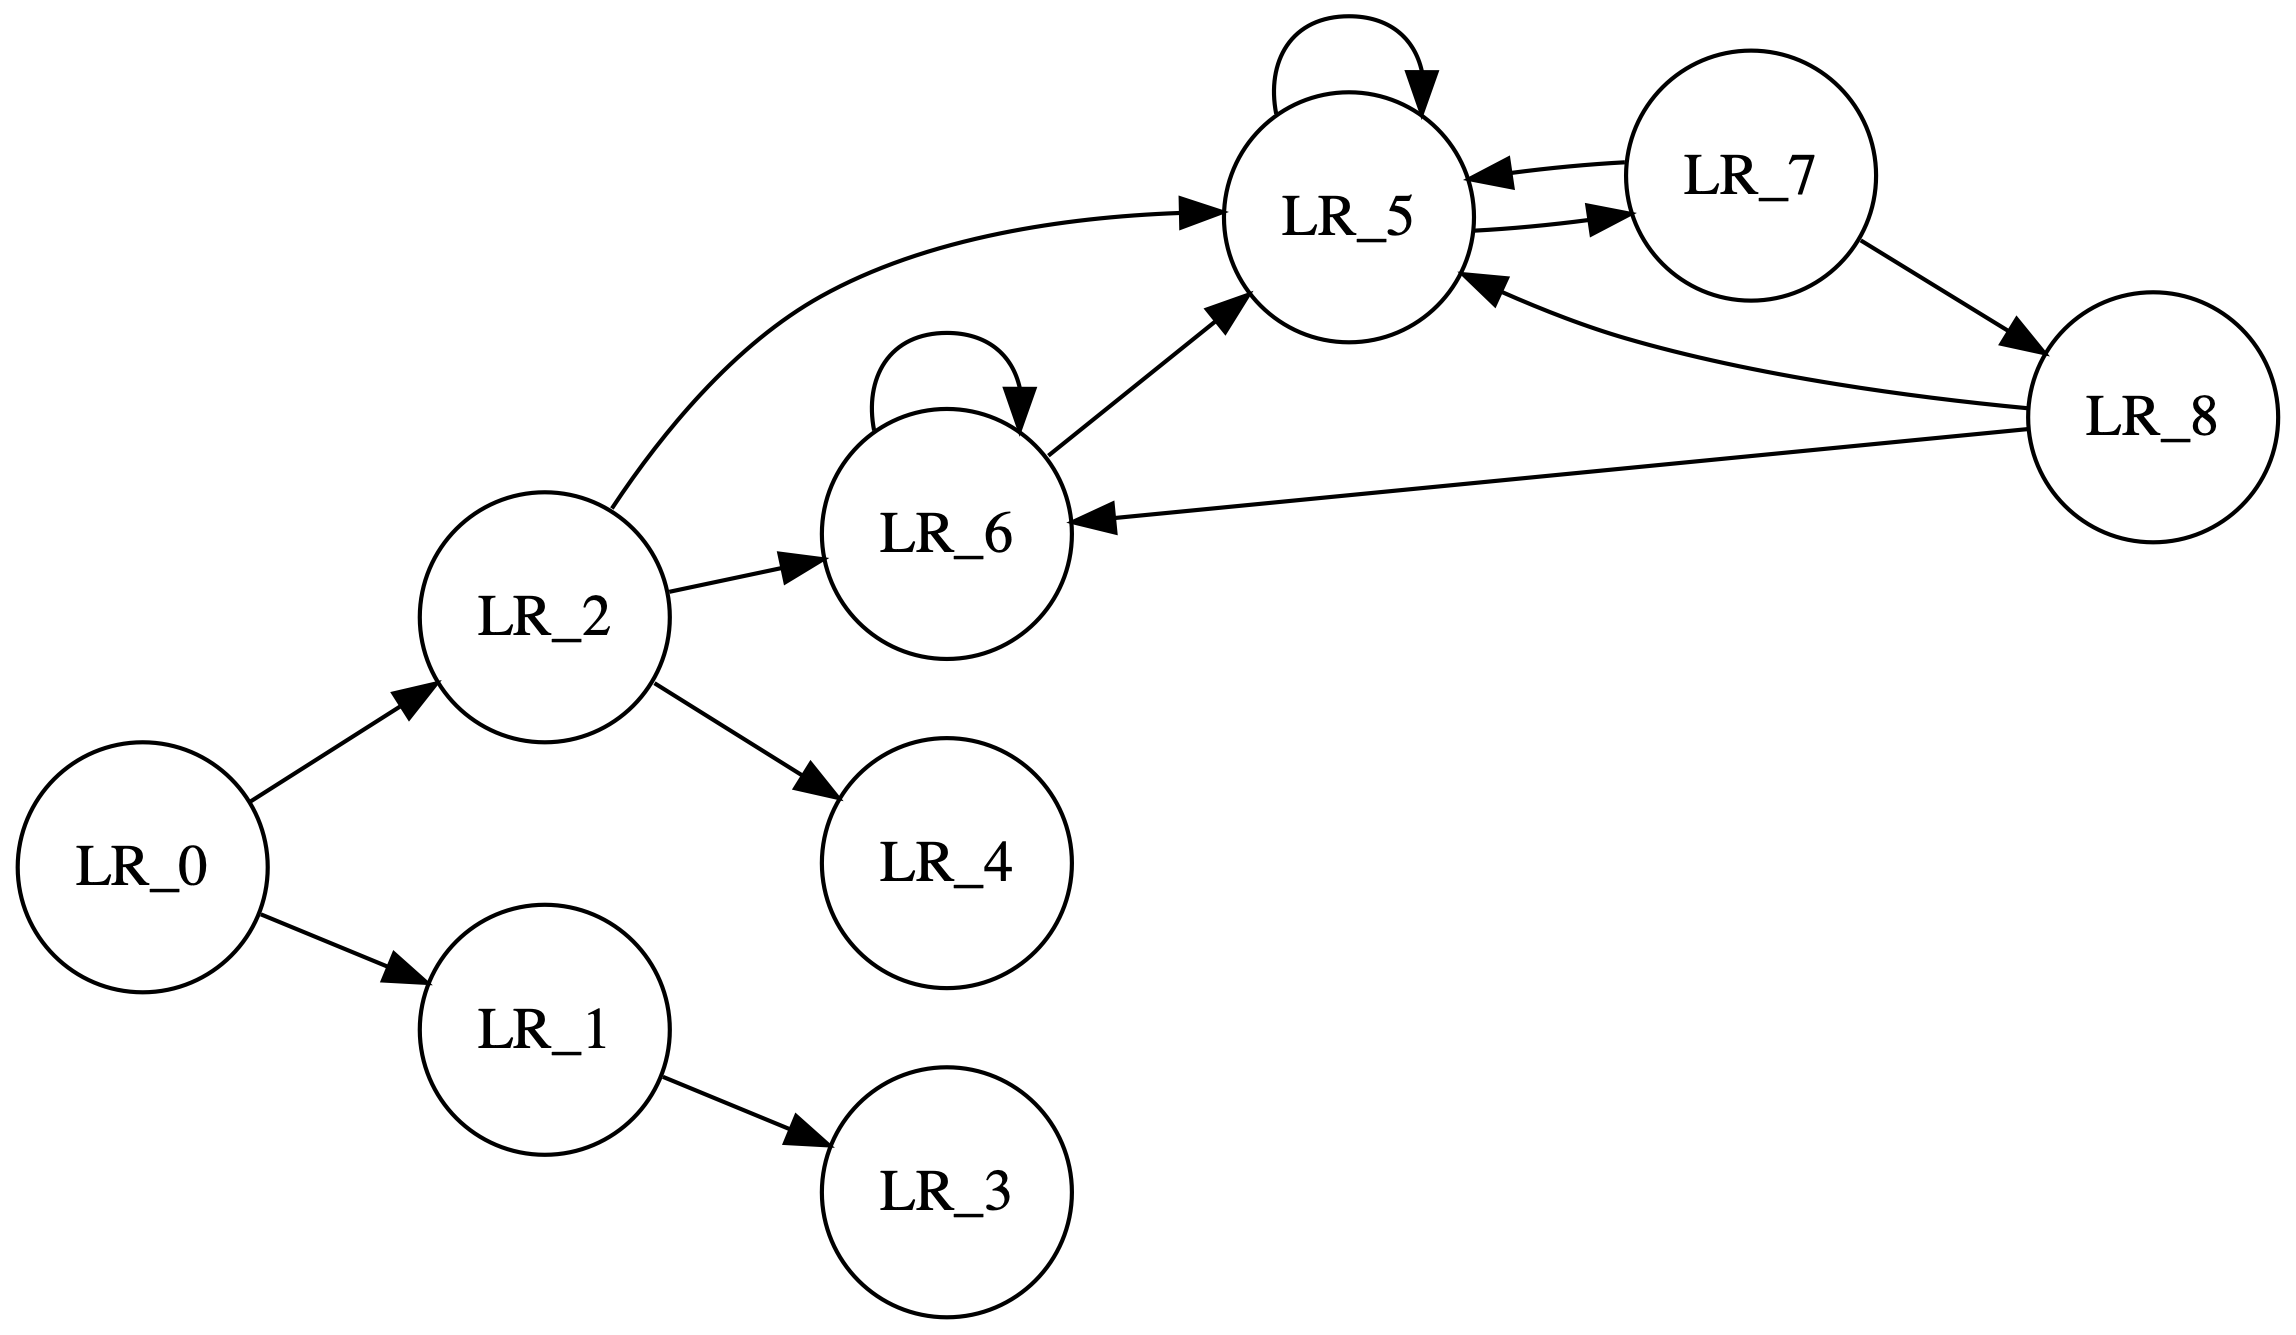
That’s all for now!
Recommend
About Joyk
Aggregate valuable and interesting links.
Joyk means Joy of geeK