

Flutter 绘制图表(一)柱状图📊
source link: https://coldstone.fun/post/2020/05/31/flutter-bar-chart/
Go to the source link to view the article. You can view the picture content, updated content and better typesetting reading experience. If the link is broken, please click the button below to view the snapshot at that time.
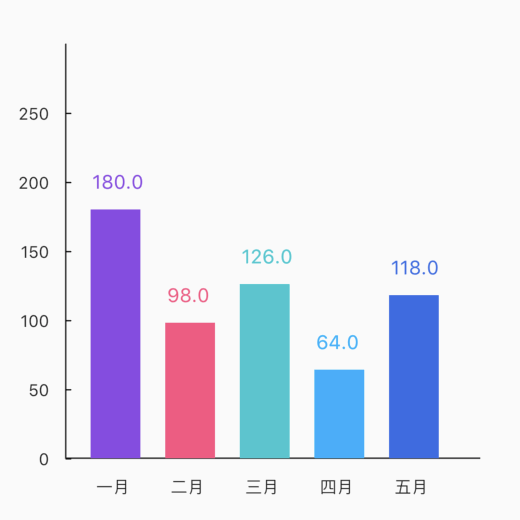
本文讲解如何使用 Flutter (Google 开源的 UI 工具包,帮助开发者通过一套代码库高效构建多平台精美应用,支持移动、Web、桌面和嵌入式平台) 绘制一个带有动画效果的柱状图表,最终效果如下图。
要绘制这样的图表普通的 Widget 难以实现,这时就需要 CustomPaint 和 CustomPainter 出场了,它们类似于 Web 里面的 <canvas> 元素,CustomPaint 提供了一个绘制区域,而 CustomPainter 拥有具体的绘制方法。
CustomPaint 是什么
CustomPaint 是用来提供画布的控件,它使用传入画笔 painter 在 child 控件后面绘制图形, ,foregroundPainter 画笔绘制在 child 控件之前。size 属性控制画布的大小,假如定义了子控件 child,那么画布的大小将由子控件的大小决定,size 属性被忽略。
1
2
3
4
5
6
7
8
9
10
11
class CustomPaint extends SingleChildRenderObjectWidget {
  const CustomPaint({
    Key key,
    this.painter,
    this.foregroundPainter,
    this.size = Size.zero,
    this.isComplex = false,
    this.willChange = false,
    Widget child,
  })
}
而 CustomPainter 是实现绘制图形的控件,要在画布上绘制图形需要实现它的 paint 方法。paint 方法有两个参数,Canvas canvas 和 Size size。Size 对象表示画布的尺寸,Canvas 对象上是具体的绘制图形的方法。
1
2
3
4
5
abstract class CustomPainter extends Listenable {
  void paint(Canvas canvas, Size size);

bool shouldRepaint(covariant CustomPainter oldDelegate);
}
Canvas canvas 对象主要的绘制图形方法有
drawColor
Color color, BlendMode blendMode
绘制颜色到画布上
drawLine
Offset p1, Offset p2, Paint paint
两点之间画线
drawPaint
Paint paint
使用 [Paint] 填充画布
drawRect
Rect rect, Paint paint
绘制矩形
drawRRect
RRect rrect, Paint paint
绘制带圆角的矩形
drawOval
Rect rect, Paint paint
绘制椭圆
drawCircle
Offset c, double radius, Paint paint
绘制圆形
drawArc
Rect rect, double startAngle, double sweepAngle, bool useCenter, Paint paint
绘制弧形
drawPath
Path path, Paint paint
绘制路径
drawImage
Image image, Offset p, Paint paint
绘制图像
drawPoints
PointMode pointMode, List<Offset> points, Paint paint
绘制多个点
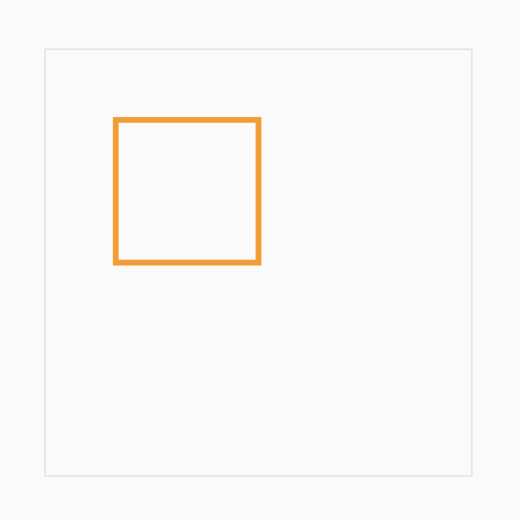
要将图形绘制到画布上需要先创建一个继承至 CustomPainter 的自定义画笔,例如绘制一个矩形需要实现一个绘制矩形的画笔 RectanglePainter,然后在画布 CustomPaint 上应用它。
1
2
3
4
5
6
7
8
9
10
11
12
13
14
15
16
17
18
19
20
21
22
23
24
25
26
27
28
29
30
31
32
33
34
35
36
37
38
39
40
41
class RectanglePainter extends CustomPainter {
  @override
  void paint(Canvas canvas, Size size) {
    // 定义一个矩形
    final Rect rect = Rect.fromLTWH(50.0, 50.0, 100.0, 100.0);
    // 指定绘制的样式
    final Paint paint = Paint()
      ..color = Colors.orange
      ..strokeWidth = 4.0
      ..style = PaintingStyle.stroke
      ..isAntiAlias = true;

// 使用 drawRect 绘制矩形
    canvas.drawRect(rect, paint);
  }

@override
  bool shouldRepaint(RectanglePainter oldDelegate) => false;
}

class Rectangle extends StatelessWidget {
  @override
  Widget build(BuildContext context) {
    return Center(
      child: CustomPaint(
        // 使用 RectanglePainter 在画布上绘制
        painter: RectanglePainter(),
        child: Container(
          width: 300,
          height: 300,
          decoration: BoxDecoration(
            border: Border.all(
              width: 1.0,
              color: Colors.grey[300],
            ),
          ),
        ),
      ),
    );
  }
}
绘制柱状图表
介绍完毕,下面开始绘制柱状图表,第一步创建 BarChart 控件代表柱状图,它有两个构造参数一个是 data 用来接收图表数据,以及 xAxis 表示图表横轴标识。
1
2
3
4
5
6
7
8
9
10
11
12
13
14
15
16
17
18
19
20
21
22
23
24
25
26
27
28
29
30
class BarChart extends StatefulWidget {
  final List<double> data;
  final List<String> xAxis;

const BarChart({
    @required this.data,
    @required this.xAxis,
  });

@override
  _BarChartState createState() => _BarChartState();
}

class _BarChartState extends State<BarChart> with TickerProviderStateMixin {
  @override
  Widget build(BuildContext context) {
    return Column(
      mainAxisAlignment: MainAxisAlignment.center,
      children: [
        CustomPaint(
          painter: BarChartPainter(
            datas: widget.data,
            xAxis: widget.xAxis,
          ),
          child: Container(width: 300, height: 300),
        ),
      ],
    );
  }
}
然后创建一个用来绘制的自定义画笔 BarChartPainter。
1
2
3
4
5
6
7
8
9
10
11
12
13
14
15
16
17
18
19
20
class BarChartPainter extends CustomPainter {
  final List<double> datas;
  final List<String> xAxis;

BarChartPainter({
    @required this.xAxis,
    @required this.datas,
  });

@override
  void paint(Canvas canvas, Size size) {
    // TODO
  }

@override
  bool shouldRepaint(BarChartPainter oldDelegate) => true;

@override
  bool shouldRebuildSemantics(BarChartPainter oldDelegate) => false;
}
绘制坐标轴
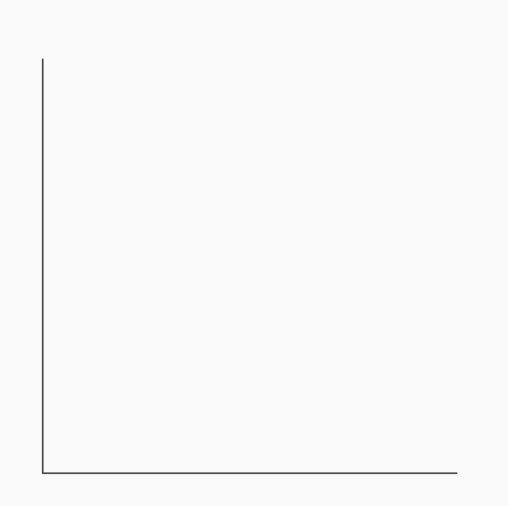
在 BarChartPainter 上定义一个 _drawAxis 方法用于绘制横坐标轴,使用一个由左上,左下,右下三个点控制的 Path 路径绘制。
1
2
3
4
5
6
7
8
9
10
11
12
13
14
15
16
17
18
19
20
21
22
23
24
void _drawAxis(Canvas canvas, Size size) {
  final double sw = size.width;
  final double sh = size.height;

// 使用 Paint 定义路径的样式
  final Paint paint = Paint()
    ..color = Colors.black87
    ..style = PaintingStyle.stroke
    ..strokeWidth = 1.0;

// 使用 Path 定义绘制的路径,从画布的左上角到左下角在到右下角
  final Path path = Path()
    ..moveTo(0, 0)
    ..lineTo(0, sh)
    ..lineTo(sw, sh);

// 使用 drawPath 方法绘制路径
  canvas.drawPath(path, paint);
}

@override
void paint(Canvas canvas, Size size) {
  _drawAxis(canvas, size);
}
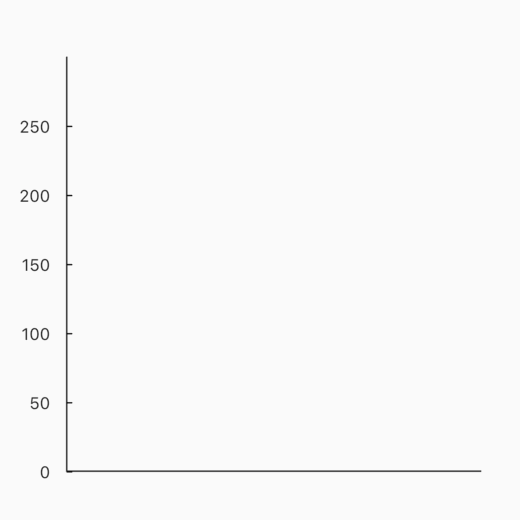
在 BarChartPainter 上定义一个 _drawLabels 方法绘制纵轴标识。
1
2
3
4
5
6
7
8
9
10
11
12
13
14
15
16
17
18
19
20
21
22
23
24
25
26
27
28
29
30
31
32
33
34
35
36
37
38
39
40
41
42
43
44
45
46
47
48
void _drawLabels(Canvas canvas, Size size) {
  final double gap = 50.0;
  final double sh = size.height;
  final List<double> yAxisLabels = [];

Paint paint = Paint()
    ..color = Colors.black87
    ..strokeWidth = 2.0;

// 使用 50.0 为间隔绘制比传入数据多一个的标识
  for (int i = 0; i <= datas.length; i++) {
    yAxisLabels.add(gap * i);
  }

yAxisLabels.asMap().forEach(
    (index, label) {
      // 标识的高度为画布高度减去标识的值
      final double top = sh - label;
      final rect = Rect.fromLTWH(0, top, 4, 1);
      final Offset textOffset = Offset(
        0 - labelFontSize * 3,
        top - labelFontSize / 2,
      );

// 绘制 Y 轴右边的线条
      canvas.drawRect(rect, paint);

// 绘制文字需要用 `TextPainter`,最后调用 paint 方法绘制文字
      TextPainter(
        text: TextSpan(
          text: label.toStringAsFixed(0),
          style: TextStyle(fontSize: labelFontSize, color: Colors.black87),
        ),
        textAlign: TextAlign.right,
        textDirection: TextDirection.ltr,
        textWidthBasis: TextWidthBasis.longestLine,
      )
        ..layout(minWidth: 0, maxWidth: 24)
        ..paint(canvas, textOffset);
    },
  );
}

@override
void paint(Canvas canvas, Size size) {
  _drawAxis(canvas, size);
  _drawLabels(canvas, size);
}
绘制数据矩形
然后定义一个 _darwBars 方法将具体矩形和横轴标识绘制出来。
1
2
3
4
5
6
7
8
9
10
11
12
13
14
15
16
17
18
19
20
21
22
23
24
25
26
27
28
29
30
31
32
33
34
35
36
37
38
39
40
41
42
43
44
45
46
47
48
49
50
51
52
53
54
55
56
57
58
59
60
61
62
63
64
65
66
67
68
69
70
71
72
73
74
75
76
77
List<Color> colors = [
  Color(0xff8e43e7),
  Color(0xffff4f81),
  Color(0xff1cc7d0),
  Color(0xff00aeff),
  Color(0xff3369e7),
  Color(0xffb84592),
  Color(0xff2dde98),
  Color(0xffff6c5f),
  Color(0xff003666),
  Color(0xffffc168),
  Color(0xff050f2c),
];

void _darwBars(Canvas canvas, Size size) {
  final sh = size.height;
  final paint = Paint()..style = PaintingStyle.fill;

for (int i = 0; i < datas.length; i++) {
    // 每个矩形使用预设的 colors 数组里面的颜色
    paint.color = colors[i];
    final double textFontSize = 14.0;
    final double data = datas[i];
    // 矩形的上边缘为画布高度减去数据值
    final double top = sh - data;
    // 矩形的左边缘为当前索引值乘以矩形宽度加上矩形之间的间距
    final double left = i * _barWidth + (i * _barGap) + _barGap;

// 使用 Rect.fromLTWH 方法创建要绘制的矩形
    final rect = Rect.fromLTWH(left, top, _barWidth, data);
    // 使用 drawRect 方法绘制矩形
    canvas.drawRect(rect, paint);

final offset = Offset(
      left + _barWidth / 2 - textFontSize * 1.2,
      top - textFontSize * 2,
    );
    // 使用 TextPainter 绘制矩形上放的数值
    TextPainter(
      text: TextSpan(
        text: data.toStringAsFixed(1),
        style: TextStyle(fontSize: textFontSize, color: paint.color),
      ),
      textAlign: TextAlign.center,
      textDirection: TextDirection.ltr,
    )
      ..layout(
        minWidth: 0,
        maxWidth: textFontSize * data.toString().length,
      )
      ..paint(canvas, offset);

final xData = xAxis[i];
    final xOffset = Offset(left + _barWidth / 2 - textFontSize, sh + 12);
    // 绘制横轴标识
    TextPainter(
      textAlign: TextAlign.center,
      text: TextSpan(
        text: '$xData',
        style: TextStyle(fontSize: 12, color: Colors.black87),
      ),
      textDirection: TextDirection.ltr,
    )
      ..layout(
        minWidth: 0,
        maxWidth: size.width,
      )
      ..paint(canvas, xOffset);
  }
}

@override
void paint(Canvas canvas, Size size) {
  _drawAxis(canvas, size);
  _drawLabels(canvas, size);
  _darwBars(canvas, size);
}
添加运动动画
最后在 _BarChartState 里使用一个 AnimationController 创建柱状图运动的动画,关于动画方面的知识可以查阅 从零开始的 Flutter 动画 这篇文章。
1
2
3
4
5
6
7
8
9
10
11
12
13
14
15
16
17
18
19
20
21
22
23
24
25
26
27
28
29
30
31
32
33
34
35
36
37
38
39
40
41
42
43
44
45
46
47
48
49
50
51
52
53
54
55
56
class _BarChartState extends State<BarChart> with TickerProviderStateMixin {
  AnimationController _controller;
  final _animations = <double>[];

@override
  void initState() {
    super.initState();
    double begin = 0.0;
    List<double> datas = widget.data;
    // 初始化动画控制器,并调用 forward 方法启动动画
    _controller = AnimationController(
      vsync: this,
      duration: Duration(milliseconds: 3000),
    )..forward();

for (int i = 0; i < datas.length; i++) {
      final double end = datas[i];
      // 使用一个补间值 Tween 创建每个矩形的动画值
      final Tween<double> tween = Tween(begin: begin, end: end);
      // 初始化数组里面的值
      _animations.add(begin);

// 创建补间动画
      Animation<double> animation = tween.animate(
        CurvedAnimation(
          parent: _controller,
          curve: Curves.ease,
        ),
      );
      _controller.addListener(() {
        // 使用 setState 更新 _animations 数组里面的动画值
        setState(() {
          _animations[i] = animation.value;
        });
      });
    }
  }

@override
  Widget build(BuildContext context) {
    return Column(
      mainAxisAlignment: MainAxisAlignment.center,
      children: [
        CustomPaint(
          // 最后向 BarChartPainter 传入 _animations 数组,实现动画
          painter: BarChartPainter(
            datas: _animations,
            xAxis: widget.xAxis,
            animation: _controller,
          ),
          child: Container(width: 300, height: 300),
        ),
      ],
    );
  }
}
至此整个柱状图的绘制就完成了,传入数据即可使用 🎉🎉🎉
1
2
3
4
BarChart(
  data: [180.0, 98.0, 126.0, 64.0, 118.0],
  xAxis: ['一月', '二月', '三月', '四月', '五月'],
);
完整代码地址:bar_chart.dart
本文说明了什么是 CustomPaint 和 CustomPainter。以及如何使用它们绘制一个带有动画的柱状图表。
准备写一系列关于用 Flutter 画图表的文章,用来分享这方面的知识,这篇文章是这个系列的开篇,预计一共会写 6 篇。
- Flutter 绘制图表(一)柱状图📊(本文)
- Flutter 绘制图表(二)饼状图🍪
- Flutter 绘制图表(三)折线图📈
- Flutter 绘制图表(四)雷达图🎯
- Flutter 绘制图表(五)环状图🍩
- Flutter 绘制图表(六)条形图📏
Recommend
About Joyk
Aggregate valuable and interesting links.
Joyk means Joy of geeK