

五分钟体验springboot集成普罗米修斯
source link: https://www.fangzhipeng.com/architecture/2020/07/20/sb-prometheus.html
Go to the source link to view the article. You can view the picture content, updated content and better typesetting reading experience. If the link is broken, please click the button below to view the snapshot at that time.
五分钟体验springboot集成普罗米修斯
2020/07/20Prometheus 是一套开源的系统监控报警框架。它由工作在 SoundCloud 的 员工创建,并在 2015 年正式发布的开源项目。2016 年,Prometheus 正式加入 Cloud Native Computing Foundation,非常的受欢迎。
Prometheus 具有以下特点:
- 一个多维数据模型,其中包含通过度量标准名称和键/值对标识的时间序列数据
- PromQL,一种灵活的查询语言,可利用此维度
- 不依赖分布式存储; 单服务器节点是自治的
- 时间序列收集通过HTTP上的拉模型进行
- 通过中间网关支持推送时间序列
- 通过服务发现或静态配置发现目标
- 多种图形和仪表板支持模式
Prometheus 组成及架构
声明:该小节参考了文章[Prometheus 入门与实践]
Prometheus 生态圈中包含了多个组件,其中许多组件是可选的:
- Prometheus Server: 用于收集和存储时间序列数据。
- Client Library: 客户端库,为需要监控的服务生成相应的 metrics 并暴露给 Prometheus server。当 Prometheus server 来 pull 时,直接返回实时状态的 metrics。
- Push Gateway: 主要用于短期的 jobs。由于这类 jobs 存在时间较短,可能在 Prometheus 来 pull 之前就消失了。为此,这次 jobs 可以直接向 Prometheus server 端推送它们的 metrics。这种方式主要用于服务层面的 metrics,对于机器层面的 metrices,需要使用 node exporter。
- Exporters: 用于暴露已有的第三方服务的 metrics 给 Prometheus。
- Alertmanager: 从 Prometheus server 端接收到 alerts 后,会进行去除重复数据,分组,并路由到对收的接受方式,发出报警。常见的接收方式有:电子邮件,pagerduty,OpsGenie, webhook 等。
- 一些其他的工具。
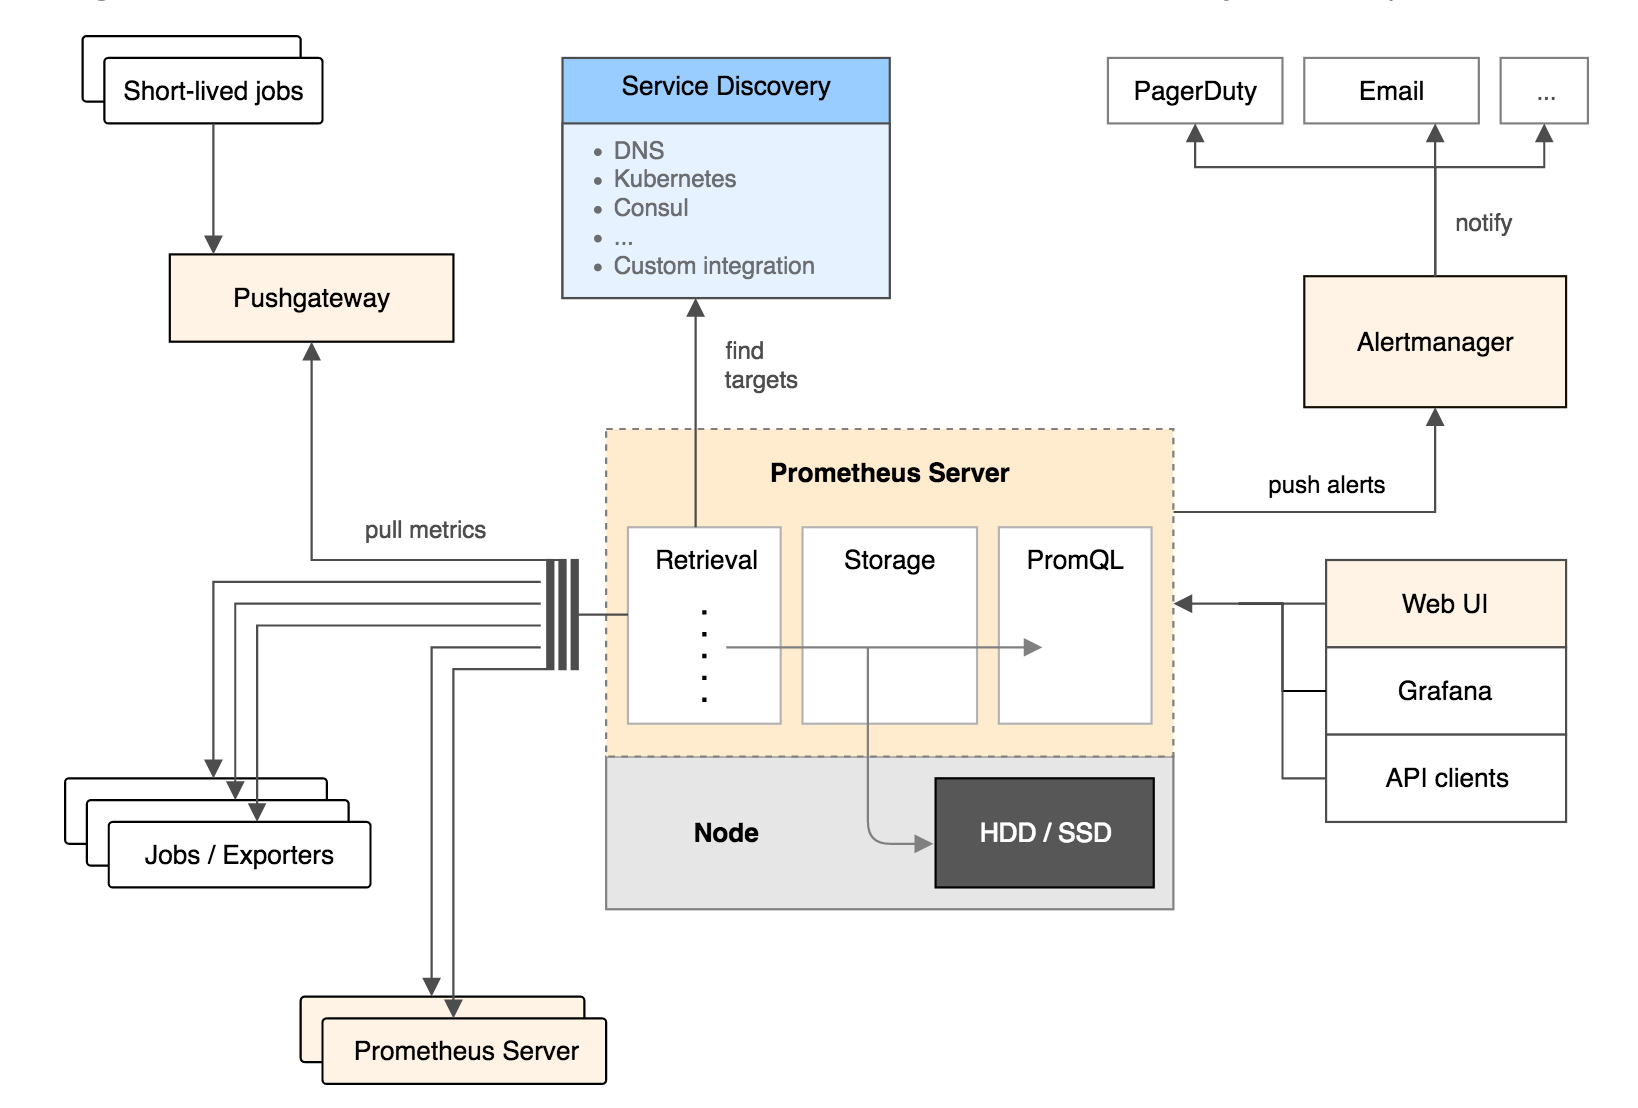
其大概的工作流程是:
- Prometheus server 定期从配置好的 jobs 或者 exporters 中拉 metrics,或者接收来自 Pushgateway 发过来的 metrics,或者从其他的 Prometheus server 中拉 metrics。
- Prometheus server 在本地存储收集到的 metrics,并运行已定义好的 alert.rules,记录新的时间序列或者向 Alertmanager 推送警报。
- Alertmanager 根据配置文件,对接收到的警报进行处理,发出告警。
- 在图形界面中,可视化采集数据。
springboot 集成prometheus
在spring boot工程中引入actuator的起步依赖,以及micrometer-registry-prometheus的依赖。
<dependency>
	 <groupId>org.springframework.boot</groupId>
	 <artifactId>spring-boot-starter-web</artifactId>
</dependency>
<dependency>
		<groupId>org.springframework.boot</groupId>
		<artifactId>spring-boot-starter-actuator</artifactId>
</dependency>
<dependency>
		<groupId>io.micrometer</groupId>
		<artifactId>micrometer-registry-prometheus</artifactId>
</dependency>
暴露prometheus的接口;暴露metrics.tags,和spring.application.name一致。
server:
  port: 8081
spring:
  application:
    name: my-prometheus
management:
  endpoints:
    web:
      exposure:
        include: 'prometheus'
  metrics:
    tags:
      application: ${spring.application.name}
写一个API接口,用作测试。代码如下:
@RestController
public class TestController {
    Logger logger = LoggerFactory.getLogger(TestController.class);

    @GetMapping("/test")
    public String test() {
        logger.info("test");
        return "ok";
    }

    @GetMapping("")
    public String home() {
        logger.info("home");
        return "ok";
    }
}
在浏览器上访问http://localhost:8081/actuator/prometheus,展示的信息如下,这些信息都是actuator的一些监控信息。
# HELP jvm_gc_max_data_size_bytes Max size of old generation memory pool
# TYPE jvm_gc_max_data_size_bytes gauge
jvm_gc_max_data_size_bytes{application="my-prometheus",} 2.863661056E9
# HELP http_server_requests_seconds
# TYPE http_server_requests_seconds summary
http_server_requests_seconds_count{application="my-prometheus",exception="None",method="GET",outcome="CLIENT_ERROR",status="404",uri="/**",} 1.0
http_server_requests_seconds_sum{application="my-prometheus",exception="None",method="GET",outcome="CLIENT_ERROR",status="404",uri="/**",} 0.018082327
# HELP http_server_requests_seconds_max
# TYPE http_server_requests_seconds_max gauge
http_server_requests_seconds_max{application="my-prometheus",exception="None",method="GET",outcome="CLIENT_ERROR",status="404",uri="/**",} 0.018082327
# HELP jvm_threads_states_threads The current number of threads having NEW state
# TYPE jvm_threads_states_threads gauge
jvm_threads_states_threads{application="my-prometheus",state="waiting",} 12.0
jvm_threads_states_threads{application="my-prometheus",state="runnable",} 8.0
jvm_threads_states_threads{application="my-prometheus",state="timed-waiting",} 2.0
jvm_threads_states_threads{application="my-prometheus",state="terminated",} 0.0
jvm_threads_states_threads{application="my-prometheus",state="blocked",} 0.0
jvm_threads_states_threads{application="my-prometheus",state="new",} 0.0
# HELP process_files_open_files The open file descriptor count
# TYPE process_files_open_files gauge
...省略更多
安装Prometheus
安装Prometheus很简单,在linux系统上安装,执行以下的安装命令。其他的操作系统,比如windows、mac等在官网上(https://prometheus.io/download/)下载并安装。
wget https://github.com/prometheus/prometheus/releases/download/v2.19.2/prometheus-2.19.2.darwin-amd64.tar.gz
tar xvfz prometheus-*.tar.gz
cd prometheus-*
修改Prometheus的配置文件prometheus.yml,代码如下:
global:
  scrape_interval:     15s # By default, scrape targets every 15 seconds.

  # Attach these labels to any time series or alerts when communicating with
  # external systems (federation, remote storage, Alertmanager).
  external_labels:
    monitor: 'codelab-monitor'

# A scrape configuration containing exactly one endpoint to scrape:
# Here it's Prometheus itself.
scrape_configs:
  # The job name is added as a label `job=<job_name>` to any timeseries scraped from this config.
  - job_name: 'prometheus'

    # Override the global default and scrape targets from this job every 5 seconds.
    scrape_interval: 5s

    static_configs:
      - targets: ['localhost:9090']
  - job_name: 'springboot_prometheus'
    scrape_interval: 5s
    metrics_path: '/actuator/prometheus'
    static_configs:
      - targets: ['127.0.0.1:8081']
- config.job_name,配置job的名称
- config.scrape_interval,配置多久抓一次监控信息
- config.metrics_path,获取监控信息的接口
- config.static_configs.targets配置获取监控信息的地址。
使用以下的命令启动prometheus,并通过–config.file指定配置文件
./prometheus --config.file=prometheus.yml
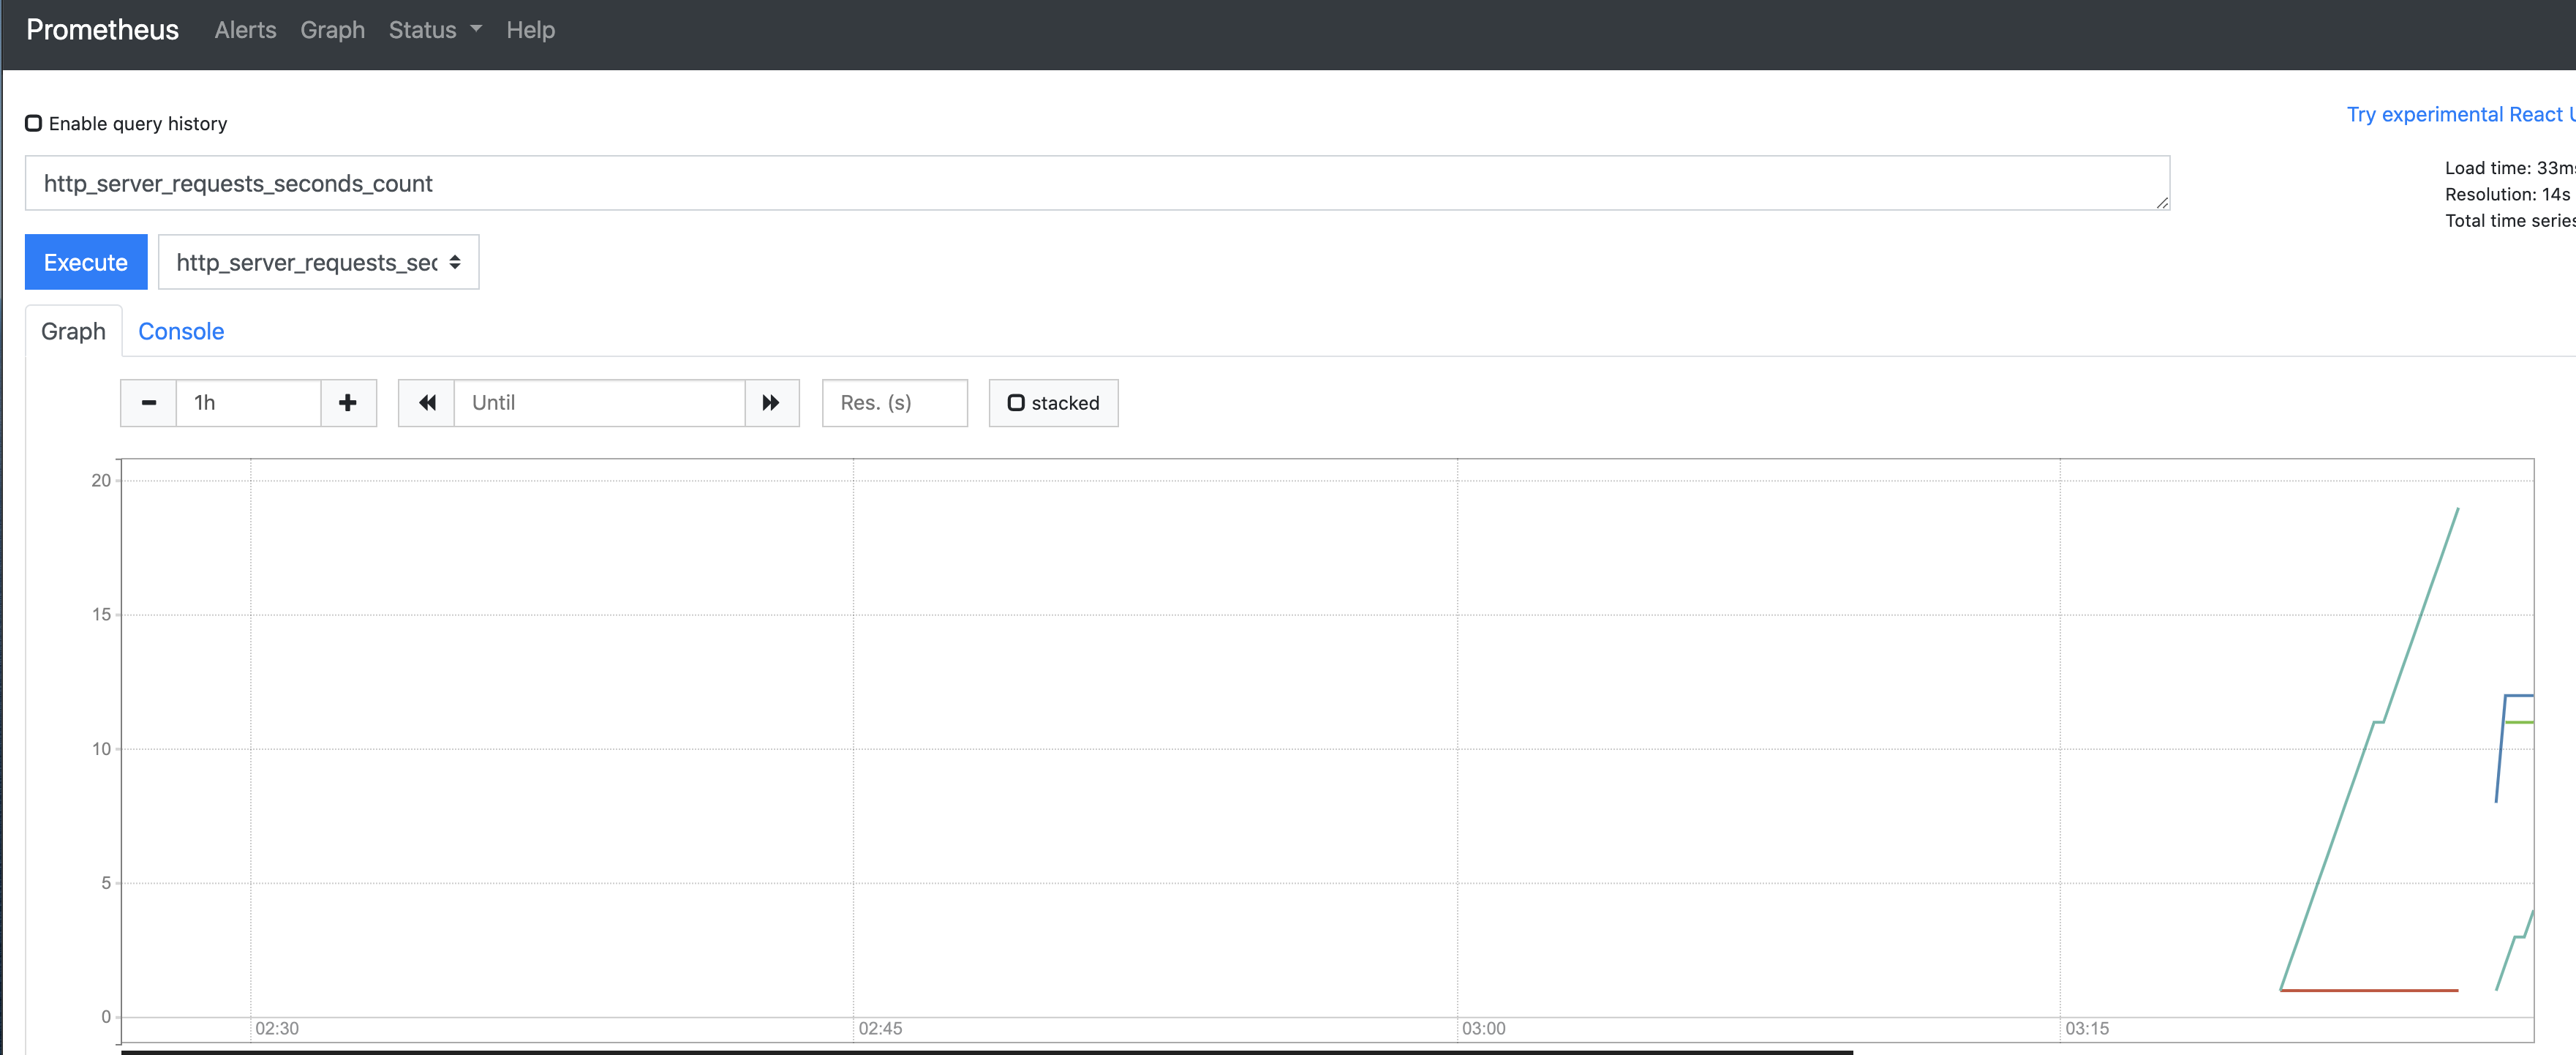
多次请求springboot项目的接口http://localhost:8081/test , 并访问prometheus的控制台http://localhost:9090/,展示的界面如下:
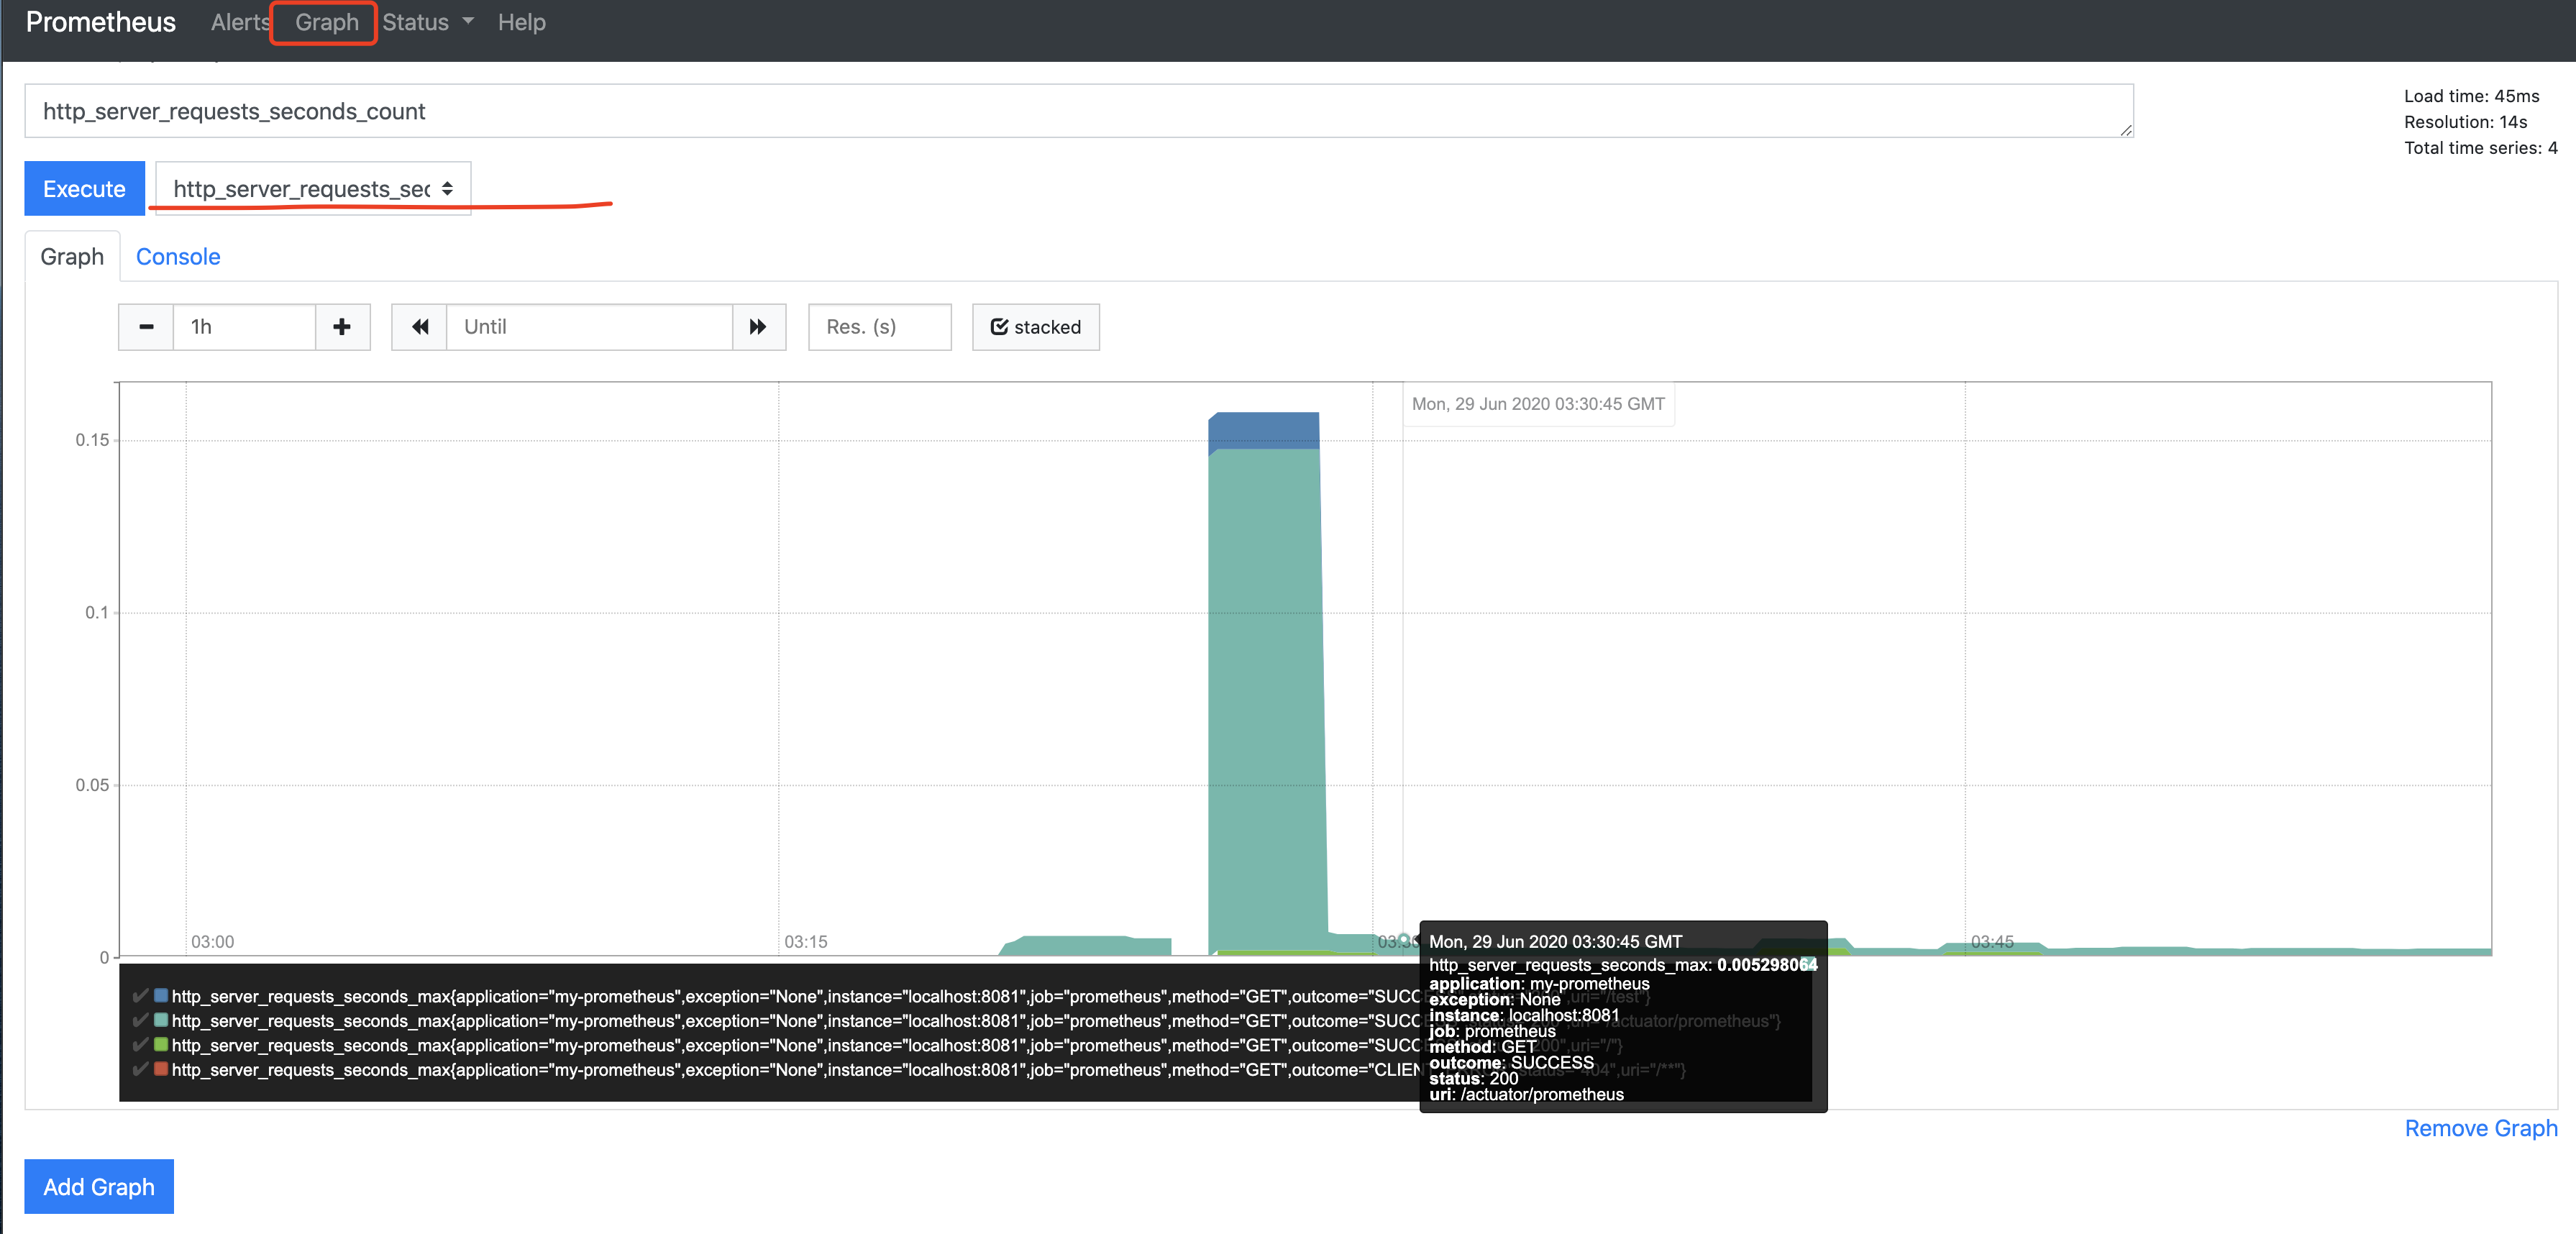
prometheus提供了一些可视化图,比如使用柱状图来展示每秒请求数:
安装grafana
grafana 是一款采用 go 语言编写的开源应用,主要用于大规模指标数据的可视化展现,是网络架构和应用分析中最流行的时序数据展示工具,目前已经支持绝大部分常用的时序数据库。使用grafana去展示prometheus上的数据。先安装,安装命令如下:
wget https://dl.grafana.com/oss/release/grafana-7.0.4.darwin-amd64.tar.gz
tar -zxvf grafana-7.0.4.darwin-amd64.tar.gz
./grafana-server
访问http://localhost:3000/,初始密码:admin/admin。
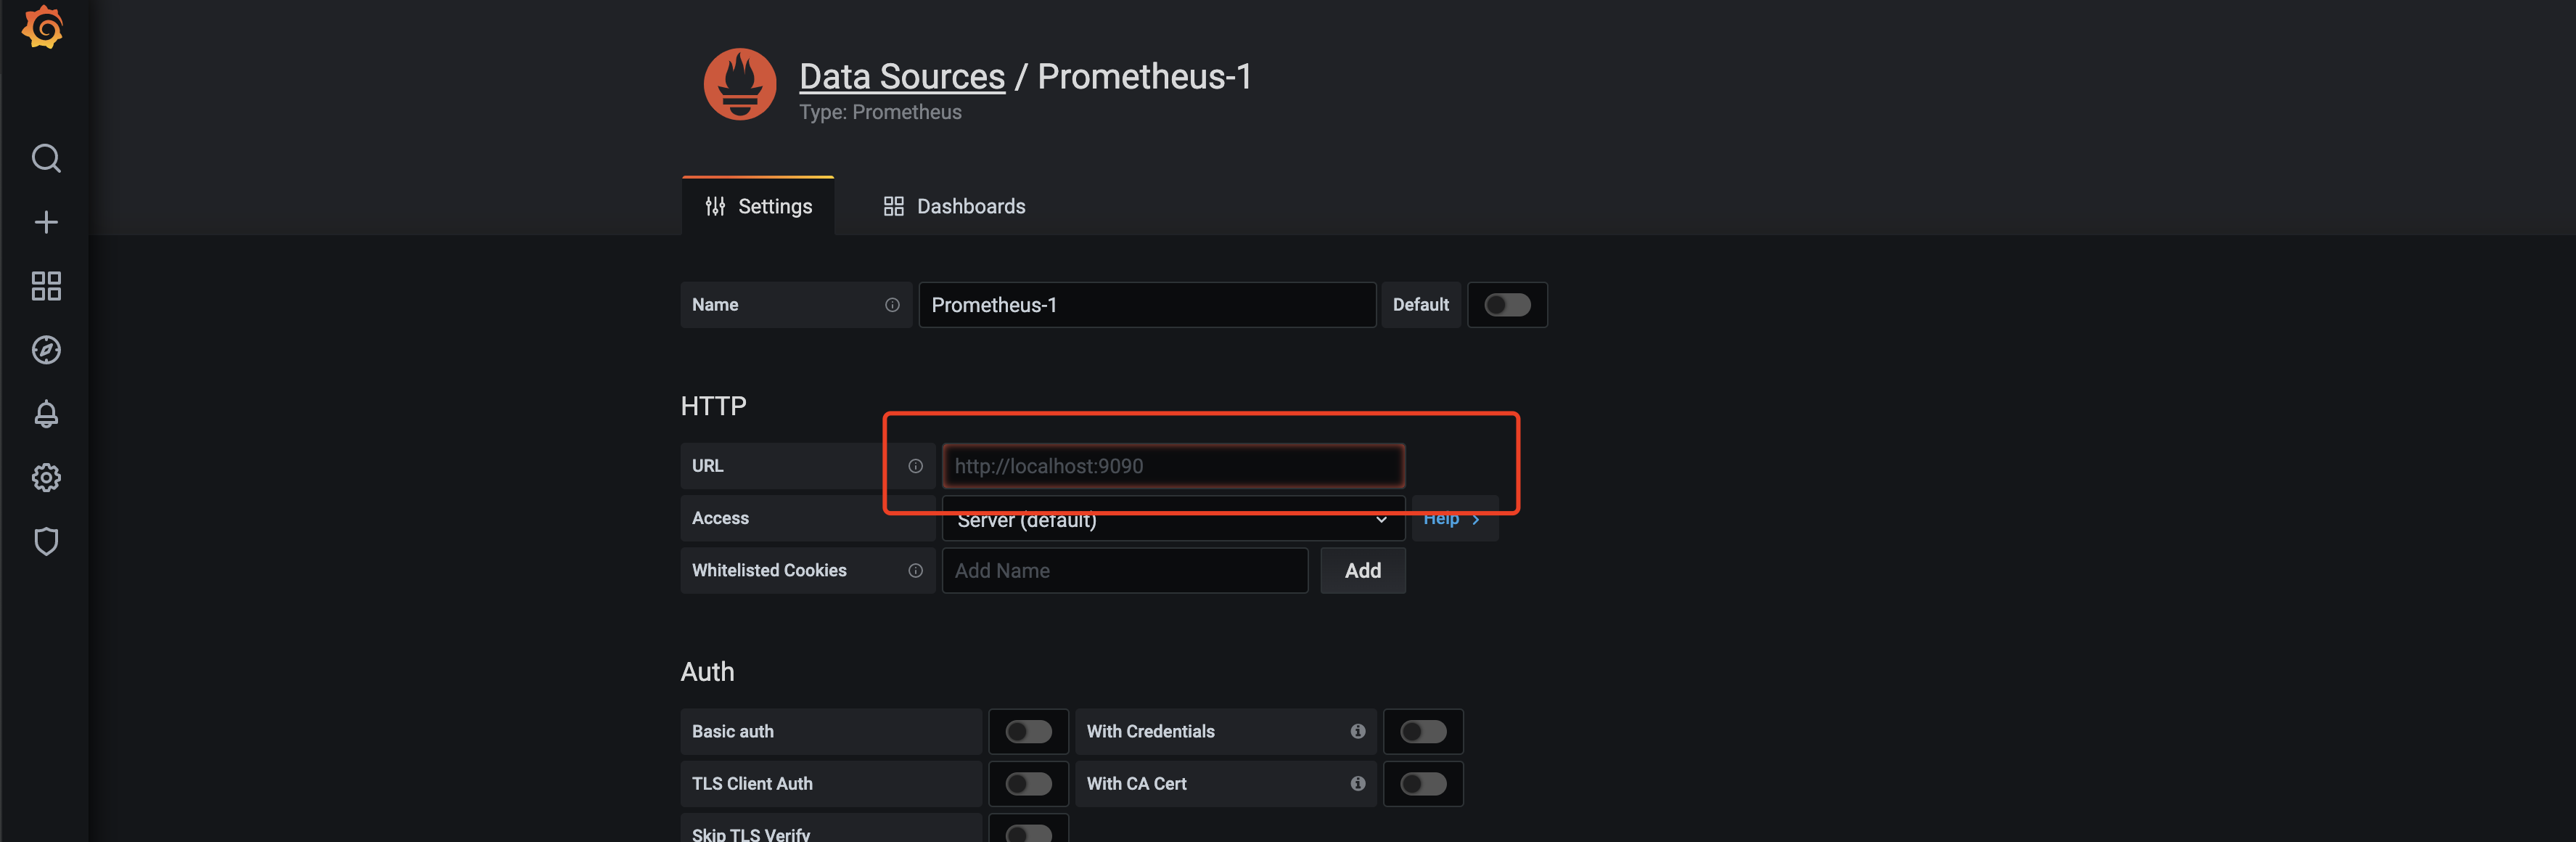
配置数据源,如图:
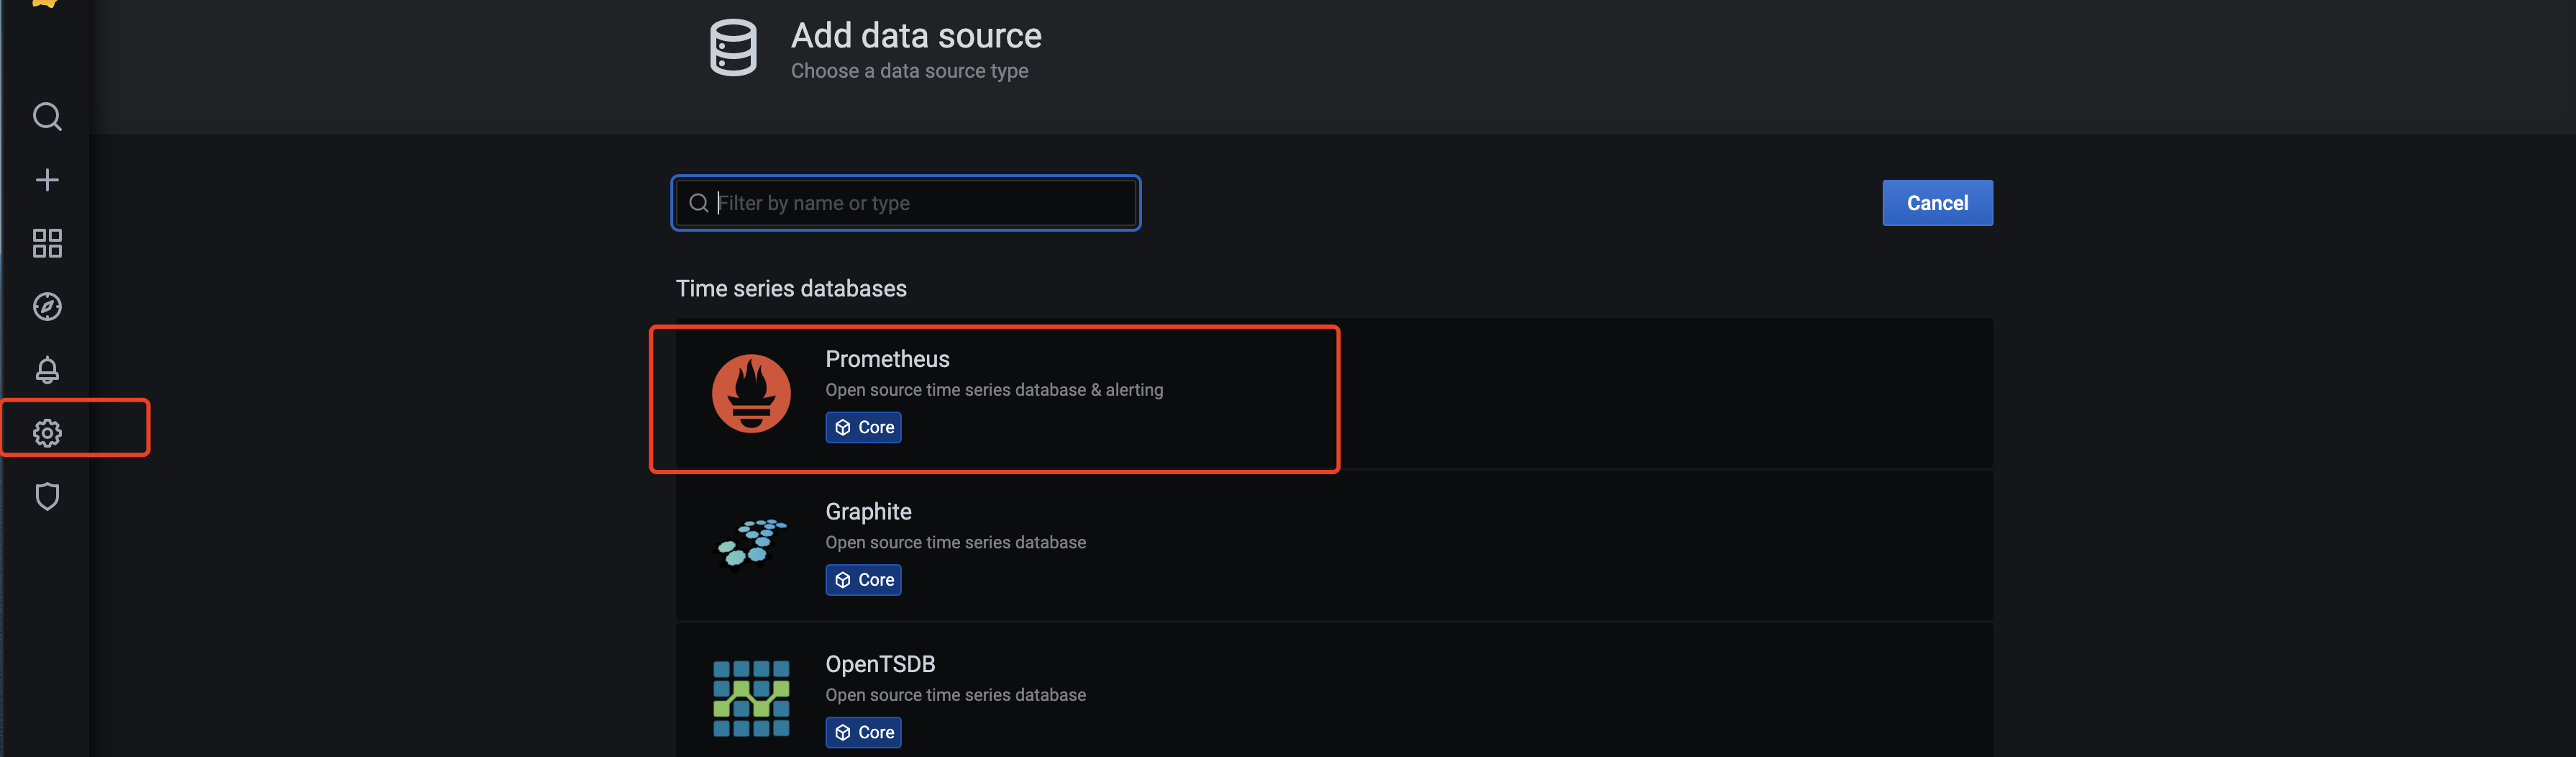
配置prometheus的地址:http://localhost:9090 ,如图所示:
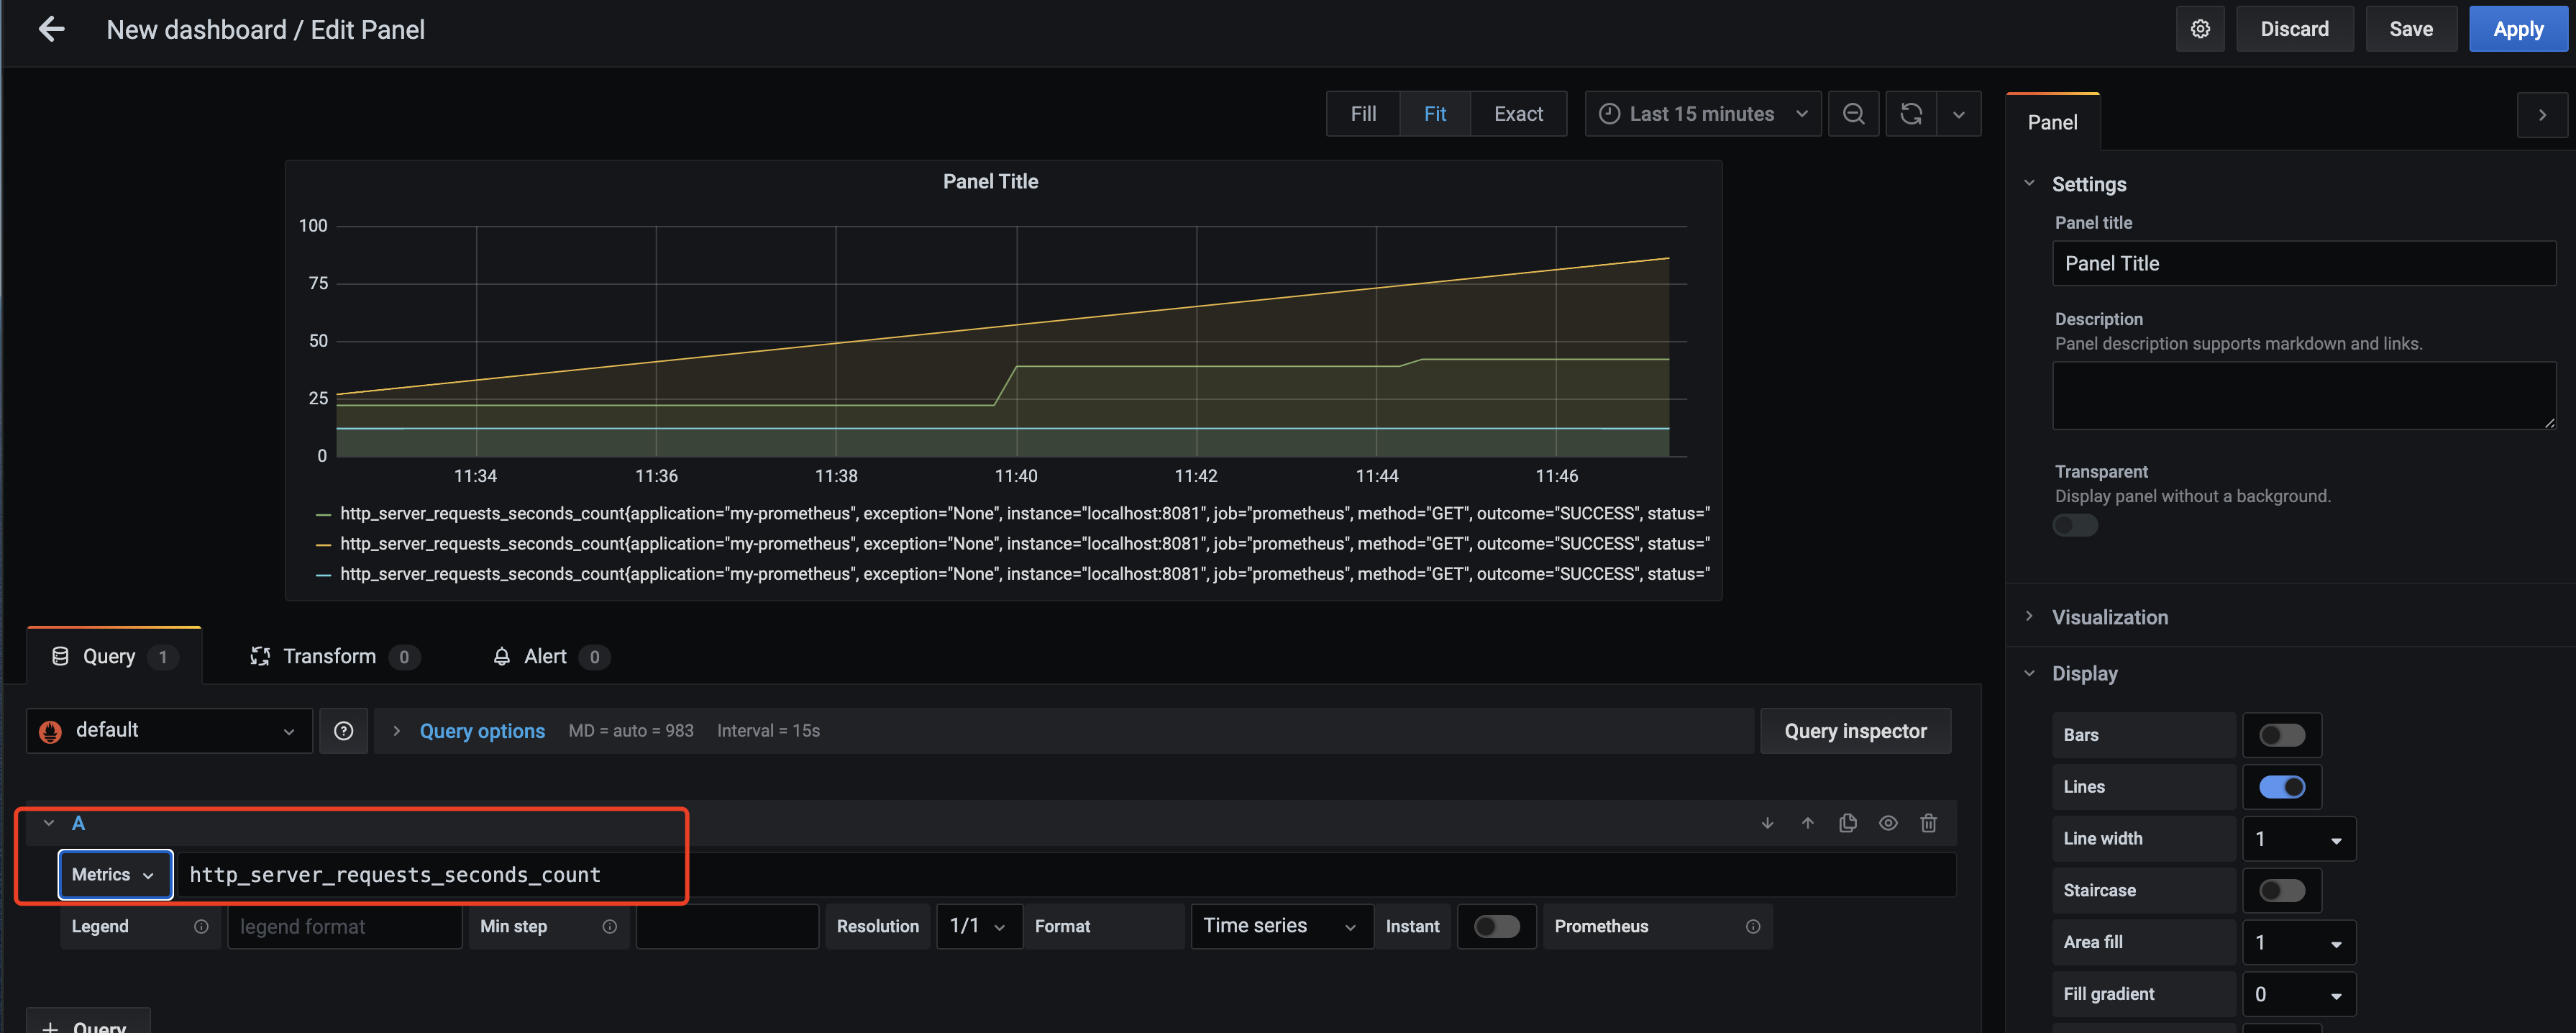
在dashboard界面新建panel,展示的metrics为http_server_request_seconds_count,即展示了以时间为横轴,请求数为纵轴的请求曲线,如图所示:
Recommend
About Joyk
Aggregate valuable and interesting links.
Joyk means Joy of geeK