

Java Application Performance Monitoring: End-to-end performance of complex distr...
source link: https://www.javacodegeeks.com/2017/09/java-application-performance-monitoring.html
Go to the source link to view the article. You can view the picture content, updated content and better typesetting reading experience. If the link is broken, please click the button below to view the snapshot at that time.
About AppDynamics
Java Application Performance Monitoring: End-to-end performance of complex distributed applications
Posted by: AppDynamics in Core Java September 18th, 2017 0 806 Views
Discover faster, more efficient performance monitoring with an enterprise APM product learning from your apps. Take the AppDynamics APM Guided Tour!
Monitor Java application performance — focused on business transactions — end-to-end in the most complex and distributed environments. Auto-discovered business transactions, dynamic baselining, code-level diagnostics, and Virtual War Room collaboration ensure rapid issue identification and resolution to maintain an ideal user experience for any Java application, running on-premises or in cloud. Get real-time visibility into how your applications perform inside many of the industry-leading Java application servers, including Weblogic, WebSphere, JBoss, Tomcat, Glassfish and more.
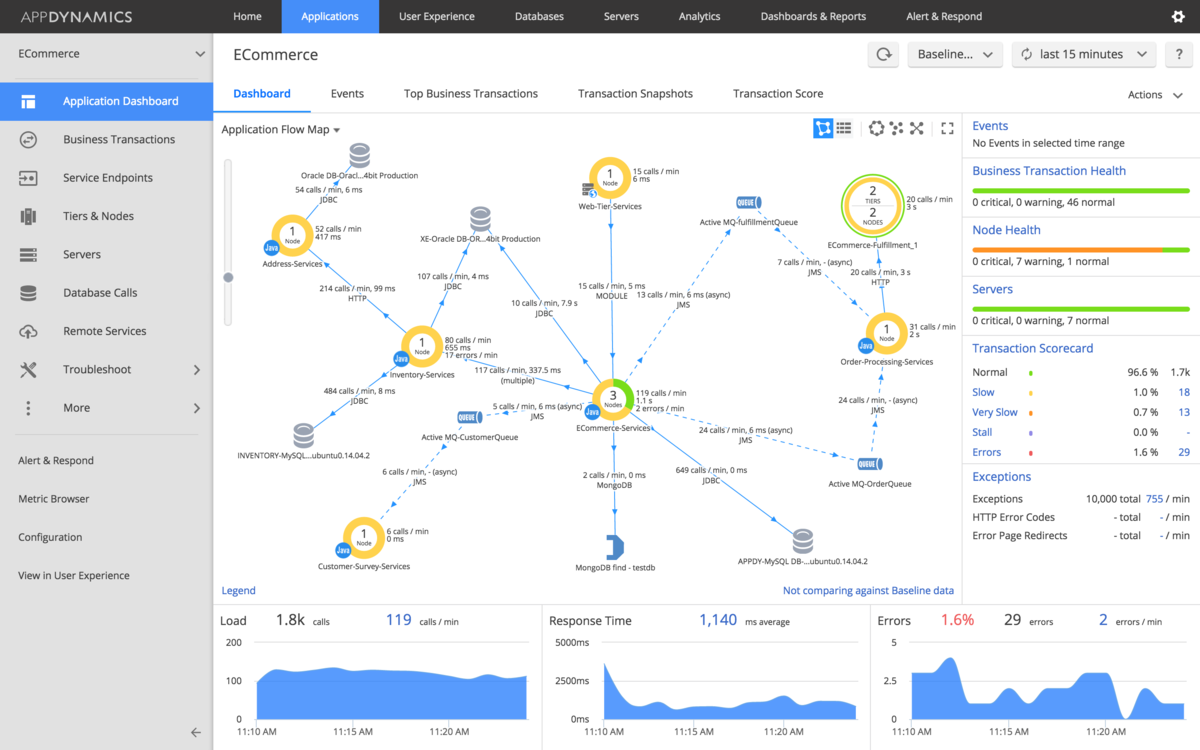
Automatically visualize and map Java application dependencies
- Automatically discover java application topology and JVM dependencies, and trace key business transactions based on production application behavior
- Visualize and prioritize the end to end business transactions performance and not just the health of the application and infrastructure nodes
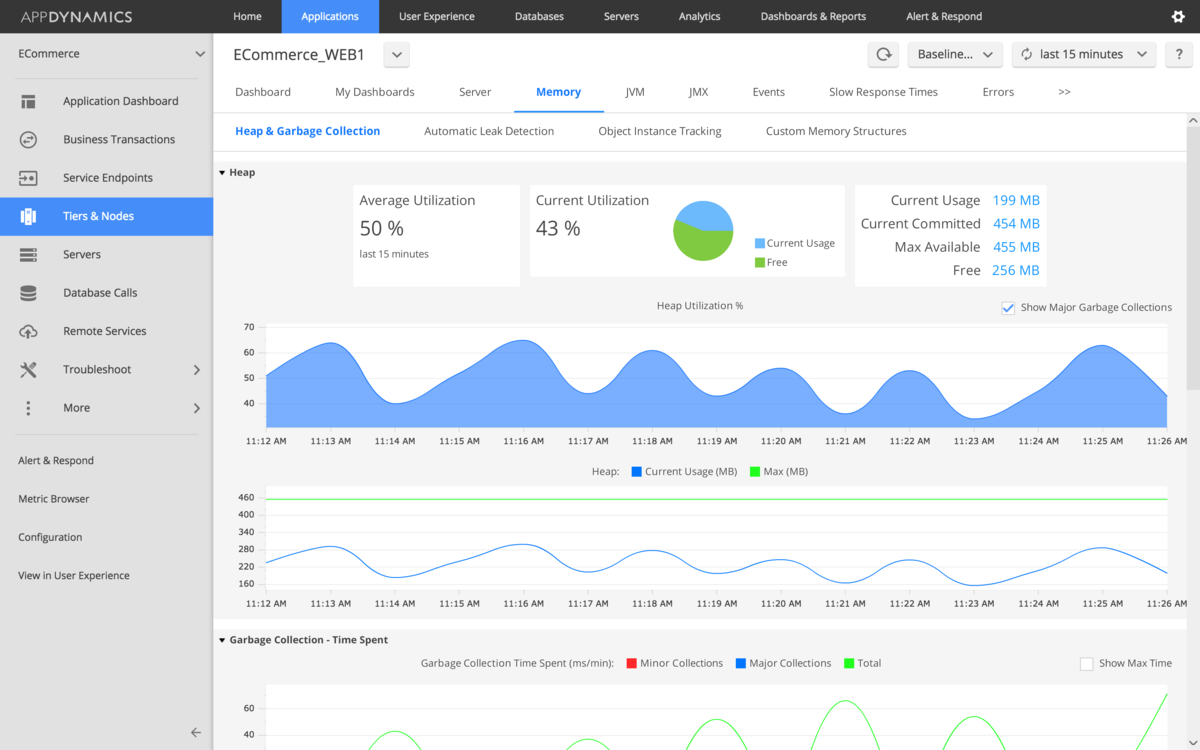
Monitor JVM health and performance
- Understand the health of your JVM with key Java tuning and profiling metrics, including: response times, throughput, exception rate, garbage collection time, code deadlocks, and more
- Correlate application metrics with key host server health metrics such as CPU, memory, and disk I/O – all within the same UI
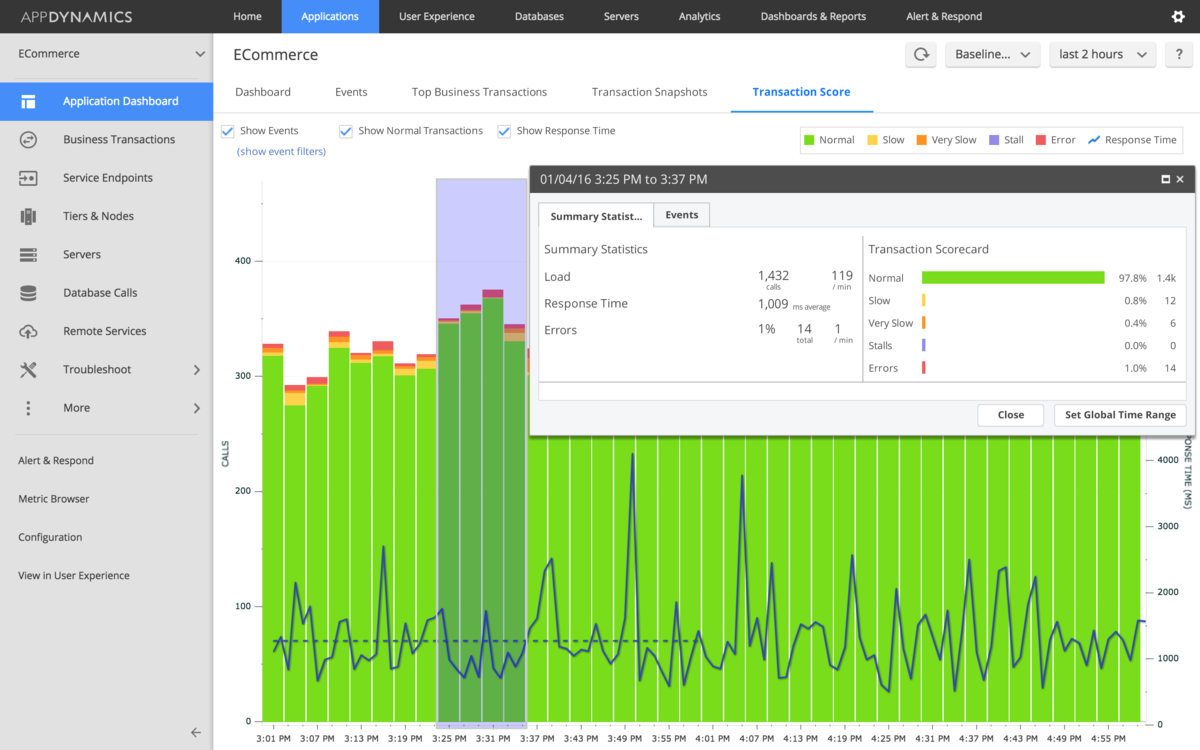
Automatically baseline performance to alert and address emerging issues in context of Business Transactions
- Know your performance in the context of auto-generated dynamic baselines
- Integrated with incidents and alerting systems ServiceNow, PagerDuty, and Jira
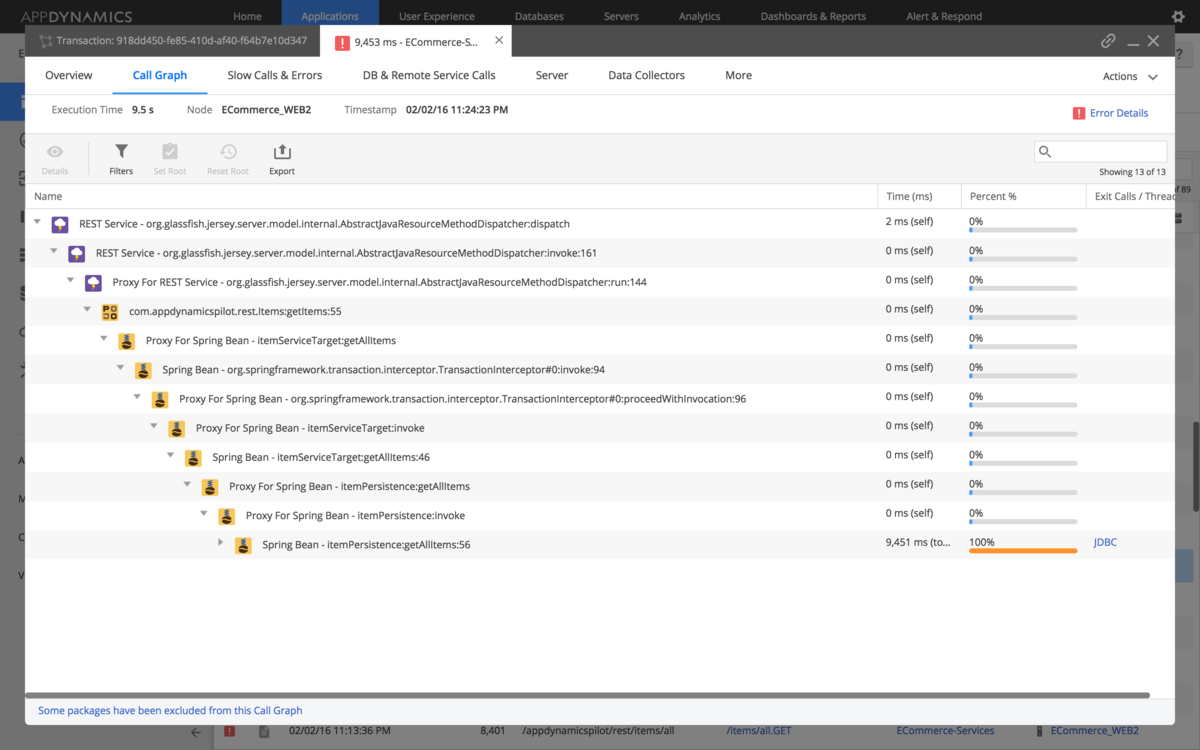
Quickly isolate and resolve production java application performance issues at code-level depth with minimal overhead
- Leverage Smart Code Instrumentation to enable in-depth monitoring of production apps without making configuration changes
- Monitor every transaction but intelligently capture details of only the anomalous transactions, making the platform scale to meet the demands of large enterprises
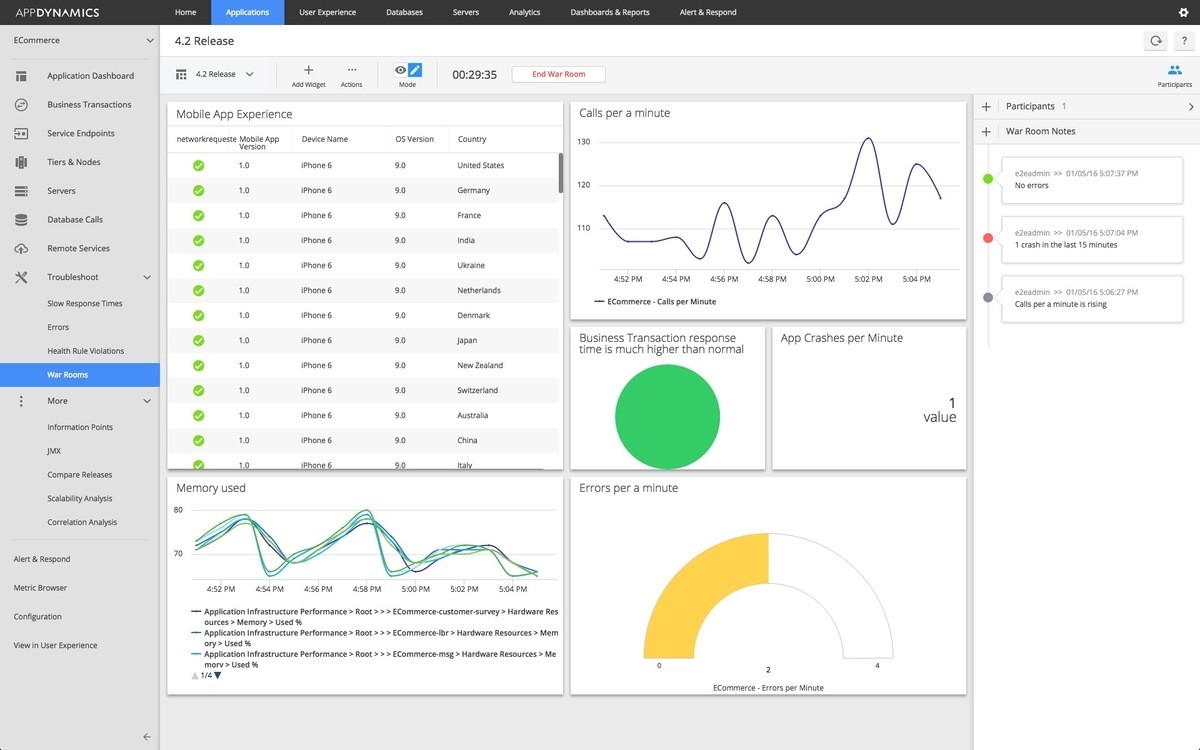
Enhance Dev & Ops collaboration with role-based views and Virtual War Room
- Leverage the DevOps Virtual War Room capability to enable everyone to collaborate and troubleshoot while sharing the same performance data
- Avoid tedious manual steps with Runbook Automation by automatically capturing snapshots and resolving performance issues as they are developing
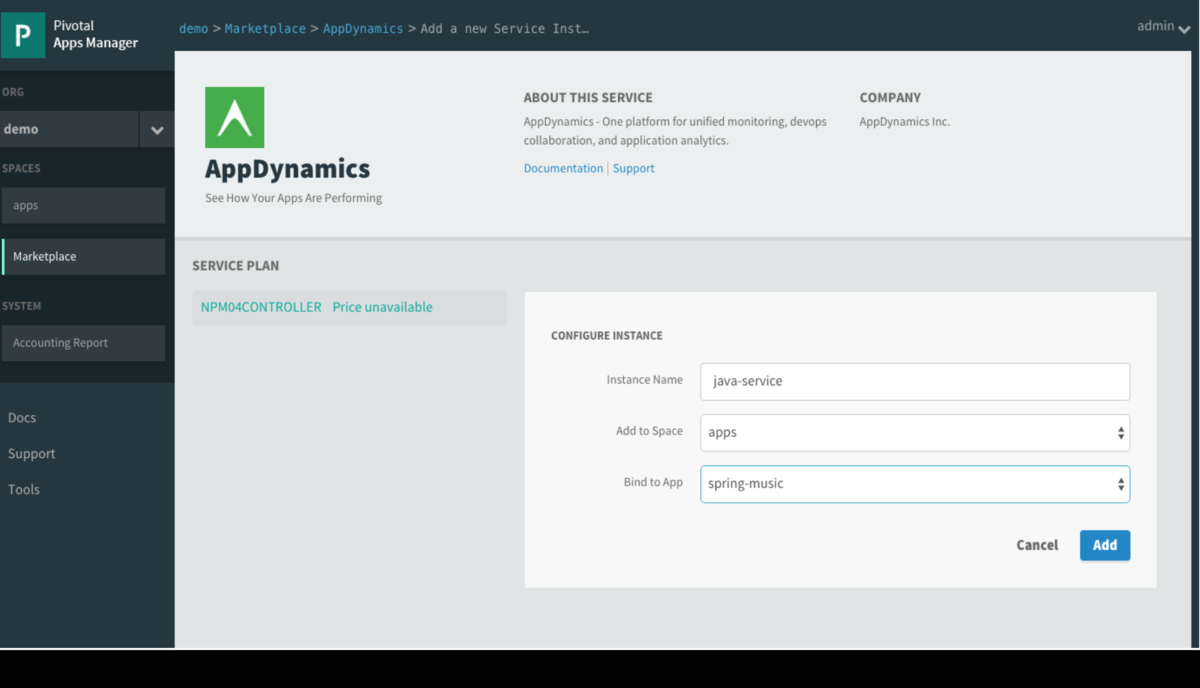
Maximize the visibility and control of cloud application with deep support for key IaaS/PaaS platforms
- Enhanced visibility into applications deployed in cloud and on-premises and monitor the business transactions across the distributed applications
- Quick time to value by Java monitoring applications developed and deployed in key IaaS/PaaS platforms, including, Amazon Web Services, Pivotal Cloud Foundry and Redhat OpenShift
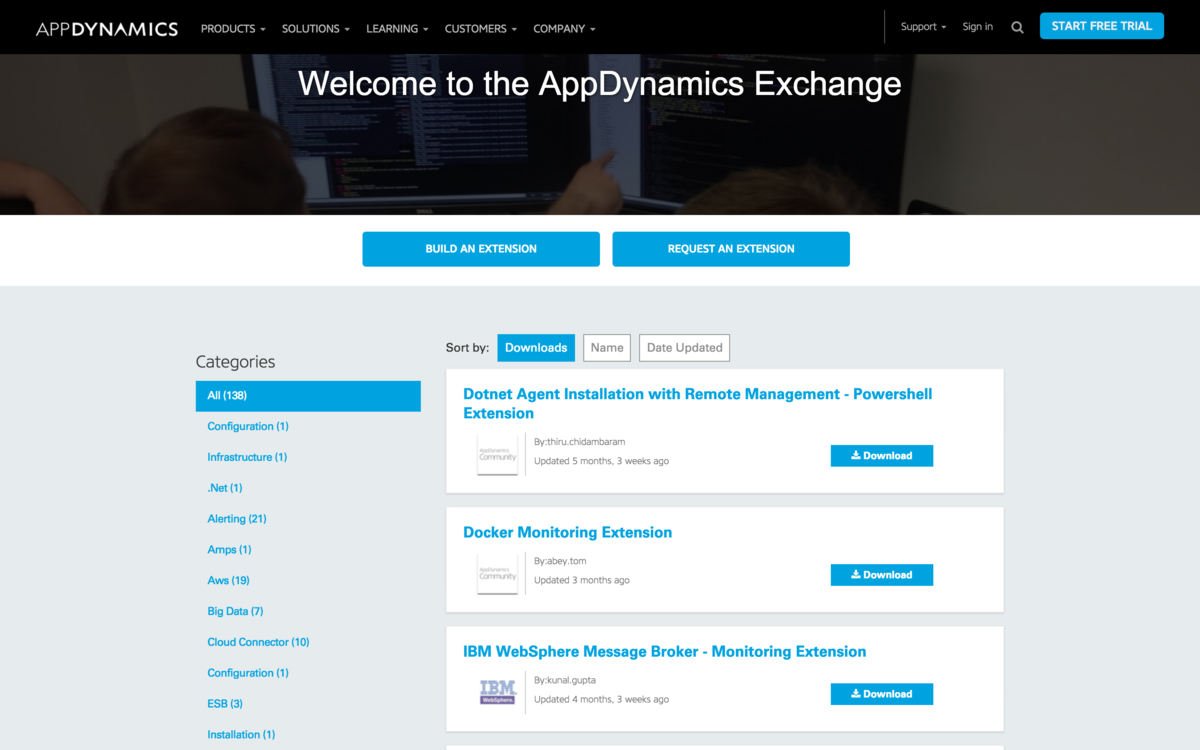
Leverage platform extensibility to support additional applications and infrastructure
- Monitor every element of your Java application infrastructure
- 130+ supported extensions for wide monitoring coverage
In addition to the key features described above, you can enjoy all the other benefits provided by the AppDynamics platform, including: self-learning platform, automated baseline of performance, intelligent alerting and health rules, ease of use, and more. Learn more about Application Performance Management.
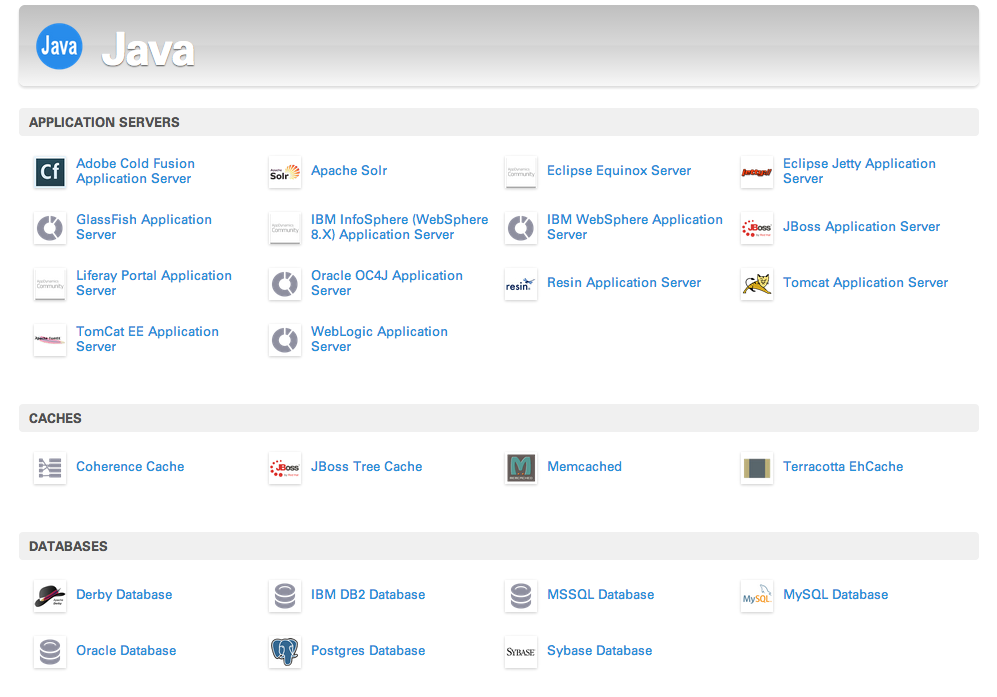
AppDynamics platform supports all common Java monitoring frameworks including:
Discover faster, more efficient performance monitoring with an enterprise APM product learning from your apps. Take the AppDynamics APM Guided Tour!
Recommend
About Joyk
Aggregate valuable and interesting links.
Joyk means Joy of geeK