

Core Graphics Tutorial: Gradients and Contexts [FREE]
source link: https://www.raywenderlich.com/10946920-core-graphics-tutorial-gradients-and-contexts
Go to the source link to view the article. You can view the picture content, updated content and better typesetting reading experience. If the link is broken, please click the button below to view the snapshot at that time.
Update note : Fabrizio Brancati updated this tutorial for iOS 13, Swift 5, and Xcode 11. Caroline Begbie wrote the original and Andrew Kharchyshyn made a previous update.
Welcome back to our modern Core Graphics tutorial series!
In Core Graphics Tutorial: Getting Started , you learned about drawing lines and arcs with Core Graphics and using Xcode’s interactive storyboard features.
In this second part, you’ll delve further into Core Graphics, learning about drawing gradients and manipulating CGContexts
with transformations.
Core Graphics
You’re now going to leave the comfortable world of UIKit and enter the underworld of Core Graphics.
This image from Apple describes the relevant frameworks conceptually:

UIKit is the top layer, and it’s also the most approachable. You’ve used UIBezierPath
, which is a UIKit wrapper of the Core Graphics CGPath
.
The Core Graphics framework is based on the Quartz advanced drawing engine. It provides low-level, lightweight 2D rendering. You can use this framework to handle path-based drawing, transformations, color management and much more.
One thing to know about lower layer Core Graphics objects and functions is that they always have the prefix CG
, so they are easy to recognize.
Getting Started
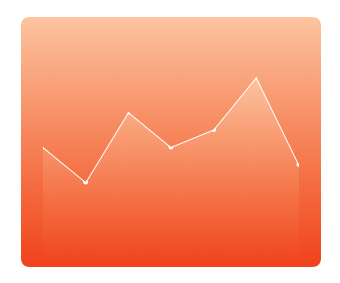
By the time you get to the end of this tutorial, you’ll have created a graph view that looks like this:

Before drawing on the graph view, you’ll set it up in the storyboard and create the code that animates the transition to show it.
The complete view hierarchy will look like this:

First, download the project materials by clicking the Download Materials
button at the top or bottom of this tutorial. When you open it, you’ll see that it’s pretty much where you left off in the previous tutorial. The only difference is that in Main.storyboard
, CounterView
is inside of another view with a yellow background. Build and run, and this is what you’ll see:

Creating the Graph
Go to File ▸ New ▸ File… , choose the iOS ▸ Source ▸ Cocoa Touch Class template and click Next . Enter the name GraphView as the class name, choose the subclass UIView and set the language to Swift . Click Next then Create .
Now in Main.storyboard
click the name of the yellow view in the Document Outline
and press Enter to rename it. Call it Container View
. Drag a new UIView
from the object library inside of Container View
, below the Counter View
.
Change the class of the new view to GraphView
in the Identity inspector
. The only thing left is to add constraints for the new GraphView
, similar to how you added constraints in the previous part of the tutorial:
- With the GraphView selected, Control-drag from the center slightly left, still within the view, and choose Width from the pop-up menu.
- With the GraphView still selected, Control-drag from the center slightly up, still within the view, and choose Height from the pop-up menu.
- Control-drag left from inside the view to outside the view and choose Center Horizontally in Container .
- Control-drag up from inside the view to outside the view, and choose Center Vertically in Container .
Edit the constraint constants in the Size inspector to match these:

Your Document Outline should look like this:

The reason you need a Container View is to make an animated transition between the Counter View and the Graph View.
Go to ViewController.swift and add property outlets for the Container and Graph views:
@IBOutlet weak var containerView: UIView!
@IBOutlet weak var graphView: GraphView!
This creates an outlet for the Container and Graph views. Now hook them up to the views you created in the storyboard.
Go back to Main.storyboard and hook up the Graph View and the Container View to their corresponding outlets:

Setting Up the Animated Transition
While still in Main.storyboard , drag a Tap Gesture Recognizer from the Object Library to the Container View in the Document Outline :

Next, go to ViewController.swift and add this property to the top of the class:
var isGraphViewShowing = false
This simply marks whether the Graph View is currently displayed.
Now add this tap method to do the transition:
@IBAction func counterViewTap(_ gesture: UITapGestureRecognizer?) {
  // Hide Graph
  if isGraphViewShowing {
    UIView.transition(
      from: graphView,
      to: counterView,
      duration: 1.0,
      options: [.transitionFlipFromLeft, .showHideTransitionViews],
      completion: nil
    )
  } else {
    // Show Graph
    UIView.transition(
      from: counterView,
      to: graphView,
      duration: 1.0,
      options: [.transitionFlipFromRight, .showHideTransitionViews],
      completion: nil
    )
  }
  isGraphViewShowing.toggle()
}
UIView.transition(from:to:duration:options:completion:)
performs a horizontal flip transition. Other available transitions are cross dissolve, vertical flip and curl up or down. The transition uses .showHideTransitionViews
so that you don’t have to remove the view to prevent it from being shown once it is “hidden” in the transition.
Add this code at the end of pushButtonPressed(_:)
:
if isGraphViewShowing {
  counterViewTap(nil)
}
If the user presses the plus button while the graph is showing, the display will swing back to show the counter.
Now, to get this transition working, go back to Main.storyboard
and hook up your tap gesture to the newly added counterViewTap(gesture:)
:
Build and run. Currently, you’ll see the Graph View when you start the app. Later on, you’ll set the Graph View hidden, so the counter view will appear first. Tap it and you’ll see the flip transition.

Analyzing the Graph View

Remember the Painter’s Model from Part 1? It explained that you draw an image from back to front in Core Graphics. So you need the order in mind before you code. For Flo’s graph, that would be:
- Gradient background view
- Clipped gradient under the graph
- Graph line
- Circles for the graph points
- Horizontal graph lines
- Graph labels
Drawing a Gradient
You’ll now draw a gradient in the Graph View.
Open GraphView.swift and replace the code with:
import UIKit

@IBDesignable
class GraphView: UIView {
  // 1
  @IBInspectable var startColor: UIColor = .red
  @IBInspectable var endColor: UIColor = .green

  override func draw(_ rect: CGRect) {
    // 2
    guard let context = UIGraphicsGetCurrentContext() else {
      return
    }
    let colors = [startColor.cgColor, endColor.cgColor]

    // 3
    let colorSpace = CGColorSpaceCreateDeviceRGB()

    // 4
    let colorLocations: [CGFloat] = [0.0, 1.0]

    // 5
    guard let gradient = CGGradient(
      colorsSpace: colorSpace,
      colors: colors as CFArray,
      locations: colorLocations
    ) else {
      return
    }

    // 6
    let startPoint = CGPoint.zero
    let endPoint = CGPoint(x: 0, y: bounds.height)
    context.drawLinearGradient(
      gradient,
      start: startPoint,
      end: endPoint,
      options: []
    )
  }
}
Here’s what you need to know from the code above:
-
You need to set the start and end colors for the gradient as
@IBInspectableproperties so that you’ll be able to change them in the storyboard. -
CG drawing functions need to know the context in which they will draw, so you use the UIKit method
UIGraphicsGetCurrentContext()to obtain the current context. That’s the one thatdraw(_:)draws into. - All contexts have a color space. This could be CMYK or grayscale, but here you’re using the RGB color space.
- The color stops describe where the colors in the gradient change over. In this example, you only have two colors, red going to green, but you could have an array of three stops, and have red going to blue going to green. The stops are between 0 and 1, where 0.33 is a third of the way through the gradient.
- You then need to create the actual gradient, defining the color space, colors and color stops.
-
Finally, you need to draw the gradient.
drawLinearGradient(_:start:end:options:)takes the following parameters:CGGradient
The gradient will fill the entire rect
passed to draw(_:)
.
Open Main.storyboard and you’ll see the gradient appear on the Graph View.

In the storyboard, select the Graph View . Then in the Attributes inspector , change Start Color to RGB(250, 233, 222) , and End Color to RGB(252, 79, 8) . To do this, click the color, then Custom :

Now for some clean up work. In Main.storyboard , select each view in turn, except for the main view, and set the Background Color to Clear Color . You don’t need the yellow color any more and the push button views should have a transparent background anyway.
Build and run, and you’ll notice the graph looks a lot nicer, or at least its background does. :]

Clipping Areas
When you used the gradient just now, you filled the whole of the view’s context area. However, if you don’t want to fill an entire area, you can create paths to clip the drawing area.
To see this in action, go to GraphView.swift .
First, add these constants at the top of GraphView
, which you’ll use for drawing later:
private enum Constants {
  static let cornerRadiusSize = CGSize(width: 8.0, height: 8.0)
  static let margin: CGFloat = 20.0
  static let topBorder: CGFloat = 60
  static let bottomBorder: CGFloat = 50
  static let colorAlpha: CGFloat = 0.3
  static let circleDiameter: CGFloat = 5.0
}
Now add this code to the top of draw(_:)
:
let path = UIBezierPath(
  roundedRect: rect,
  byRoundingCorners: .allCorners,
  cornerRadii: Constants.cornerRadiusSize
)
path.addClip()
This will create a clipping area that constrains the gradient. You’ll use this same trick later to draw a second gradient under the graph line.
Build and run and see that your Graph View has nice, rounded corners:
draw(_:)
.
If you use Core Animation, you’ll use CALayer’s cornerRadius
property instead of clipping. For a good tutorial on this concept, check out Custom Control Tutorial for iOS and Swift: A Reusable Knob
, where you’ll use Core Animation to create a custom control.
Calculating Graph Points
Now you’ll take a short break from drawing to make the graph. You’ll plot 7 points; the x-axis will be the “Day of the Week” and the y-axis will be the “Number of Glasses Drunk”.
First, set up sample data for the week.
Still in GraphView.swift , at the top of the class, add this property:
// Weekly sample data
var graphPoints = [4, 2, 6, 4, 5, 8, 3]
This holds sample data that represents seven days.
Add this code to the top of the draw(_:)
:
let width = rect.width
let height = rect.height
And add this code to the end of draw(_:)
:
// Calculate the x point

let margin = Constants.margin
let graphWidth = width - margin * 2 - 4
let columnXPoint = { (column: Int) -> CGFloat in
  // Calculate the gap between points
  let spacing = graphWidth / CGFloat(self.graphPoints.count - 1)
  return CGFloat(column) * spacing + margin + 2
}
The x-axis points consist of 7 equally spaced points. The code above is a closure expression. It could have been added as a function, but for small calculations like this, you can keep them in line.
columnXPoint
takes a column as a parameter and returns a value where the point should be on the x-axis.
Add the code to calculate the y-axis points to the end of draw(_:)
:
// Calculate the y point

let topBorder = Constants.topBorder
let bottomBorder = Constants.bottomBorder
let graphHeight = height - topBorder - bottomBorder
guard let maxValue = graphPoints.max() else {
  return
}
let columnYPoint = { (graphPoint: Int) -> CGFloat in
  let yPoint = CGFloat(graphPoint) / CGFloat(maxValue) * graphHeight
  return graphHeight + topBorder - yPoint // Flip the graph
}
columnYPoint
is also a closure expression that takes the value from the array for the day of the week as its parameter. It returns the y position, between 0 and the greatest number of glasses drunk.
Because the origin in Core Graphics is in the top-left corner and you draw a graph from an origin point in the bottom-left corner, columnYPoint
adjusts its return value so that the graph is oriented as you would expect.
Continue by adding line drawing code to the end of draw(_:)
:
// Draw the line graph

UIColor.white.setFill()
UIColor.white.setStroke()

// Set up the points line
let graphPath = UIBezierPath()

// Go to start of line
graphPath.move(to: CGPoint(x: columnXPoint(0), y: columnYPoint(graphPoints[0])))

// Add points for each item in the graphPoints array
// at the correct (x, y) for the point
for i in 1..<graphPoints.count {
  let nextPoint = CGPoint(x: columnXPoint(i), y: columnYPoint(graphPoints[i]))
  graphPath.addLine(to: nextPoint)
}

graphPath.stroke()
In this block, you create the path for the graph. The UIBezierPath
is built from the x and y points for each element in graphPoints
.
The Graph View in the storyboard should now look like this:
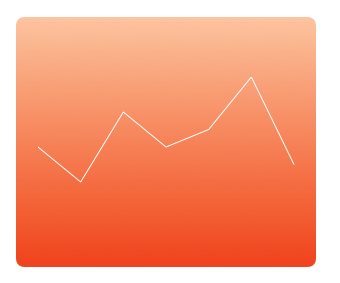
Now that you verified the line draws correctly, remove this from the end of draw(_:)
:
graphPath.stroke()
That was just so that you could check out the line in the storyboard and verify that the calculations are correct.
Creating the Gradient for the Graph
You're now going to create a gradient underneath this path by using the path as a clipping path.
First set up the clipping path at the end of draw(_:)
:
// Create the clipping path for the graph gradient

// 1 - Save the state of the context (commented out for now)
//context.saveGState()

// 2 - Make a copy of the path
guard let clippingPath = graphPath.copy() as? UIBezierPath else {
  return
}

// 3 - Add lines to the copied path to complete the clip area
clippingPath.addLine(to: CGPoint(
  x: columnXPoint(graphPoints.count - 1),
  y: height))
clippingPath.addLine(to: CGPoint(x: columnXPoint(0), y: height))
clippingPath.close()

// 4 - Add the clipping path to the context
clippingPath.addClip()

// 5 - Check clipping path - Temporary code
UIColor.green.setFill()
let rectPath = UIBezierPath(rect: rect)
rectPath.fill()
// End temporary code
In the code above, you:
-
Commented out
context.saveGState()for now. You'll come back to this in a moment once you understand what it does. - Copy the plotted path to a new path that defines the area to fill with a gradient.
- Complete the area with the corner points and close the path. This adds the bottom-right and bottom-left points of the graph.
- Add the clipping path to the context. When the context is filled, only the clipped path is actually filled.
-
Fill the context. Remember that
rectis the area of the context that was passed todraw(_:).
Your Graph View in the storyboard should now look like this:

Next, you'll replace that lovely green with a gradient you create from the colors used for the background gradient.
Replace the temporary code under comment #5 with this code instead:
let highestYPoint = columnYPoint(maxValue)
let graphStartPoint = CGPoint(x: margin, y: highestYPoint)
let graphEndPoint = CGPoint(x: margin, y: bounds.height)

context.drawLinearGradient(
  gradient,
  start: graphStartPoint,
  end: graphEndPoint,
  options: [])
//context.restoreGState()
In this block, you find the highest number of glasses drunk and use that as the starting point of the gradient.
You can't fill the whole rect
the same way you did with the green color. The gradient would fill from the top of the context instead of from the top of the graph, and the desired gradient wouldn't show up.
Take note of the commented out context.restoreGState()
; you'll remove the comments after you draw the circles for the plot points.
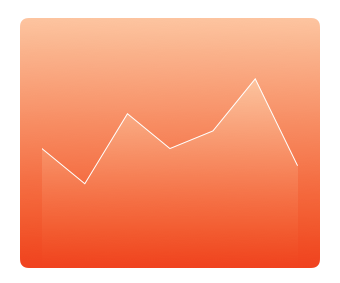
At the end of draw(_:)
, add this:
// Draw the line on top of the clipped gradient
graphPath.lineWidth = 2.0
graphPath.stroke()
This code draws the original path.
Your graph is really taking shape now:
Drawing the Data Points
At the end of draw(_:)
, add the following:
// Draw the circles on top of the graph stroke
for i in 0..<graphPoints.count {
  var point = CGPoint(x: columnXPoint(i), y: columnYPoint(graphPoints[i]))
  point.x -= Constants.circleDiameter / 2
  point.y -= Constants.circleDiameter / 2

  let circle = UIBezierPath(
    ovalIn: CGRect(
      origin: point,
      size: CGSize(
        width: Constants.circleDiameter,
        height: Constants.circleDiameter)
    )
  )
  circle.fill()
}
In the code above, you draw the plot points by filling a circle path for each of the elements in the array at the calculated x and y points.
Hmmm ... what's with those circles? They don't look very round!
Considering Context States
The reason for the odd appearance of the circles has to do with state. Graphics contexts can save states. So when you set many context properties, such as fill color, transformation matrix, color space or clip region, you're actually setting them for the current graphics state.
You can save a state by using context.saveGState()
, which pushes a copy of the current graphics state onto the state stack. You can also make changes to context properties, but when you call context.restoreGState()
, the original state is taken off the stack and the context properties revert. That's why you're seeing the weird issue with your points.
While you're still in GraphView.swift
, in draw(_:)
, uncomment the context.saveGState()
before you create the clipping path. Also, uncomment context.restoreGState()
before you use the clipping path.
By doing this, you:
context.saveGState()
context.restoreGState()
Your graph line and circles should be much clearer now:

At the end of draw(_:)
, add the code below to draw the three horizontal lines:
// Draw horizontal graph lines on the top of everything
let linePath = UIBezierPath()

// Top line
linePath.move(to: CGPoint(x: margin, y: topBorder))
linePath.addLine(to: CGPoint(x: width - margin, y: topBorder))

// Center line
linePath.move(to: CGPoint(x: margin, y: graphHeight / 2 + topBorder))
linePath.addLine(to: CGPoint(x: width - margin, y: graphHeight / 2 + topBorder))

// Bottom line
linePath.move(to: CGPoint(x: margin, y: height - bottomBorder))
linePath.addLine(to: CGPoint(x: width - margin, y: height - bottomBorder))
let color = UIColor(white: 1.0, alpha: Constants.colorAlpha)
color.setStroke()

linePath.lineWidth = 1.0
linePath.stroke()
Easy enough, right? You're just moving to a point and drawing a horizontal line.

Adding the Graph Labels
Now you'll add the labels to make the graph user-friendly.
Go to ViewController.swift and add these outlet properties:
// Label outlets
@IBOutlet weak var averageWaterDrunk: UILabel!
@IBOutlet weak var maxLabel: UILabel!
@IBOutlet weak var stackView: UIStackView!
This adds outlets for dynamically changing the text of the average water drunk label, the max water drunk label as well as the stack view's day name labels.
Now go to Main.storyboard and add the following views as subviews of the Graph View :
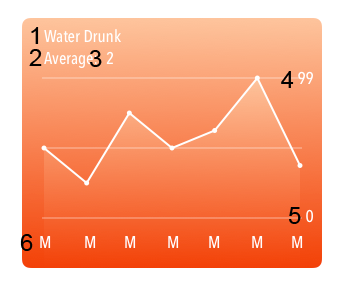
The first five subviews are UILabel
s. The fourth subview is right-aligned next to the top of the graph and the fifth is right-aligned to the bottom of the graph. The sixth subview is a horizontal StackView
with labels for each day of the week. You'll change these in code.
Shift-click all the labels and then change the fonts to custom Avenir Next Condensed, Medium style .
If you have any trouble setting up those labels, check out the code in the final project by using the Download Materials button at the top or bottom of this tutorial.
Connect averageWaterDrunk
, maxLabel
and stackView
to the corresponding views in Main.storyboard
. Control-drag
from View Controller to the correct label and choose the outlet from the pop-up:

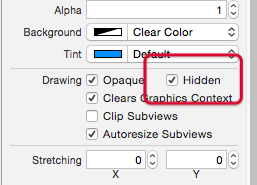
Now that you've finished setting up the graph view, in Main.storyboard select the Graph View and check Hidden so the graph doesn't appear when the app first runs.
Open ViewController.swift and add this method to set up the labels:
func setupGraphDisplay() {
  let maxDayIndex = stackView.arrangedSubviews.count - 1

  // 1 - Replace last day with today's actual data
  graphView.graphPoints[graphView.graphPoints.count - 1] = counterView.counter
  // 2 - Indicate that the graph needs to be redrawn
  graphView.setNeedsDisplay()
  maxLabel.text = "\(graphView.graphPoints.max() ?? 0)"

  // 3 - Calculate average from graphPoints
  let average = graphView.graphPoints.reduce(0, +) / graphView.graphPoints.count
  averageWaterDrunk.text = "\(average)"

  // 4 - Setup date formatter and calendar
  let today = Date()
  let calendar = Calendar.current

  let formatter = DateFormatter()
  formatter.setLocalizedDateFormatFromTemplate("EEEEE")

  // 5 - Set up the day name labels with correct days
  for i in 0...maxDayIndex {
    if let date = calendar.date(byAdding: .day, value: -i, to: today),
      let label = stackView.arrangedSubviews[maxDayIndex - i] as? UILabel {
      label.text = formatter.string(from: date)
    }
  }
}
This looks a little burly, but you need it to set up the calendar and retrieve the current day of the week. To do this, you:
reduce
DateFormatter
stackView
Still in ViewController.swift
, call this new method from counterViewTap(_:)
. In the else
part of the conditional, where the comment says Show graph
, add this code:
setupGraphDisplay()
Build and run and click the counter. Hurrah! The graph swings into view in all its glory!
Mastering the Matrix
Your app is looking really sharp! Still, you could improve the counter view by adding markings to indicate each glass to drink:

Now that you've had a bit of practice with CG functions, you'll use them to rotate and translate the drawing context.
Notice that these markers radiate from the center:

As well as drawing into a context, you have the option to manipulate the context by rotating, scaling and translating the context's transformation matrix.
At first, this can seem confusing, but after you work through these exercises, it'll make more sense. The order of the transformations is important, so here are some diagrams to explain what you'll be doing.
The following diagram is the result of rotating the context and then drawing a rectangle in the center of the context.

The black rectangle is drawn before rotating the context followed by the green and the red one. Two things to notice:
- The context is rotated at the top left (0,0)
- The rectangle still shows in the center of the context after you rotate the context.
When you're drawing the counter view's markers, you'll translate the context first before you rotate it.
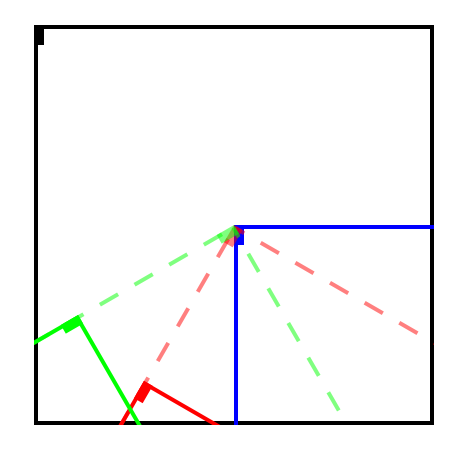
In this diagram, the rectangle marker is at the very top left of the context. The blue lines outline the translated context. The red dashed lines indicate the rotation. After this, you translate the context again.
When you draw the red rectangle into the context, you'll make it appear in the view at an angle.
After you rotate and translate the context to draw the red marker, you need to reset the center so that you can rotate and translate the context again to draw the green marker.
Just as you saved the context state with the clipping path in the Graph View, you'll save and restore the state with the transformation matrix each time you draw the marker.
Drawing the Marker
Go to CounterView.swift
and add this code to the end of draw(_:)
to add the markers to the counter:
// Counter View markers
guard let context = UIGraphicsGetCurrentContext() else {
  return
}

// 1 - Save original state
context.saveGState()
outlineColor.setFill()

let markerWidth: CGFloat = 5.0
let markerSize: CGFloat = 10.0

// 2 - The marker rectangle positioned at the top left
let markerPath = UIBezierPath(rect: CGRect(
  x: -markerWidth / 2,
  y: 0,
  width: markerWidth,
  height: markerSize))

// 3 - Move top left of context to the previous center position
context.translateBy(x: rect.width / 2, y: rect.height / 2)

for i in 1...Constants.numberOfGlasses {
  // 4 - Save the centered context
  context.saveGState()
  // 5 - Calculate the rotation angle
  let angle = arcLengthPerGlass * CGFloat(i) + startAngle - .pi / 2
  // Rotate and translate
  context.rotate(by: angle)
  context.translateBy(x: 0, y: rect.height / 2 - markerSize)

  // 6 - Fill the marker rectangle
  markerPath.fill()
  // 7 - Restore the centered context for the next rotate
  context.restoreGState()
}

// 8 - Restore the original state in case of more painting
context.restoreGState()
In the code above, you:
- Save the original state of the matrix before you manipulate the context's matrix.
- Define the position and shape of the path, though you're not drawing it yet.
- Move the context so that rotation happens around the context's original center, indicated by the blue lines in the previous diagram.
- Save the centered context state for each mark.
- Determine the angle for each marker using the individual angle previously calculated. Then you rotate and translate the context.
- Draw the marker rectangle at the top left of the rotated and translated context.
- Restore the centered context's state.
- Restore the original state of the context before any rotations or translations.
Whew! Nice job hanging in there for that. Now build and run and admire Flo's beautiful and informative UI:

Where to Go to From Here?
You can download the completed version of the project using the Download Materials button at the top or bottom of this tutorial.
At this point, you've learned how to draw paths, gradients, and how to change the context's transformation matrix.
If you'd like to learn more about custom layouts, consider the following resources:
- Check out the Quartz 2D Programming Guide provided by Apple.
- Follow our video course on Core Graphics if you prefer the video format.
If you have any questions or comments, please join the discussion below!
很遗憾的说,推酷将在这个月底关闭。人生海海,几度秋凉,感谢那些有你的时光。
Recommend
About Joyk
Aggregate valuable and interesting links.
Joyk means Joy of geeK