

Python 绘制Android CPU和内存增长曲线 - 陈文管的博客
source link: https://www.chenwenguan.com/python-draw-cpu-memory-chart/?
Go to the source link to view the article. You can view the picture content, updated content and better typesetting reading experience. If the link is broken, please click the button below to view the snapshot at that time.
Python 绘制Android CPU和内存增长曲线
2020年5月16日 | 最近更新于 下午6:03
在做性能监控的时候,如果能把监控的CPU和内存增长变化用图表展示出来会比较直观,花了点时间用Python实现了下,来看下怎么用Python绘制Android CPU和内存变化曲线,生成增长曲线图表的PNG图片。
一、实现效果
一开始想通过采集的CPU和内存数据,导出到Excel生成增长曲线图表。做了下调研,并没有比较好的实现方法。后面看了下用Python来绘制图表实现起来挺容易的,而且Python的学习成本低,语法之类的做过开发的稍微看下就知道怎么用,容易上手。
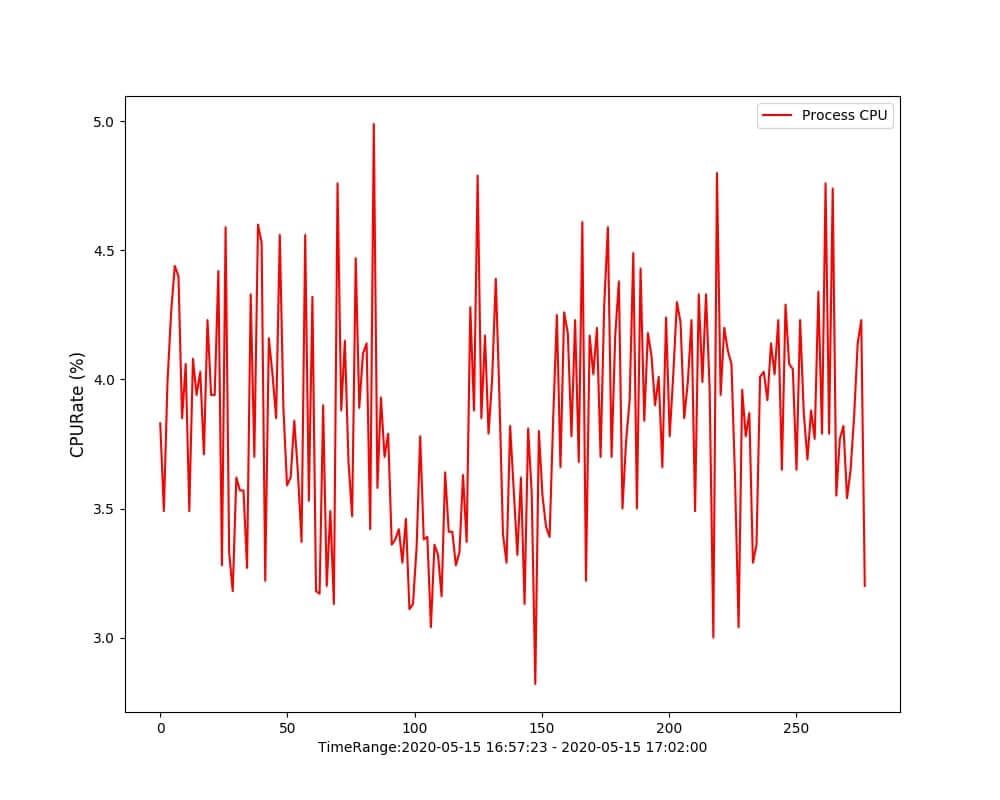
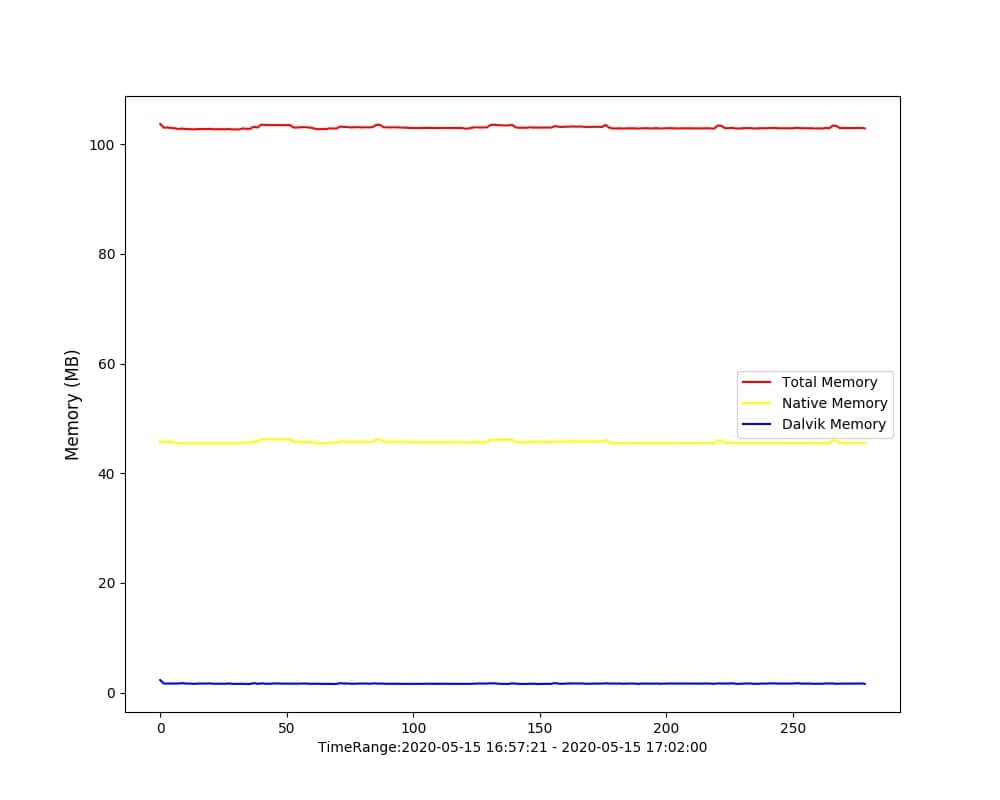
具体实现的效果如下,CPU和内存采集的数据是独立进程的,内存分三块数据,应用总内存,Native内存和Dalvik内存,如果存在内存泄漏,要么在Native,要么在Dalvik,从图表增长曲线上很容易看出来。
二、具体逻辑实现详解
1. CPU图表的Python实现
# -*- coding: utf-8 -*-

import matplotlib
matplotlib.use('Agg')
import matplotlib.pyplot as plt
import json
import sys
import time
import traceback

def startDump():
  try:
    cpuData = json.loads(sys.argv[1])
    imagePath = sys.argv[2]
    cpuRateArray = []
    timeArray = []
    for cpuItem in cpuData:
      cpuRateArray.append(float(cpuItem["cpuRate"]))
      timeArray.append((float(float(cpuItem["time"]) - float(cpuData[0]["time"]))/1000))

    plt.title("Monitor Cpu Rate")
    plt.figure(figsize=(10, 8))
    plt.tight_layout()
    plt.plot(timeArray, cpuRateArray, c='red', label='Process CPU')
    plt.ylabel("CPURate (%)", fontsize=12)
    plt.xlabel("TimeRange:" + formatTime(float(cpuData[0]["time"])) + ' - ' + formatTime(float(cpuData[len(cpuData) -1]["time"])), fontsize=10)
    plt.legend()
    plt.savefig(imagePath)

  except Exception:
    print 'exeption occur:' + traceback.format_exc()

def formatTime(timeMillis):
  timeSeconds = float(timeMillis/1000)
  timelocal = time.localtime(timeSeconds)
  timeFormat = time.strftime("%Y-%m-%d %H:%M:%S", timelocal)
  return timeFormat

if __name__ == '__main__':
  startDump()
2. 内存图表的Python实现
# -*- coding: utf-8 -*-

import matplotlib
matplotlib.use('Agg')
import matplotlib.pyplot as plt
import json
import sys
import time
import traceback

def startDump():
  try:
    memoryData = json.loads(sys.argv[1])
    imagePath = sys.argv[2]
    totalPssArray = []
    nativePssArray = []
    dalvikPssArray = []
    timeArray = []
    for memoryItem in memoryData:
      totalPssArray.append(float(memoryItem["totalPss"])/1024)
      nativePssArray.append(float(memoryItem["nativePss"])/1024)
      dalvikPssArray.append(float(memoryItem["dalvikPss"])/1024)
      timeArray.append((float(float(memoryItem["time"]) - float(memoryData[0]["time"]))/1000))

    plt.title("Monitor Memory")
    plt.figure(figsize=(10, 8))
    plt.tight_layout()
    plt.plot(timeArray, totalPssArray, c='red', label='Total Memory')
    plt.plot(timeArray, nativePssArray, c='yellow', label='Native Memory')
    plt.plot(timeArray, dalvikPssArray, c='blue', label='Dalvik Memory')
    plt.ylabel("Memory (MB)", fontsize=12)
    plt.xlabel("TimeRange:" + formatTime(float(memoryData[0]["time"])) + ' - ' + formatTime(float(memoryData[len(memoryData) -1]["time"])), fontsize=10)
    plt.legend()
    plt.savefig(imagePath)

  except Exception:
    print 'exeption occur:' + traceback.format_exc()

def formatTime(timeMillis):
  timeSeconds = float(timeMillis/1000)
  timelocal = time.localtime(timeSeconds)
  timeFormat = time.strftime("%Y-%m-%d %H:%M:%S", timelocal)
  return timeFormat

if __name__ == '__main__':
  startDump()
3. 实现说明
脚本传入的参数有两个,一个是监控的JSON数据字符串值sys.argv[1],一个是保存的图片文件完整路径sys.argv[2]。关于传入的JSON参数字符串值需要加上单引号修饰,否则会导致解析异常,传入的JSON参数也不能直接是JSON对象,必须转化成字符串,示例调用命令如下:
python dump_chart.py '<JSONString>' cpu_chart.png
1)采样CPU示例数据,time是设备的系统时间戳,CPU的占用率的计算可以查看前面写的:Android 性能监控之CPU监控
[
 {
 "time": "1589435564442.279053",
 "cpuRate": "2.17"
 },
 {
 "time": "1589435565655.333008",
 "cpuRate": "3.26"
 },
 {
 "time": "1589435566954.137939",
 "cpuRate": "2.52"
 },
 ...
]
2)采样内存示例数据,totalPss、nativePss和dalvikPss值都是从dumpsys meminfo输出的应用内存信息中截取出来的原始数据,对应“TOTAL”、“Native Heap“、”Dalvik Heap“字段的Pss Total值。内存信息的监控获取参考:Android 性能监控之内存监控
[
 {
 "time": "1589636256923.429932",
 "totalPss": 177804,
 "nativePss": 27922,
 "dalvikPss": 10212
 },
 {
 "time": "1589636258236.298096",
 "totalPss": 178021,
 "nativePss": 27850,
 "dalvikPss": 9990
 },
 {
 "time": "1589636259525.219971",
 "totalPss": 177899,
 "nativePss": 27742,
 "dalvikPss": 9990
 },
 ...
]
三、实现过程中遇到的问题
1. load方法使用错误
json.load()方法使用错误,应该替换成json.loads()。
exeption occur:Traceback (most recent call last):
  File "*******", line 11, in startDump
    memoryData = json.load(sys.argv[1])
  File "/usr/local/Cellar/python@2/2.7.15_1/Frameworks/Python.framework/Versions/2.7/lib/python2.7/json/__init__.py", line 287, in load
    return loads(fp.read(),
AttributeError: 'str' object has no attribute 'read'
2. JSON字符串对象入参问题
  File "******", line 11, in startDump
    memoryData = json.loads(sys.argv[1])
  File "/usr/local/Cellar/python@2/2.7.15_1/Frameworks/Python.framework/Versions/2.7/lib/python2.7/json/__init__.py", line 339, in loads
    return _default_decoder.decode(s)
  File "/usr/local/Cellar/python@2/2.7.15_1/Frameworks/Python.framework/Versions/2.7/lib/python2.7/json/decoder.py", line 364, in decode
    obj, end = self.raw_decode(s, idx=_w(s, 0).end())
  File "/usr/local/Cellar/python@2/2.7.15_1/Frameworks/Python.framework/Versions/2.7/lib/python2.7/json/decoder.py", line 382, in raw_decode
    raise ValueError("No JSON object could be decoded")
ValueError: No JSON object could be decoded
针对Python脚本调用,JSON字符串对象作为入参,传入的JSON字符串对象需要加单引号处理,比如在JavaScript中示例处理如下:
'\'' + JSON.stringify(cpuRateJSON) + '\''
3. Python需要显示声明参数的类型
在Python中需要指明参数的类型,解析获取到JSON对象中的值之后,Python并不会根据参数来判断是什么类型,需要指明要转化的对象参数类型,比如把系统时间戳转化成float值类型:float(memoryData[0][“time”])
Traceback (most recent call last):
  File "*******", line 21, in startDump
    timeArray.append(timeStamp(memoryItem["time"]))
  File "*******", line 36, in timeStamp
    timeStamp = float(timeNum/1000)
TypeError: unsupported operand type(s) for /: 'unicode' and 'int'
4. 编码导致的异常
SyntaxError: Non-ASCII character '\xe5' in file ******* on line 24, but no encoding declared; see http://python.org/dev/peps/pep-0263/ for details
如果运行之后报如下的异常,说明是编码出问题,在脚本开头加上编码类型声明:
#!usr/bin/python
# -*- coding: utf-8 -*-
5. 保存的文件格式限制
plt.savefig(image_path) 保存的文件格式只能是eps, pdf, pgf, png, ps, raw, rgba, svg, svgz这些,不支持jpg图片的保存。
Traceback (most recent call last):
  File "/Users/chenwenguan/Documents/AmapAuto/Project/arc-resources/script/performanceMonitor/dump_cpu_chart_image.py", line 23, in startDump
    plt.savefig(image_path)
  File "/usr/local/lib/python2.7/site-packages/matplotlib/pyplot.py", line 695, in savefig
    res = fig.savefig(*args, **kwargs)
  File "/usr/local/lib/python2.7/site-packages/matplotlib/figure.py", line 2062, in savefig
    self.canvas.print_figure(fname, **kwargs)
  File "/usr/local/lib/python2.7/site-packages/matplotlib/backend_bases.py", line 2173, in print_figure
    canvas = self._get_output_canvas(format)
  File "/usr/local/lib/python2.7/site-packages/matplotlib/backend_bases.py", line 2105, in _get_output_canvas
    .format(fmt, ", ".join(sorted(self.get_supported_filetypes()))))
ValueError: Format 'jpg' is not supported (supported formats: eps, pdf, pgf, png, ps, raw, rgba, svg, svgz)
6. python-tk 依赖
Traceback (most recent call last):
  File "*******", line 2, in <module>
    import matplotlib.pyplot as plt
  File "/home/arc/.local/lib/python2.7/site-packages/matplotlib/pyplot.py", line 115, in <module>
    _backend_mod, new_figure_manager, draw_if_interactive, _show = pylab_setup()
  File "/home/arc/.local/lib/python2.7/site-packages/matplotlib/backends/__init__.py", line 63, in pylab_setup
    [backend_name], 0)
  File "/home/arc/.local/lib/python2.7/site-packages/matplotlib/backends/backend_tkagg.py", line 4, in <module>
    from . import tkagg  # Paint image to Tk photo blitter extension.
  File "/home/arc/.local/lib/python2.7/site-packages/matplotlib/backends/tkagg.py", line 5, in <module>
    from six.moves import tkinter as Tk
  File "/home/arc/.local/lib/python2.7/site-packages/six.py", line 203, in load_module
    mod = mod._resolve()
  File "/home/arc/.local/lib/python2.7/site-packages/six.py", line 115, in _resolve
    return _import_module(self.mod)
  File "/home/arc/.local/lib/python2.7/site-packages/six.py", line 82, in _import_module
    __import__(name)
  File "/usr/lib/python2.7/lib-tk/Tkinter.py", line 42, in <module>
    raise ImportError, str(msg) + ', please install the python-tk package'
缺少python-tk依赖,执行一下命令安装:
sudo apt-get install -y python-tk
7. Agg画布初始化配置
Traceback (most recent call last):
  File "******", line 22, in startDump
    plt.title("ARC Monitor Memory")
  File "/home/arc/.local/lib/python2.7/site-packages/matplotlib/pyplot.py", line 1419, in title
    return gca().set_title(s, *args, **kwargs)
  File "/home/arc/.local/lib/python2.7/site-packages/matplotlib/pyplot.py", line 969, in gca
    return gcf().gca(**kwargs)
  File "/home/arc/.local/lib/python2.7/site-packages/matplotlib/pyplot.py", line 586, in gcf
    return figure()
  File "/home/arc/.local/lib/python2.7/site-packages/matplotlib/pyplot.py", line 533, in figure
    **kwargs)
  File "/home/arc/.local/lib/python2.7/site-packages/matplotlib/backend_bases.py", line 161, in new_figure_manager
    return cls.new_figure_manager_given_figure(num, fig)
  File "/home/arc/.local/lib/python2.7/site-packages/matplotlib/backends/_backend_tk.py", line 1046, in new_figure_manager_given_figure
    window = Tk.Tk(className="matplotlib")
  File "/usr/lib/python2.7/lib-tk/Tkinter.py", line 1828, in __init__
    self.tk = _tkinter.create(screenName, baseName, className, interactive, wantobjects, useTk, sync, use)
TclError: no display name and no $DISPLAY environment variable
在Mac上运行的时候不会出现这个问题,但在Ubuntu环境下运行的时候就报异常了,官网的解释如下:
When using Matplotlib versions older than 3.1, it is necessary to explicitly instantiate an Agg canvas
在脚本文件开头显示声明Agg使用:
import matplotlib
matplotlib.use('Agg')
import matplotlib.pyplot as plt
8. pyecharts 版本配置问题
如果不是用Python原生方式绘图,而是用pyecharts来绘制图表,要注意下Python版本的匹配。pyecharts v1.0.0 停止对 Python2.7,3.4~3.5 版本的支持和维护,仅支持 Python3.6+。
Traceback (most recent call last):
  File "*******", line 11, in <module>
    from pyecharts import options as opts
  File "/usr/local/lib/python2.7/site-packages/pyecharts/__init__.py", line 1, in <module>
    from pyecharts import charts, commons, components, datasets, options, render, scaffold
  File "/usr/local/lib/python2.7/site-packages/pyecharts/charts/__init__.py", line 2, in <module>
    from ..charts.basic_charts.bar import Bar
  File "/usr/local/lib/python2.7/site-packages/pyecharts/charts/basic_charts/bar.py", line 17
    series_name: str,
               ^
SyntaxError: invalid syntax
9. 图像显示不全问题
测试过程中发现依次保存CPU和内存数据,可能会出现其中一张图片显示有缺失,只显示一半图像内容。在matplotlib中,轴Axes的位置以标准化图形坐标指定,可能发生的情况是轴标签、标题、刻度标签等等会超出图形区域,导致显示不全。后面加上tight_layout自适应调用之后问题修复。tight_layout会自动调整子图参数,使之填充整个图像区域。
plt.tight_layout()
四、参考资料
Parser for command-line options, arguments and sub-commands
扩展阅读:
转载请注明出处:陈文管的博客 – Python 绘制Android CPU和内存增长曲线
扫码或搜索:文呓

微信公众号 扫一扫关注
Filed Under: 前端开发
Recommend
About Joyk
Aggregate valuable and interesting links.
Joyk means Joy of geeK