

Principles to Handle Thousands of Connections in Java Using Netty - DZone Perfor...
source link: https://dzone.com/articles/thousands-of-socket-connections-in-java-practical
Go to the source link to view the article. You can view the picture content, updated content and better typesetting reading experience. If the link is broken, please click the button below to view the snapshot at that time.
Principles to Handle Thousands of Connections in Java Using Netty
Learn common principles for building scalable applications that handle thousands of connections.
C10K problem is a term that stands for ten thousand concurrently handling connections. To achieve this, we often need to make changes in the settings of created network sockets and default settings of Linux kernel, monitor the usage of the TCP Send/Receive Buffers and Queues, and, in particular, adjust our application to be a good candidate for solving this problem.
In today's article, I'm going to discuss common principles that need to be followed if we want to build a scalable application that can handle thousands of connections. I will refer to Netty Framework, TCP, and Socket internals and some useful tools if you want to get some insights from your application and underlying system.
You may also like: Programming Models for Servers in Java
Disclaimer: I'll be a bit pedantic in terms of memory because if we want to multiply our processing flow by the number of connections (10 000>), then every kilobyte in one connection processing pipeline becomes very expensive :)
Principle 1: Make Your Application a Good Fit for C10K Problem
As we mentioned above, when we need to utilize CPU as much as possible with minimum context-switches and low-memory footprint, then you need to keep your thread count in your process very close to a number of processors that are dedicated for the given application.
Keeping this in mind, the only possible solution is to pick up some non-blocking business logic or business logic that has a very high ratio CPU/IO processing time (but it already becomes risky).
Sometimes, it's not very easy to identify this behavior in your application stack. Sometimes, you will need to re-arrange your applications/code, add an additional external queue (RabbitMQ) or topic (Kafka) to change your distributed system to be able to buffer tasks and to be able to split up non-blocking code from the code that cannot be easily reimplemented using non-blocking techniques (e.g. usage of JDBC driver, currently there is no official non-blocking driver to relational databases — as far as I know, work on ADBC — Asynchronous Database Access API — has been already stopped).
However, according to my experience, it worth re-writing my code and making it more non-blocking because of those reasons:
I split up my application into two different apps that very likely do not share the same deployment and design strategies, even if they share the same "domain" (e.g. one part of the app is REST endpoint that can be implemented using thread-pool-based HTTP Server and the second part is a consumer from a queue/topic that writes something to DB using non-blocking driver).
I'm able to scale the number of instances of those two parts differently because very likely the load/CPU/memory is absolutely different.
What can signify that we are using proper tools for that kind of applications:
We keep the number of threads as low as possible. Don't forget to check not only your server threads but also other parts of your application: queue/topic consumer, DB driver settings, logging settings (with asynchronous micro-batching). Always make a thread dump to see what threads are created in your application and how many (don't forget to make it under the load otherwise your thread-pools won't be fully initialized, a lot of them create threads lazily). I always name my custom threads from thread-pool (it's much easier to find a victim and debug your code).
Be aware of blocking HTTP/DB calls to other services, we can use reactive clients that automatically register a callback for the incoming response. Consider using a protocol that is more suitable for service-2-service communication, e.g. RSocket.
Check if your application contains a constantly low number of threads. It refers to whether or not your application has bounded thread pools and is able to withstand the given load.
If your application has multiple processing flows, then always validate which of them are blocking and which are non-blocking. If the number of blocking flows is significant, then you need almost every request (at least part of the processing flow where the blocking call is used) process on a different thread (from a predefined thread-pool) to release event-loop thread for the next connection (more information in the following chapter).
In this case, consider using thread-pool-based HTTP Server with workers where all requests are put on a different thread from a very huge thread-pool to increase throughput — there is no other way if we are not able to get rid of blocking calls.
Principle 2: Cache Connections, Not Threads
This principle is closely coupled with a topic of Programming models for HTTP Server. The main idea is not to bind a connection to a single thread but use some libraries that support a bit complicated but much more effective approach of reading from TCP.
It does not mean that TCP connection is absolutely for free. The most crucial part is the TCP Handshake. Therefore, you should always go with Persistent Connection (keep-alive). If we used one TCP connection only for sending one message, we would pay the overhead of 8 TCP segments (connect and close the connection = 7 segments).
Accepting a New TCP Connection
If we are in a situation where we are not able to use a persistent connection, then we very likely end up with a lot of created connections in a very short period of time. Those created connections must be queued and waiting for the acceptance of our application.
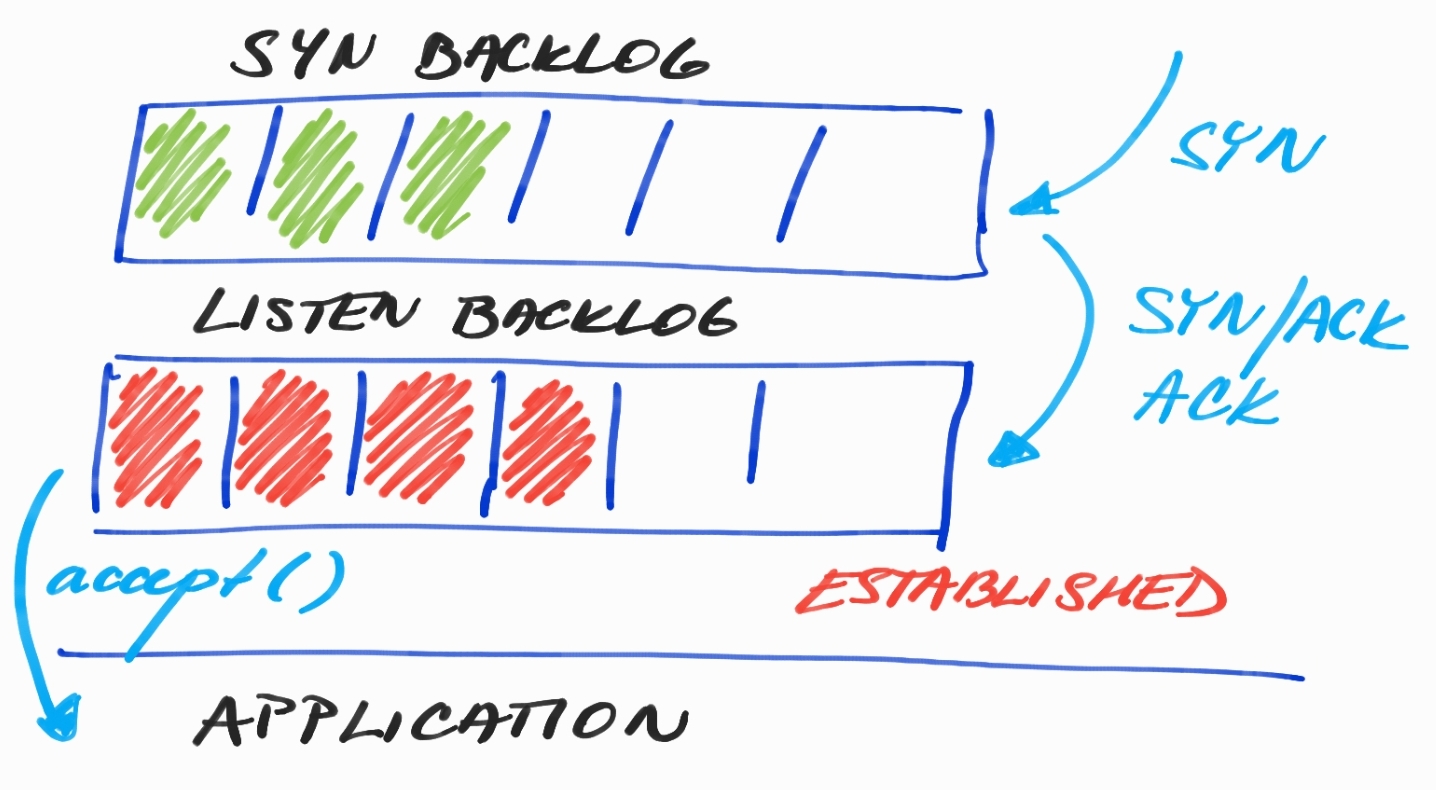
In the picture above, we can see to backlogs SYN and LISTEN. In the SYN Backlog, we can find connections that are just waiting to be acknowledged using TCP Handshake. However, in LISTEN Backlog, we already have fully initialized connections, even with TCP Send/Receive Buffers that are just waiting to be accepted by our application.
Read SYN Flood DDoS Attack if you want to know more why we actually need two backlogs.
There is actually one problem if we are under the load and have a lot of incoming connections, our application threads that are responsible for accepting the connections can be busy by doing some other work — doing IO for already connected clients.
xxxxxxxxxx
var bossEventLoopGroup = new EpollEventLoopGroup(1);
var workerEventLoopGroup = new EpollEventLoopGroup();
new ServerBootstrap()
.channel(EpollServerSocketChannel.class)
.group(bossEventLoopGroup, workerEventLoopGroup)
.localAddress(8080)
.childOption(ChannelOption.SO_SNDBUF, 1024 * 1024)
.childOption(ChannelOption.SO_RCVBUF, 32 * 1024)
.childHandler(new CustomChannelInitializer());
In the code snippet above (Netty Server configuration API), we can see
bossEventLoopGroup
and
workerEventLoopGroup
. While
workerEventLoopGroup is by default created with
# of CPUs * 2 threads/event-loops for doing IO operations,
bossEventLoopGroup
contains one thread for accepting new connections. Netty allows having only one group for both actions, but in this case, accepting new connections can starve because of doing I/O or doing longer operations in
ChannelHandlers.
If we run into the problem of having full LISTEN Backlog, then we can increase the number of threads in bossEventLoopGroup. We can very easily test if our process is able to withstand the load of incoming connections. I modified our test application Websocket-Broadcaster to connect 20 000 clients and run multiple times this command:
$ ss -plnt sport = :8081|cat
State    Recv-Q    Send-Q        Local Address:Port        Peer Address:Port
LISTEN   42        128                       *:8081                   *:*        users:(("java",pid=7418,fd=86))

$ ss -plnt sport = :8081|cat
State    Recv-Q    Send-Q        Local Address:Port        Peer Address:Port
LISTEN   0         128                       *:8081                   *:*        users:(("java",pid=7418,fd=86))

$ ss -plnt sport = :8081|cat
State    Recv-Q    Send-Q        Local Address:Port        Peer Address:Port
LISTEN   20        128                       *:8081                   *:*        users:(("java",pid=7418,fd=86))

$ ss -plnt sport = :8081|cat
State    Recv-Q    Send-Q        Local Address:Port        Peer Address:Port
LISTEN   63        128                       *:8081                   *:*        users:(("java",pid=7418,fd=86))

$ ss -plnt sport = :8081|cat
State    Recv-Q    Send-Q        Local Address:Port        Peer Address:Port
LISTEN 0 128 *:8081 *:* users:(("java",pid=7418,fd=86))Send-Q: the total size of LISTEN Backlog
Recv-Q: the current number of connections in LISTEN Backlog
xxxxxxxxxx
# Current default size of LISTEN Backlog
# Feel free to change it and test SS command again
cat /proc/sys/net/core/somaxconn
128
TCP Send/Receive Buffers
However, when your connection is ready the most greedy parts are TCP Send/Receiver Buffers that are used to transfer bytes written by your application to the underlying network stack. Size of those buffers can be set via the application:
xxxxxxxxxx
new ServerBootstrap()
.channel(EpollServerSocketChannel.class)
.group(bossEventLoopGroup, workerEventLoopGroup)
.localAddress(8080)
.childOption(ChannelOption.SO_SNDBUF, 1024 * 1024)
.childOption(ChannelOption.SO_RCVBUF, 32 * 1024)
.childHandler(new CustomChannelInitializer());
For more information about Socket Options in Java, look at the StandardSocketOptions class. Newer versions of Linux are able to automatically tune the buffers to reach out to optimal size for the current load in cooperation with TCP Congestion Window.
Read TCP Buffer Sizing before any custom sizing. Bigger buffers can lead to wasting memory, on the other hand, smaller buffers can throttle the reader's or writer's application because there won't be any space for transferring bytes to/from the network stack.
Why caching Thread is a bad idea?
How much memory our "micro"service needs to handle thousands of connections if we use connection-per-thread strategy or bigger thread-pools to handle blocking business logic.
Java Thread is a pretty expensive object because it's mapped one-to-one to a kernel thread (hopefully, project Loom will come early to rescue us). In Java, we are able to limit the stack size of the thread using -Xss option that is set to 1MB by default. It means one thread takes 1MB of Virtual Memory but not Committed Memory.
The real RSS (Resident Set Size) is equal to the current size of the stack; the memory is not fully allocated and mapped to physical memory at the very beginning (it's very often misunderstood, as demonstrated in this post: How Much Memory Does a Java Thread Take?). Usually (according to my experience), the size of the thread is in hundreds of kilobytes (200-300kB) if we really don't use some greedy frameworks or recursion. This kind of memory belongs to Native Memory; we can track this in Native Memory Tracking.
xxxxxxxxxx
$ java -XX:+UnlockDiagnosticVMOptions -XX:NativeMemoryTracking=summary /
-XX:+PrintNMTStatistics -version
openjdk version "11.0.2" 2019-01-15
OpenJDK Runtime Environment AdoptOpenJDK (build 11.0.2+9)
OpenJDK 64-Bit Server VM AdoptOpenJDK (build 11.0.2+9, mixed mode)
Native Memory Tracking:
Total: reserved=6643041KB, committed=397465KB
- Java Heap (reserved=5079040KB, committed=317440KB)
(mmap: reserved=5079040KB, committed=317440KB)
- Class (reserved=1056864KB, committed=4576KB)
(classes #426)
( instance classes #364, array classes #62)
(malloc=96KB #455)
(mmap: reserved=1056768KB, committed=4480KB)
( Metadata: )
( reserved=8192KB, committed=4096KB)
( used=2849KB)
( free=1247KB)
( waste=0KB =0,00%)
( Class space:)
( reserved=1048576KB, committed=384KB)
( used=270KB)
( free=114KB)
( waste=0KB =0,00%)
- Thread (reserved=15461KB, committed=613KB)
(thread #15)
(stack: reserved=15392KB, committed=544KB)
(malloc=52KB #84)
(arena=18KB #28)
Another problem with a big number of threads is a huge Root Set. For instance, we have 4 CPUs and 200 threads. In this case, we are still able to run only 4 threads at the given time, but if all 200 threads are already busy with processing some request, we pay an incredible big price for objects that are already allocated on Java Heap but cannot make any progress because the given thread waits for CPU time. All the objects that have been already allocated, and are still in use, are part of Live Set (reachable objects that have to be walked through during Garbage Collection cycle and cannot be collected).
Why a Root Set is such a big deal?
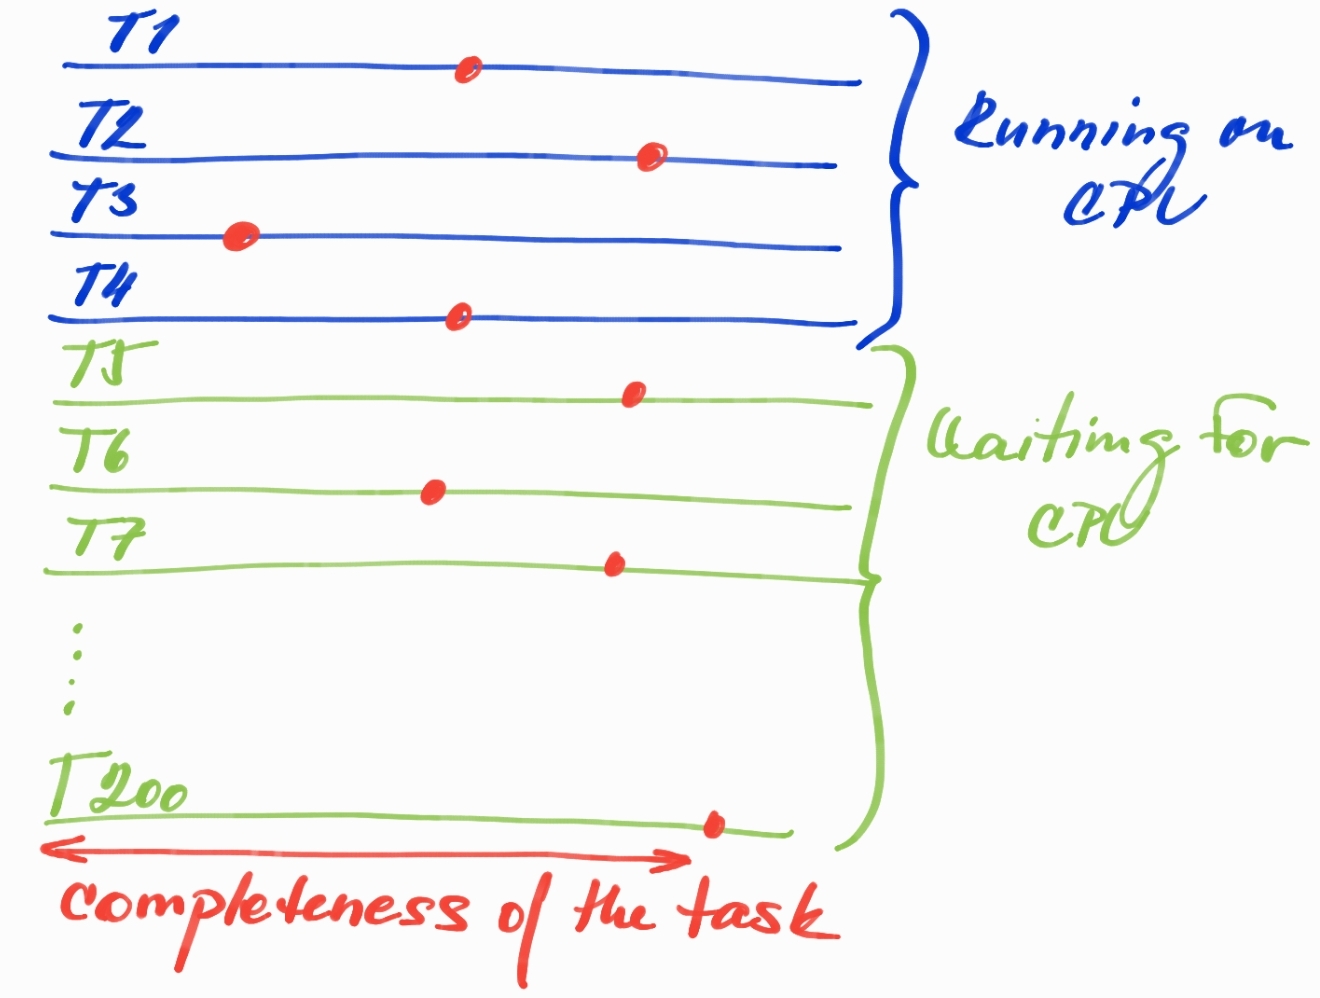
The red dots can represent any point of time when only 4 threads are currently running on CPU and the rest just wait in CPU Run Queue. The completeness of the task does not mean that all the objects allocated so far are still alive and part of the Live Set, they can be already turned to garbage waiting for the next GC cycle to be removed. What is so bad about this situation?
Too big Live Set: Every thread keeps allocated live objects on the Java Heap that just wait for CPU to make some progress. We need to keep it in mind when we size the heap where a lot of memory will be used this way — very inefficiently — especially if we want to design small services handling a lot of requests.
Bigger GC Pauses due to the bigger Root Set: Bigger Root Set means a complicated job for our Garbage Collector. Modern GCs starts with identifying Root Set (also called Snapshot-at-the-beginning or initial-mark, mainly live threads keeping the allocated reachable objects from outside of the heap - but not only threads) and then concurrently walk through the object graph/references to find the current Live Set. The bigger Root Set the more work for GC to identify it and walk through it, moreover, initial-mark is usually the phase that is known as a Stop-the-world phase. The concurrent walking through the huge object graph can also result in big delays and the worse predictability of GC itself (GC has to start the concurrent phase earlier to make it before the heap is full, also depending on allocation rate).
Promotions to Old Generation: The bigger Live Set will also have an impact on the time how long a given object will be considered as a live object. This increases the chance that the object will be promoted to Old Generation (or at least to Survival Spaces) even if the thread keeping this object spent the majority of its time outside the CPU.
Principle 3: Stop Generating Garbage
If you really want to write an application that is going to be under the big load then you need to think of the allocation of all objects and don't let JVM waste any single byte. This brings us to ByteBuffersand ByteBuf from Netty. This is very advanced therefore just very briefly.
ByteBuffers are JDK holders of bytes. There two options HeapByteBuffer (byte arrays allocated on heap) and DirectByteBuffer (off-heap memory). The main reason is that DirectByteBuffers can be directly passed to native OS functions for performing I/O — in other words, when you perform I/O in Java, you pass a reference to DirectByteBuffer(with offset and length).
This can help in many use-cases. Imagine, you have 10k connections and want to broadcast the same string value to all of them. There is no reason to pass the string and cause that the same string will be mapped to bytes 10k-times (or even worse, generate the new string object for every client connections and pollute the heap with the same array of bytes — and hope that String deduplication mechanism will take in place quickly). Instead, we can generate our own DirectByteBuffer and provide it to all connections and let them just pass it through JVM to OS.
However, there is one problem. DirectByteBuffer is very expensive to allocate. Therefore in JDK, every thread doing I/O (and not consuming DirectByteBuffersgenerate from our application logic) caches one DirectByteBufferfor this internal use. Please, read Fixing Java's ByteBuffer native memory "leak" to get some information about a potential problem of this solution.
But why we need HeapByteBufferif we still need to convert it to DirectByteBufferinternally to be able to write it to OS? That's true, but HeapByteBufferis much cheaper in terms of allocation. If we take into consideration the example above, we could at least eliminate the first step — encoding the string into the array of bytes (and not to do it 10k-times), and then we can count on the automatic caching mechanism of DirectByteBufferfor every threadinside JDK and don't have to pay a price of allocating new DirectByteBufferfor every new string message, or we would need to develop our own caching mechanism in our business code.
Which option is better? When do we want to go for DirectByteBuffer without caching and when it's better to user HeapByteBuffer and count on automatic caching mechanism? We need to experiment and measure.
I mentioned ByteBufmechanism for Netty. It's actually the concept as ByteBuffer; however, we can enjoy convenient API based on 2 indices (one for reading, one for writing). Another difference is in reclaiming the memory. DirectByteBufferis based on JDK Cleaner class.
That means that we need to run GC otherwise we run out of Native Memory. This could be a problem for applications that are very optimized don't allocate on the heap that means that don't trigger any GC. Then we need to count on that the explicit GC (System#gc()) will come in rescue and reclaim enough memory for the next native allocations.
Netty's ByteBufcan be created in two versions: pooled and unpooled, and the release of native memory (or putting the buffer back to pool) is based on a reference counting mechanism. It's some kind of additional manual work. We need to write when we want to decrease the reference counter but it solves the problem mentioned above.
If you want to read on about buffer:
Troubleshooting Problems With Native (Off-Heap) Memory in Java Applications
Principle 4: Measure What Kind of Load You Generate in Peak Hours
If you want to get insights into the TCP layer, then I can highly recommend:
Using bpftrace, we can write a simple program to and get a quick result and be able to investigate the problem. This is the example of socketio-pid.bt showing how many bytes were transferred based on PID granularity.
xxxxxxxxxx
#!/snap/bin/bpftrace
#include <linux/fs.h>
BEGIN
{
printf("Socket READS/WRITES and transmitted bytes, PID: %u\n", $1);
}
kprobe:sock_read_iter,
kprobe:sock_write_iter
/$1 == 0 || ($1 != 0 && pid == $1)/
{
@kiocb[tid] = arg0;
}
kretprobe:sock_read_iter
/@kiocb[tid] && ($1 == 0 || ($1 != 0 && pid == $1))/
{
$file = ((struct kiocb *)@kiocb[tid])->ki_filp;
$name = $file->f_path.dentry->d_name.name;
@io[comm, pid, "read", str($name)] = count();
@bytes[comm, pid, "read", str($name)] = sum(retval > 0 ? retval : 0);
delete(@kiocb[tid]);
}
kretprobe:sock_write_iter
/@kiocb[tid] && ($1 == 0 || ($1 != 0 && pid == $1))/
{
$file = ((struct kiocb *)@kiocb[tid])->ki_filp;
$name = $file->f_path.dentry->d_name.name;
@io[comm, pid, "write", str($name)] = count();
@bytes[comm, pid, "write", str($name)] = sum(retval > 0 ? retval : 0);
delete(@kiocb[tid]);
}
END
{
clear(@kiocb);
}
I can see five Netty threads called server-io-x and every thread stands for one event-loop. Every event-loop has one connected client and the application broadcasts the randomly generated string message to all connected clients using Websocket protocol.
@bytes — a sum of read/written bytes
@io — a number of read/write operation in total (1 read message stands for Websocket handshake)
xxxxxxxxxx
./socketio-pid.bt 27069
Attaching 6 probes...
Socket READS/WRITES and transmitted bytes, PID: 27069
^C
@bytes[server-io-3, 27069, read, TCPv6]: 292
@bytes[server-io-4, 27069, read, TCPv6]: 292
@bytes[server-io-0, 27069, read, TCPv6]: 292
@bytes[server-io-2, 27069, read, TCPv6]: 292
@bytes[server-io-1, 27069, read, TCPv6]: 292
@bytes[server-io-3, 27069, write, TCPv6]: 1252746
@bytes[server-io-1, 27069, write, TCPv6]: 1252746
@bytes[server-io-0, 27069, write, TCPv6]: 1252746
@bytes[server-io-4, 27069, write, TCPv6]: 1252746
@bytes[server-io-2, 27069, write, TCPv6]: 1252746
@io[server-io-3, 27069, read, TCPv6]: 1
@io[server-io-4, 27069, read, TCPv6]: 1
@io[server-io-0, 27069, read, TCPv6]: 1
@io[server-io-2, 27069, read, TCPv6]: 1
@io[server-io-1, 27069, read, TCPv6]: 1
@io[server-io-3, 27069, write, TCPv6]: 1371
@io[server-io-1, 27069, write, TCPv6]: 1371
@io[server-io-0, 27069, write, TCPv6]: 1371
@io[server-io-4, 27069, write, TCPv6]: 1371
@io[server-io-2, 27069, write, TCPv6]: 1371
Principle 5: Balance Between Throughput and Latency
If you think about application performance, you very likely end up with a trade-off between throughput and latency. This trade-off is involved in all programming areas, a well-known example in the JVM area is Garbage Collector: Do you want to focus on throughput with ParallelGC in some batch application or do you need to low-latency mostly concurrent GC such as ShenandoahGC or ZGC?
However, in this part, I'm going to focus on a different type of trade-off that can be driven by our application or framework based on Netty. Let's assume we have WebSocket Server that pushes messages to connected clients. Do we really need to send a particular message as soon as possible? Or it's possible to wait a bit longer and let create a batch of five messages and send them together?
Netty actually supports a flush mechanism that perfectly covers this use-case. Let's say we decided to use batching to amortize syscalls to 20 percent and sacrifice latency in favor of the overall throughput.
Please check out my JFR Netty Socket Example, make the changes below:
pbouda.jfr.sockets.netty.server.SlowConsumerDisconnectHandler:
- we need to comment out flushing of every message and use simple write instead
- write method does not automatically write data into the socket, it waits for a flush context.writeAndFlush(obj) -> context.write(obj)
xxxxxxxxxx
pbouda.jfr.sockets.netty.Start#main
- uncomment the section at the end of the method `Flush a bulk of 5 messages`
If you install Java 14, which includes the Java Flight Recorder Streaming feature, then you can see what Netty actually does in this case.
xxxxxxxxxx
Broadcaster-Server 2020-01-14 22:12:00,937 [client-nioEventLoopGroup-0] INFO p.j.s.n.c.WebSocketClientHandler - Received message: my-message (10 bytes)
Broadcaster-Server 2020-01-14 22:12:00,937 [client-nioEventLoopGroup-0] INFO p.j.s.n.c.WebSocketClientHandler - Received message: my-message (10 bytes)
Broadcaster-Server 2020-01-14 22:12:00,938 [client-nioEventLoopGroup-0] INFO p.j.s.n.c.WebSocketClientHandler - Received message: my-message (10 bytes)
Broadcaster-Server 2020-01-14 22:12:00,938 [client-nioEventLoopGroup-0] INFO p.j.s.n.c.WebSocketClientHandler - Received message: my-message (10 bytes)
Broadcaster-Server 2020-01-14 22:12:00,939 [client-nioEventLoopGroup-0] INFO p.j.s.n.c.WebSocketClientHandler - Received message: my-message (10 bytes)
jdk.SocketWrite {
startTime = 22:12:01.603
duration = 2.23 ms
host = ""
address = "127.0.0.1"
port = 42556
bytesWritten = 60 bytes
eventThread = "server-nioEventLoopGroup-1" (javaThreadId = 27)
stackTrace = [
sun.nio.ch.SocketChannelImpl.write(ByteBuffer[], int, int) line: 167
io.netty.channel.socket.nio.NioSocketChannel.doWrite(ChannelOutboundBuffer) line: 420
io.netty.channel.AbstractChannel$AbstractUnsafe.flush0() line: 931
io.netty.channel.nio.AbstractNioChannel$AbstractNioUnsafe.flush0() line: 354
io.netty.channel.AbstractChannel$AbstractUnsafe.flush() line: 898
...
]
}
jdk.SocketRead {
startTime = 22:12:01.605
duration = 0.0757 ms
host = ""
address = "127.0.0.1"
port = 8080
timeout = 0 s
bytesRead = 60 bytes
endOfStream = false
eventThread = "client-nioEventLoopGroup-0" (javaThreadId = 26)
stackTrace = [
sun.nio.ch.SocketChannelImpl.read(ByteBuffer) line: 73
io.netty.buffer.PooledByteBuf.setBytes(int, ScatteringByteChannel, int) line: 247
io.netty.buffer.AbstractByteBuf.writeBytes(ScatteringByteChannel, int) line: 1147
io.netty.channel.socket.nio.NioSocketChannel.doReadBytes(ByteBuf) line: 347
io.netty.channel.nio.AbstractNioByteChannel$NioByteUnsafe.read() line: 148
...
]
}
The connected client received five messages but we can see only one socket-read and socket-write and both contain all bytes for the entire batch of messages.
If you want to learn more about the Java Flight Recorder, read my article Digging Into Sockets With Java Flight Recorder.
Principle 6: Keep up With New Trends and Keep Experimenting
In this part, I would like very briefly introduce two concepts that are currently being very discussed and becoming considerable options to handle a big number of clients/requests, even if they are not clearly connected to solving the C10K problem, but it can definitely help you with your overall architecture of single node application or a group of services handling some bigger load.
GraalVM Native-Image to Save Resources
GraalVM currently works on the ahead-of-time compiler that is able to run executable along with newly growing called SubstrateVM. In a nutshell, it means that Graal Compiler is used at the build-time to generate machine code without any profiling data. You can ask: How can this help us to beat C10K problem if we surely generate less efficient machine code than we could generate with the just-in-time compiler? The answer is: NO! It won't help you out!
However, it will generate a self-contained minimalistic binary file without any unused classes/methods, internal structures such as JIT data structures, no profiling, dynamic code cache, much simpler GC, and GC's and structures.
Those optimizations above ensure that we are able to run our application with a much lower footprint and even if the application has less efficient code, we can end up with a better ratio between consumed memory and the overall number of processed requests than in case of JIT. This means we are able to deploy multiple instances of this application and it might provide even better throughput for fewer resources.
This is just an idea, we always need to measure. Target platforms for native-image are serverless providers where we need to deploy small apps with a lower footprint and very small startup-time.
Project Loom Comes to Eliminate our Pain From Blocking Calls
You have probably heard about fibers/green threads/goroutines. All those terms stand for one concept. They want to avoid a thread scheduling in kernel-space and move this responsibility to user-space, at least partially. A typical example of this is that we have a lot of blocking calls, every our request to the application ends up in JDBC/HTTP/.. call and we need to block our current java thread (that is mapped one-to-one to kernel thread) and waits until response gets back.
Those applications have to end up with a lot of threads to scale the request processing and how we've already discussed this is not efficient at all. However, we can use Fibers from Project Loom instead. It ensures that the blocking call does not actually block the java thread but only the current fiber. Therefore, we can schedule a new fiber on the current running java and then get back to the original fiber when the blocking call is done. The result of this is that we are able to handle all requests even with the very limited number of java threads because emitting fibers is "almost" for free (hundreds of bytes to handle execution context and very quick initialization), at least in comparison to a real Java Thread.
This is still in progress and Fibers haven't been merged to mainline yet, but it's an incredibly promising feature for fixing legacy code full of JDBC invocation.
Summary
Trying to beat the C10K problem is mainly about resource efficiency. Code that is absolutely OK with tens/hundreds of parallel users can very badly fail when we start accepting thousands of concurrent connections.
It's absolutely OK to say that this application is not intended to be developed for so big number of connections and we can avoid the complexity of advanced features for saving every byte in your memory. But it always good to be aware of it and start designing our high-throughput application from the ground up if we need to handle a lot of clients.
Thank you for reading my article and please leave comments below. If you would like to be notified about new posts, then start following me on Twitter!
Further Reading
Recommend
About Joyk
Aggregate valuable and interesting links.
Joyk means Joy of geeK