
44

GitHub - facebookresearch/hiplot: HiPlot makes understanding high dimensional da...
source link: https://github.com/facebookresearch/hiplot
Go to the source link to view the article. You can view the picture content, updated content and better typesetting reading experience. If the link is broken, please click the button below to view the snapshot at that time.
README.md
HiPlot - High dimensional Interactive Plotting 
![]()
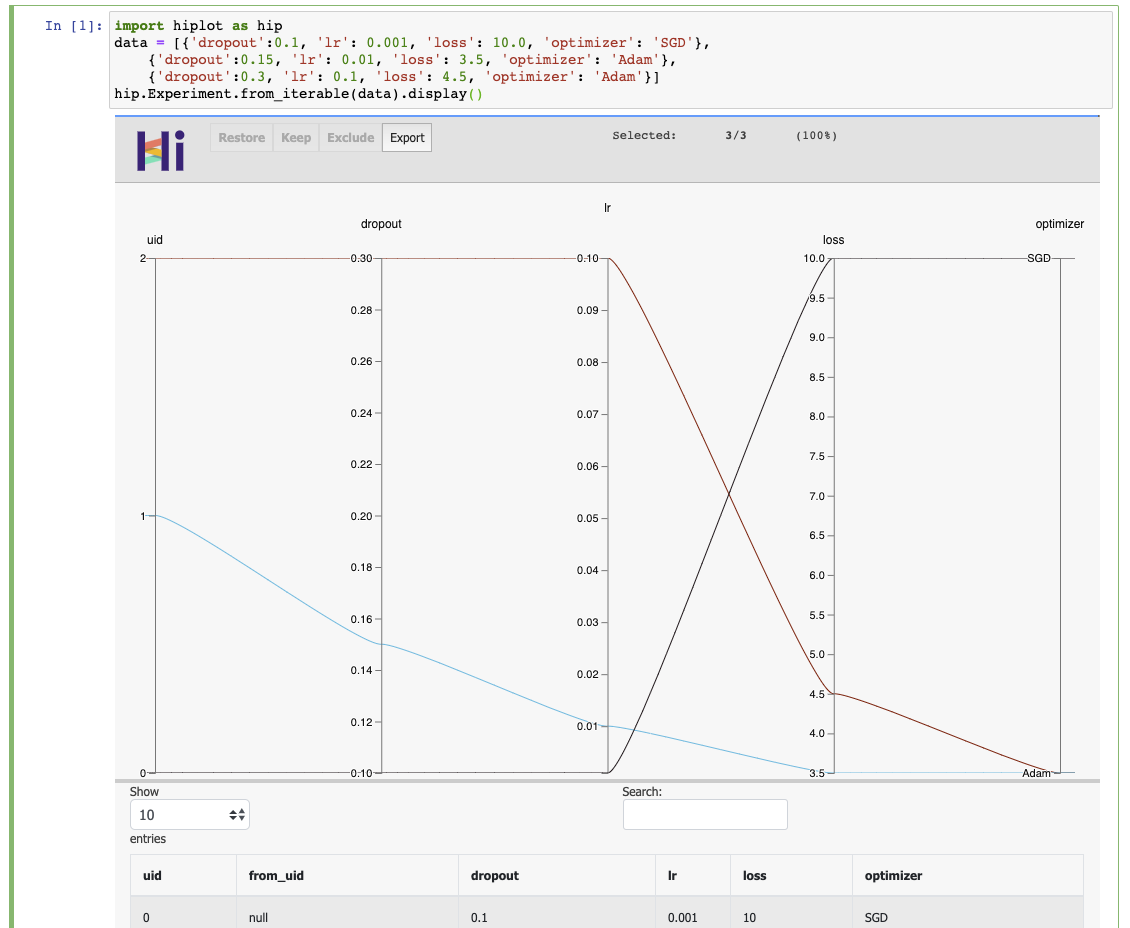
HiPlot is a lightweight interactive visualization tool to help AI researchers discover correlations and patterns in high-dimensional data using parallel plots and other graphical ways to represent information.
Try a demo now
There are 2 modes to HiPlot:
- As a web-server (if your data is a CSV for instance)
- In a jupyter notebook (to visualize python data)
pip install hiplot
If you have a jupyter notebook, you can get started with something as simple as:
import hiplot as hip
data = [{'dropout':0.1, 'lr': 0.001, 'loss': 10.0, 'optimizer': 'SGD'},
        {'dropout':0.15, 'lr': 0.01, 'loss': 3.5, 'optimizer': 'Adam'},
        {'dropout':0.3, 'lr': 0.1, 'loss': 4.5, 'optimizer': 'Adam'}]
hip.Experiment.from_iterable(data).display()
See the live result
Links
- Documentation: https://facebookresearch.github.io/hiplot/index.html
- Pypi package: https://pypi.org/project/hiplot/
- NPM package: https://www.npmjs.com/package/hiplot
License
Recommend
About Joyk
Aggregate valuable and interesting links.
Joyk means Joy of geeK