
14

grafana+zabbix监控-李佳良的博客
source link: https://blog.51cto.com/13555423/2464589
Go to the source link to view the article. You can view the picture content, updated content and better typesetting reading experience. If the link is broken, please click the button below to view the snapshot at that time.
grafana+zabbix监控
下载grafana包
wget https://s3-us-west-2.amazonaws.com/grafana-releases/release/grafana-5.2.4-1.x86_64.rpm
yum安装
yum localinstall grafana-5.2.4-1.x86_64.rpm
启动grafana服务
systemctl start grafana-server
查看grafana服务
ps -ef |grep grafana
查看3000端口
netstat -plnt |grep 3000
安装grafana-zabbix插件
grafana-cli plugins install alexanderzobnin-zabbix-app
安装完grafana-zabbix插件必须重新启动
systemctl restart grafana-server.service
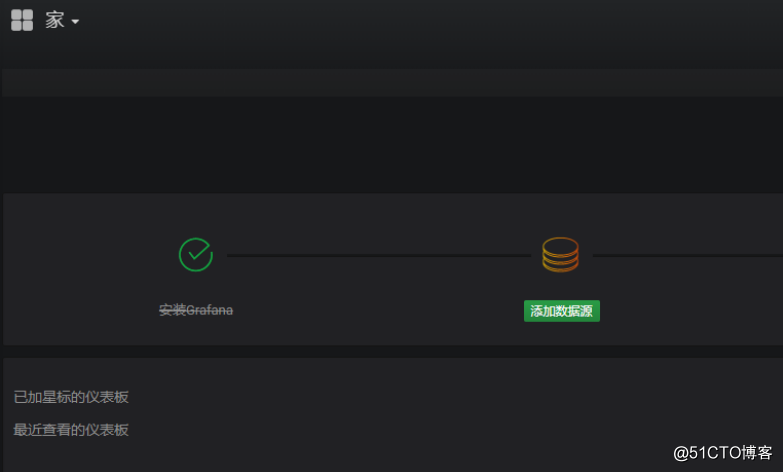
直接访问IP:3000即可访问
默认账号密码都是admin直接登陆
点击添加数据源
Zabbix的API地址为
http://172.16.8.69/zabbix/api_jsonrpc.php
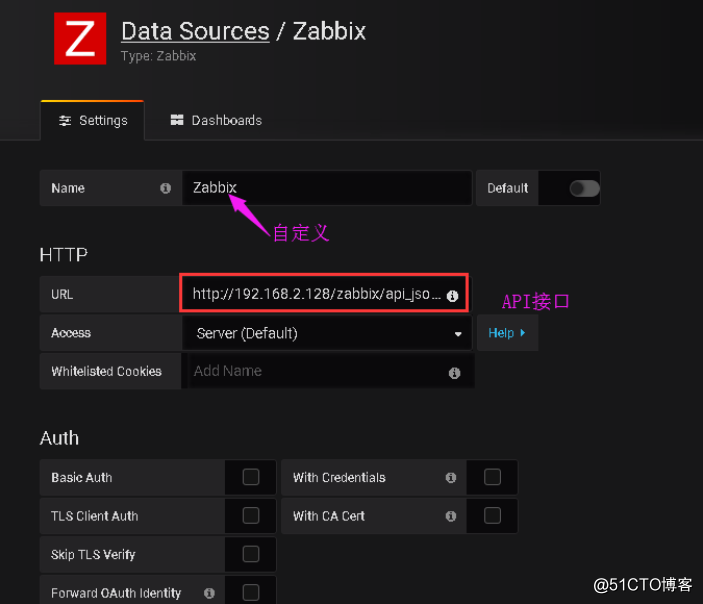
用户秘密为zabbix的密码
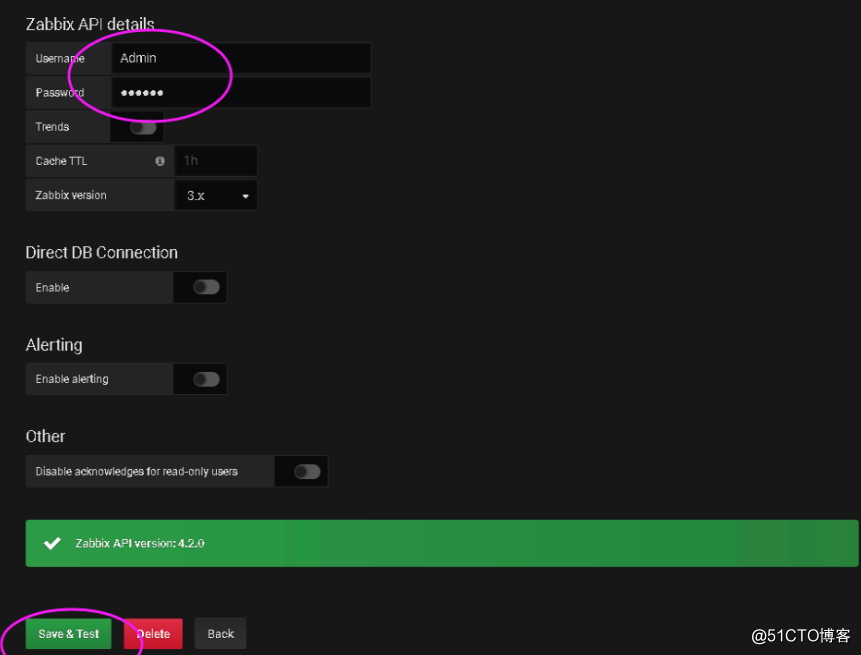
保存测试成功即可
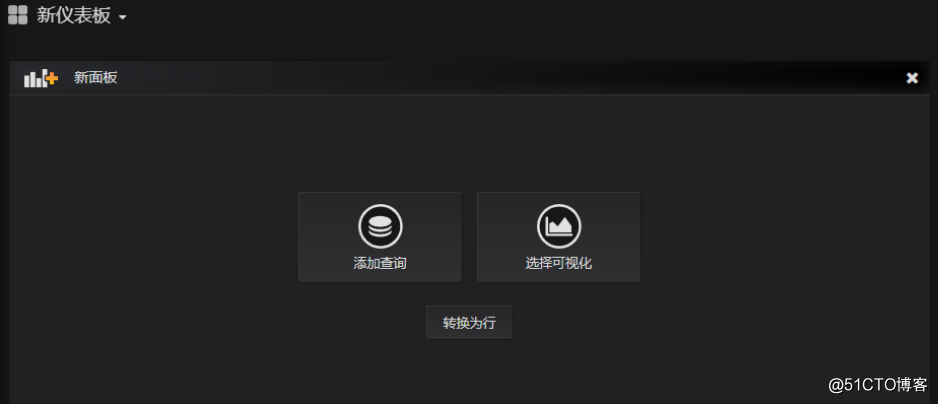
创建仪表盘
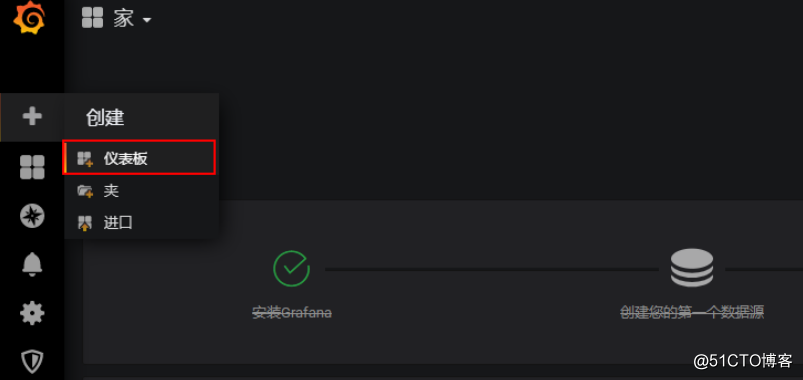
点击添加查询
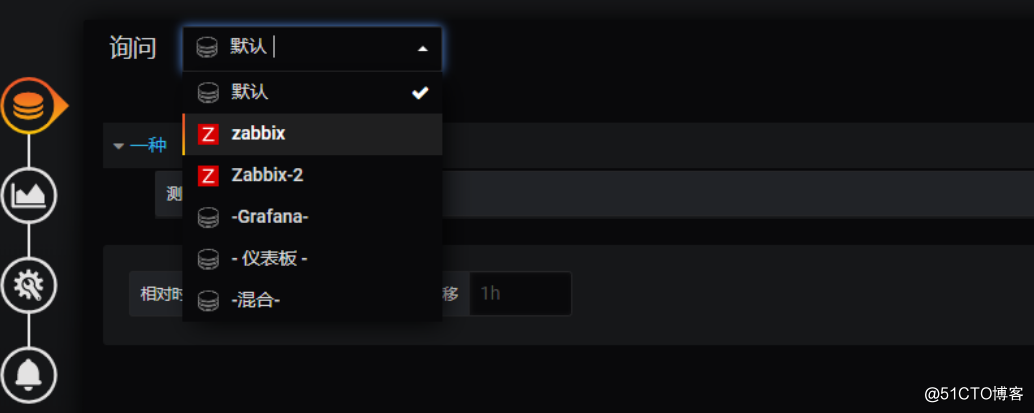
选择刚刚添加的zabbix
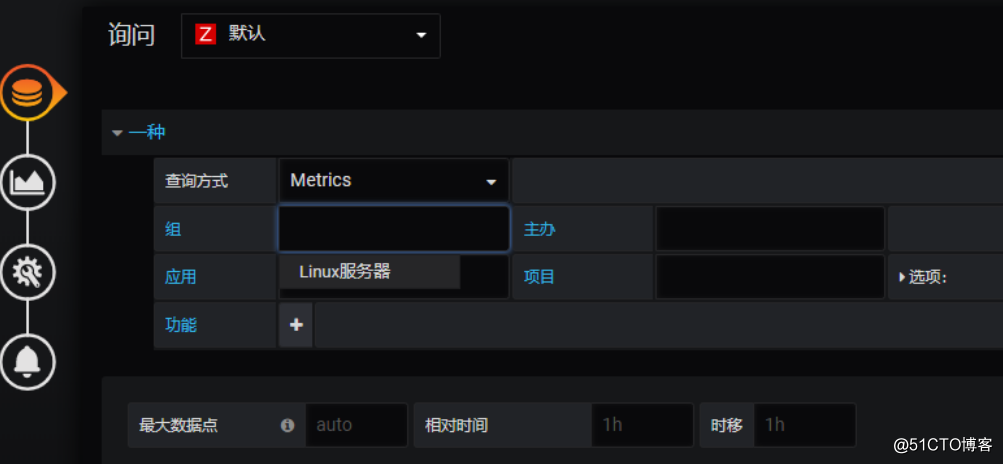
点击空白处进行添加
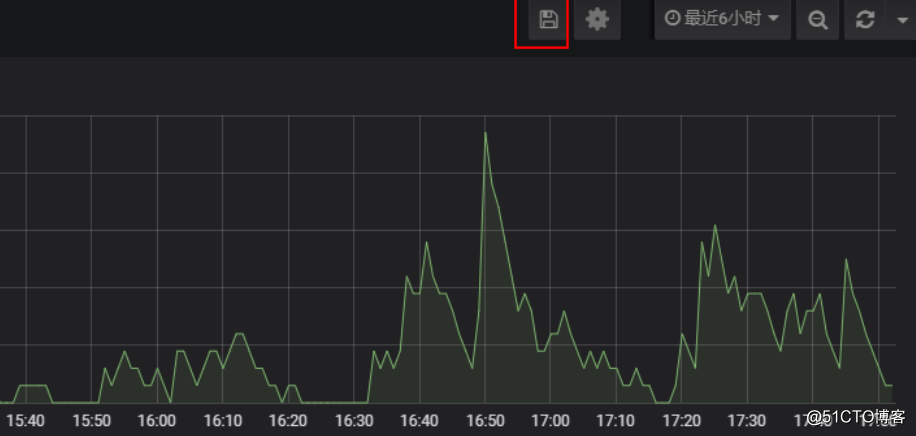
添加好对应选项会出现走势图
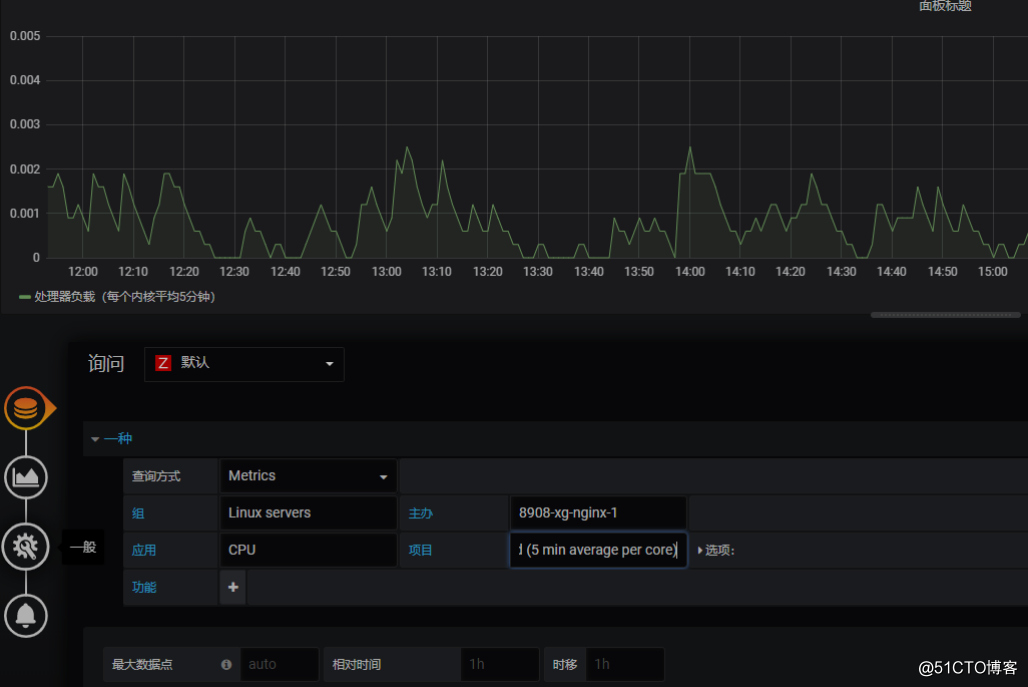
设置面板标题
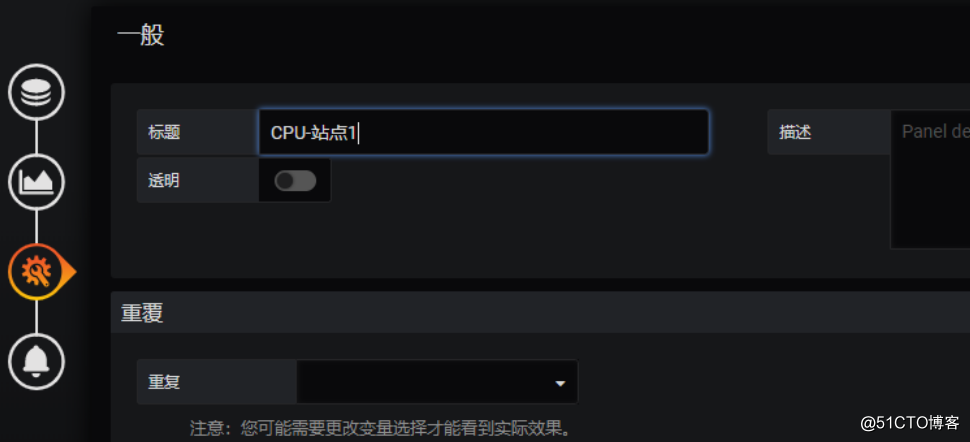
设置好后点击保存,名字为空即可因为不会保存
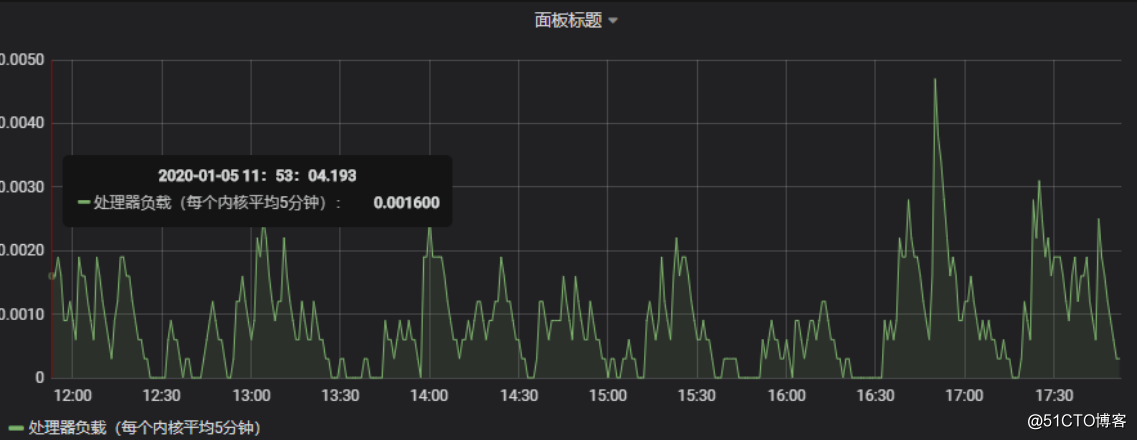
设置好的监控
Recommend
About Joyk
Aggregate valuable and interesting links.
Joyk means Joy of geeK