

GitHub - mgartner/pg_flame: A flamegraph generator for Postgres EXPLAIN ANALYZE...
source link: https://github.com/mgartner/pg_flame
Go to the source link to view the article. You can view the picture content, updated content and better typesetting reading experience. If the link is broken, please click the button below to view the snapshot at that time.
README.md
pg_flame 
A flamegraph generator for Postgres EXPLAIN ANALYZE output.
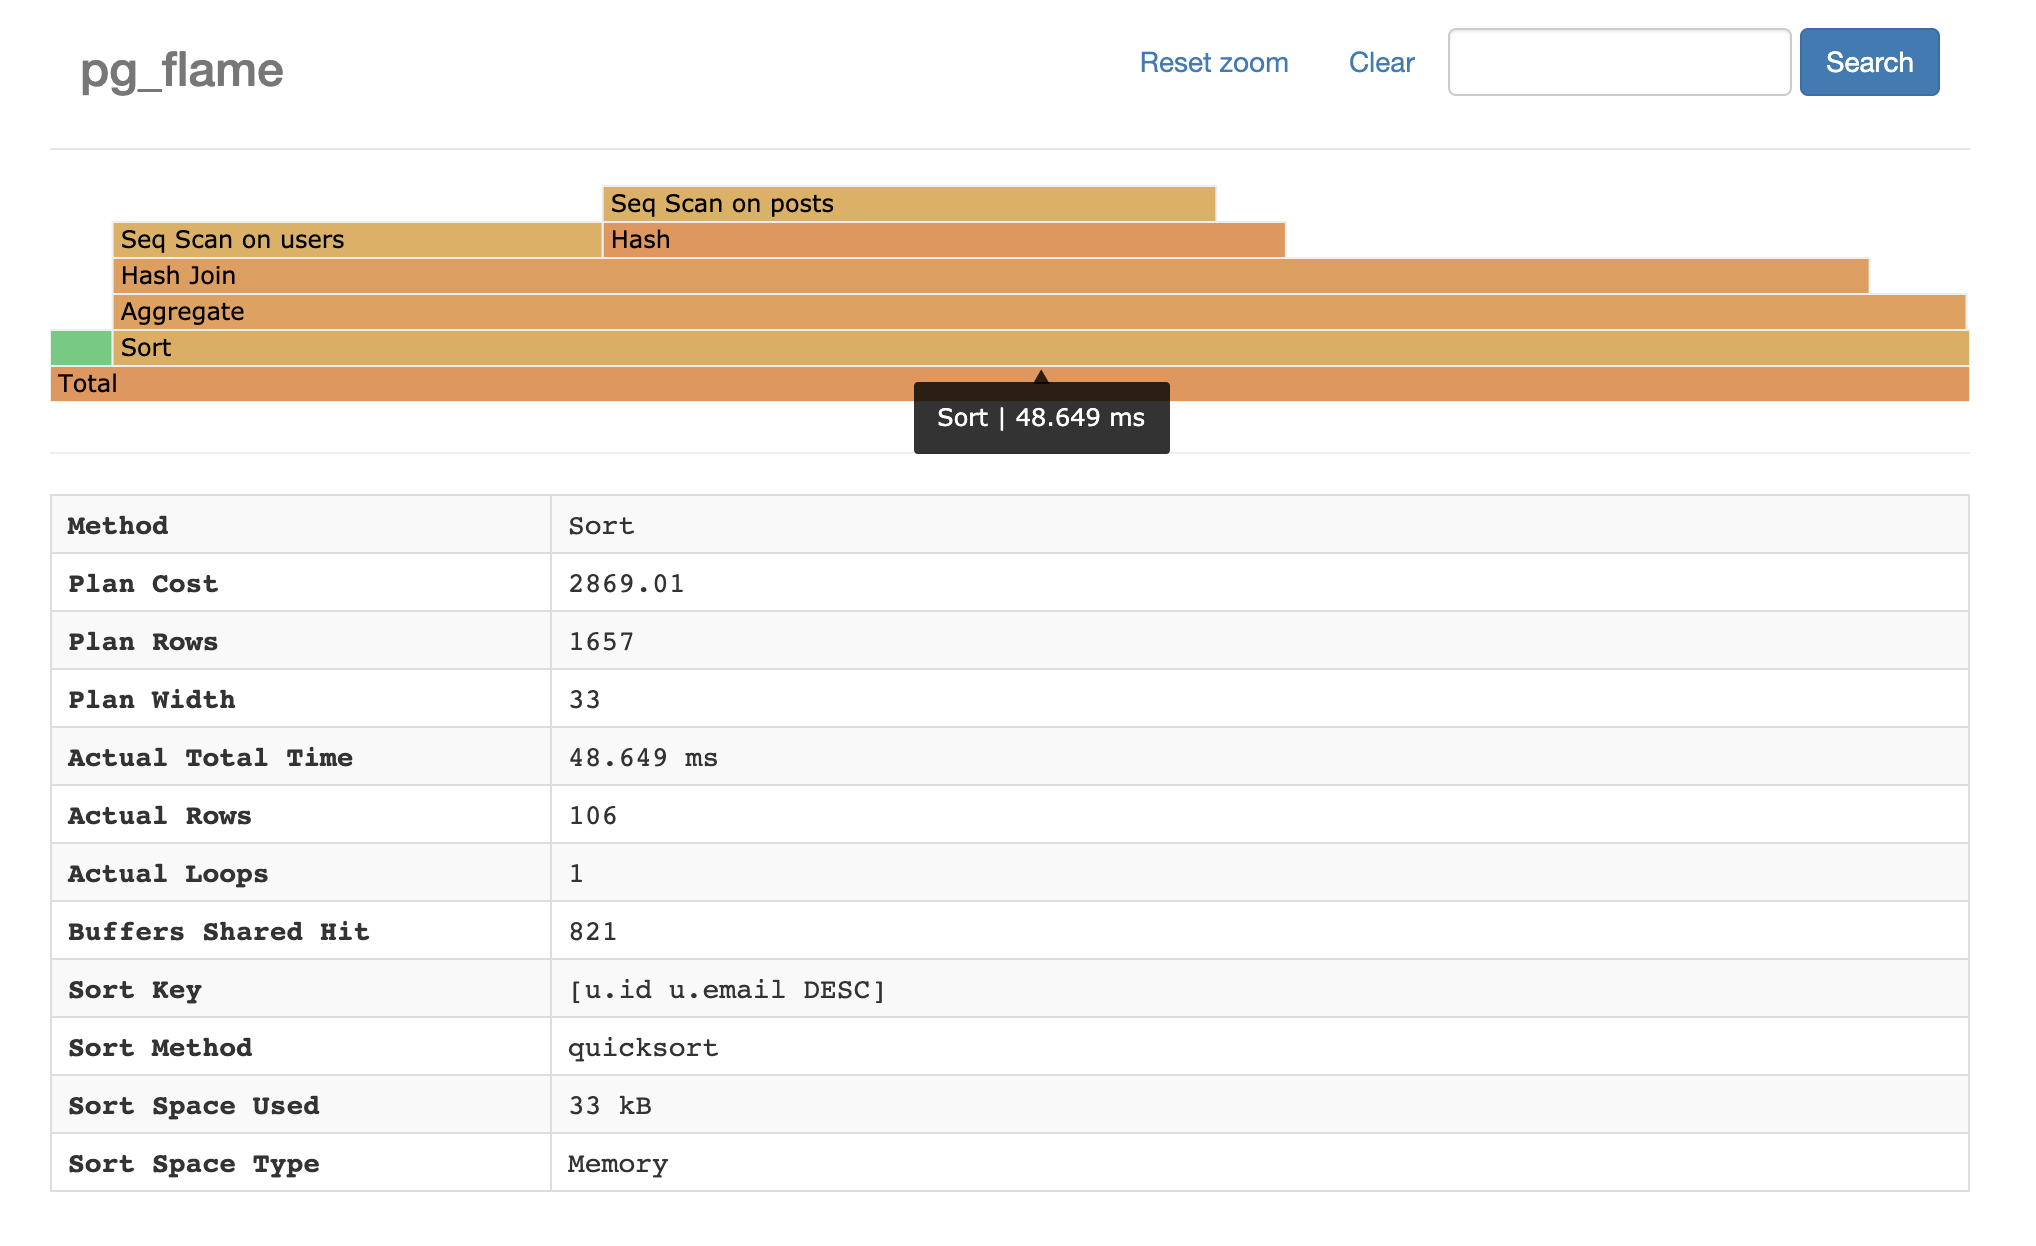
Demo
Try the demo here.
Installation
Download one of the compiled binaries in the releases tab.
If you'd like to build a binary from the source code, run the following commands. Note that compiling requires Go version 1.13+.
git clone https://github.com/mgartner/pg_flame.git
cd pg_flame
go build
Usage
- Generate a query plan in JSON by prefixing a SQL query with
EXPLAIN (ANALYZE, BUFFERS, FORMAT JSON). Save the output to a file. Example query plan JSON can be found here.
Example:
psql lob_local -qAtc 'EXPLAIN (ANALYZE, BUFFERS, FORMAT JSON) SELECT id FROM users' > plan.json
- Then generate the flamegraph by passing the JSON as standard input to
pg_flameand direct standard output to a file.
Example:
cat plan.json | ./pg_flame > flamegraph.html
- Open
flamegraph.htmlin a browser of your choice.
Background
Flamegraphs were invented by Brendan Gregg to visualize CPU consumption per code-path of profiled software. They are useful visualization tools in many types of performance investigations. Flamegraphs have been used to visualize Oracle database query plans and query executions , proving useful for debugging slow database queries.
Pg_flame is in extension of that work for Postgres query plans. It generates a visual hierarchy of query plans. This visualization identifies the relative time of each part of a query plan.
This tool relies on the
spiermar/d3-flame-graph plugin to
generate the flamegraph.
Recommend
About Joyk
Aggregate valuable and interesting links.
Joyk means Joy of geeK