

Introducing MapStats.io - Martin Malinda - Medium
source link: https://medium.com/@martinmalinda/introducing-mapstats-io-8c0cec7aeb68?source=activity---post_recommended
Go to the source link to view the article. You can view the picture content, updated content and better typesetting reading experience. If the link is broken, please click the button below to view the snapshot at that time.
Responses
Hi! Statistics are better visualized, and if we’re dealing with countries, it makes the most sense to visualize the data on a map. MapStats.io allows doing that in the quickest and easiest way possible.

MapStats.io is free and it doesn’t require signing up for you to create a map.
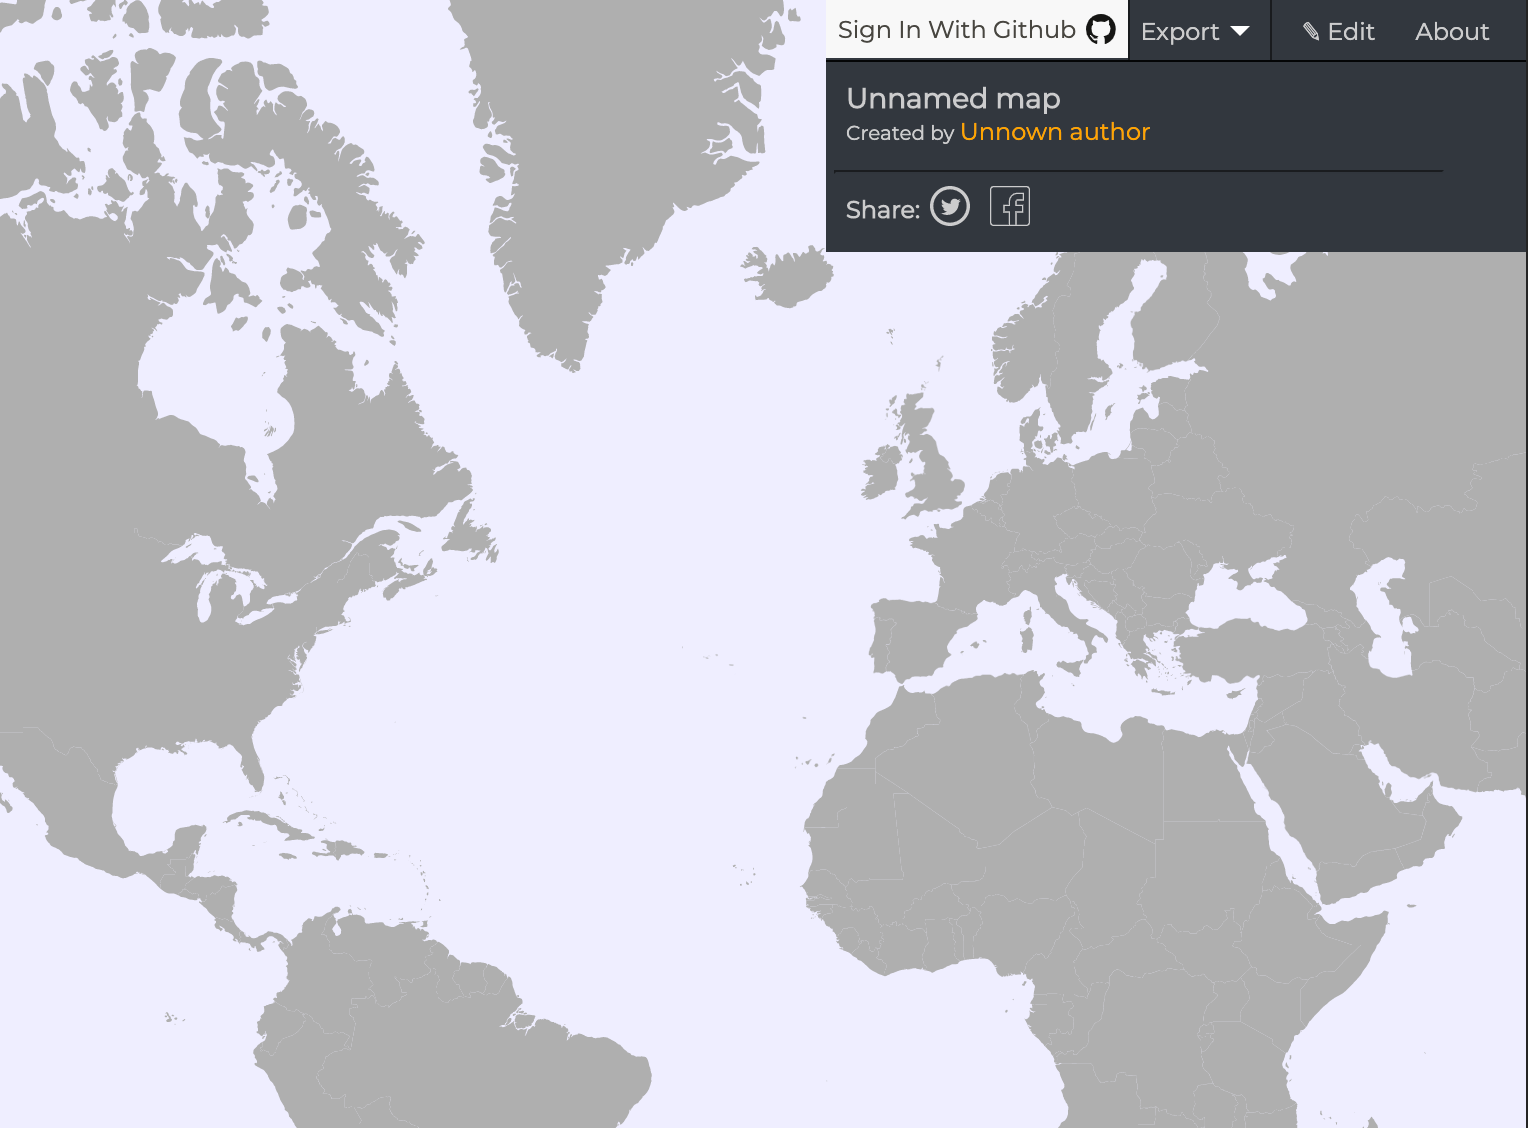
If you visit mapstats.io, you’ll be presented with a blank canvas:

You can click edit and add a new field:

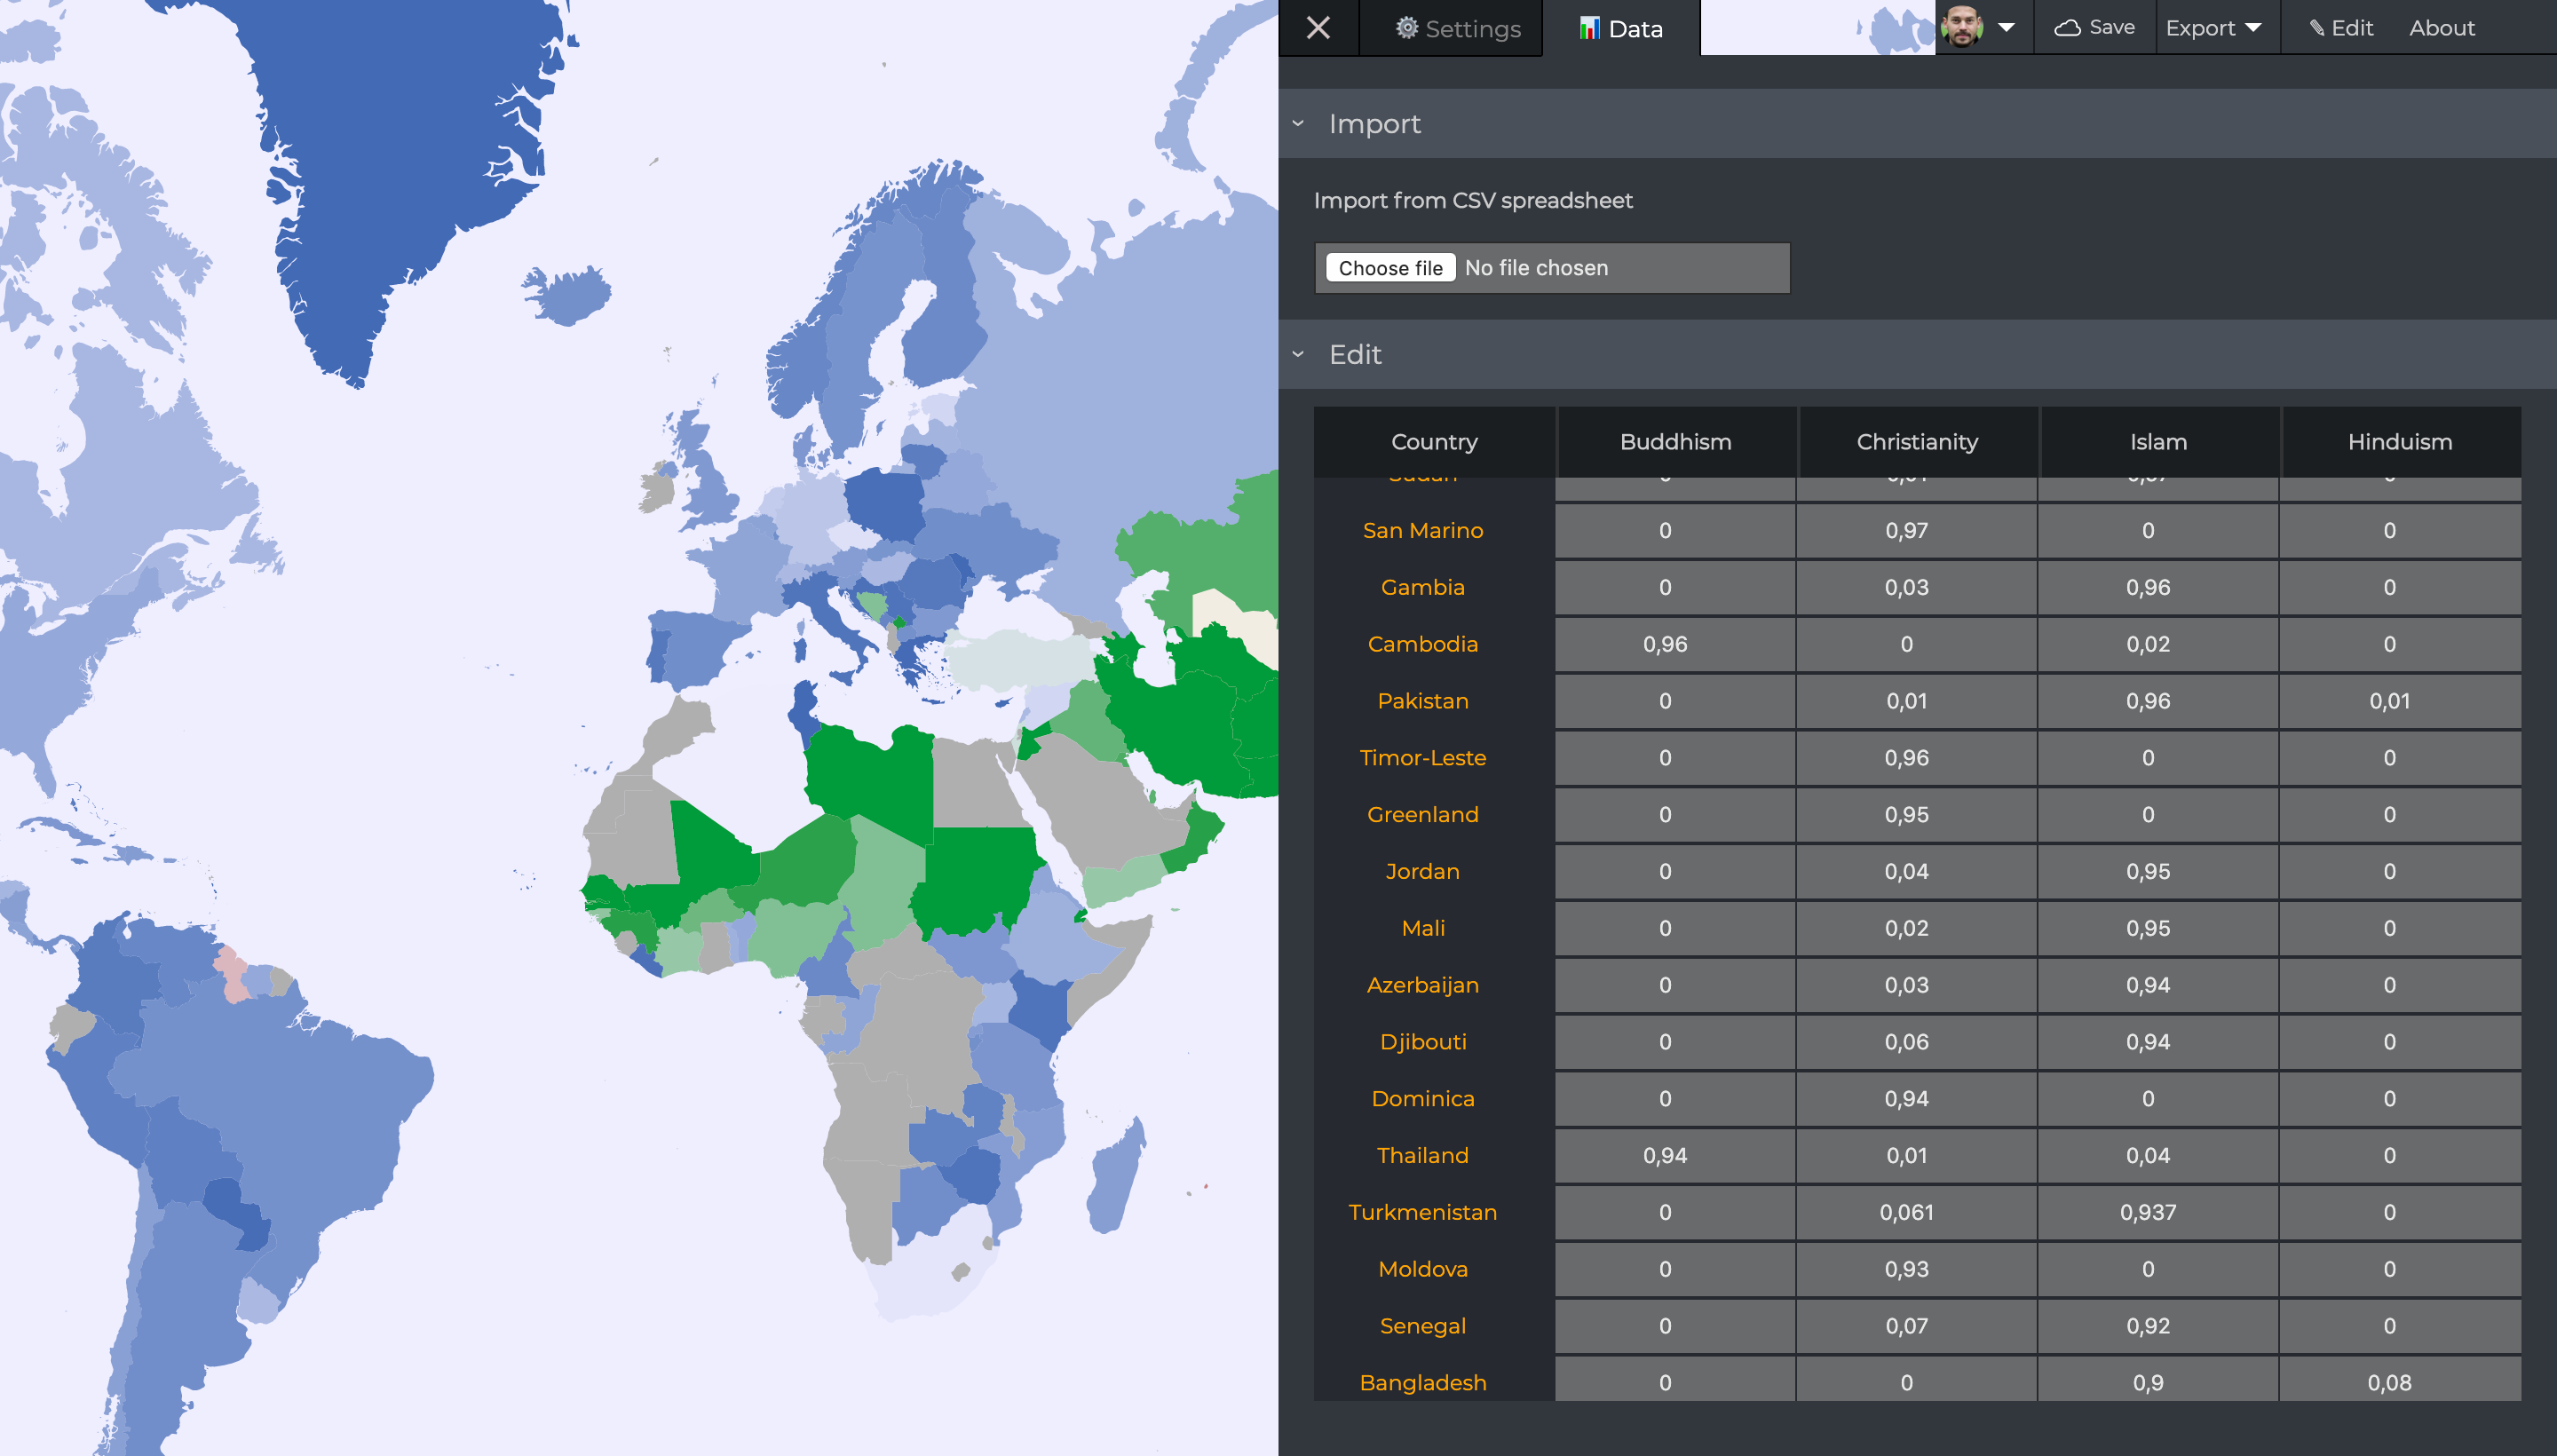
Afterward, you can switch to Data and start filling out information:

Alternatively, you can export right away as CSV:

And then, fill the data in a spreadsheet software of choice and then import it back in the data panel:

After you’re done you can export your data. Most likely to an SVG image, but you can also choose JSON or CSV. SVG can easily be converted to PNG or JPG image formats.
Most likely it’s best to save the data to the cloud though. You can save your map to Github hosting service. After you log in to your Github account, you can save your map.

After your map is saved, the URL in your browser changes and you get a shareable link, like this one: https://mapstats.io/map/gist-dc095762962779ac285cb6a137207da2
Map can then further be changed and saved again. Github will track your changes. And you can see the revision history in a JSON format:

That’s all for now! I could present a few other features — multiple field maps, setting a global max, percentage and description formats, but that might be done in a separate article.
Thanks for reading! If you’re interested, please follow MapStats on twitter to get notified about further changes:
You can also subscribe to me here on Medium. Most likely I’ll inform about further MapStats.io changes here too.
Thanks!
Recommend
About Joyk
Aggregate valuable and interesting links.
Joyk means Joy of geeK