

P-Value In Action: Is It Safe to Say That Parallax Correction Really Improve The...
source link: https://www.tuicool.com/articles/aQbaqif
Go to the source link to view the article. You can view the picture content, updated content and better typesetting reading experience. If the link is broken, please click the button below to view the snapshot at that time.
P-Value In Action: Is It Safe to Say That Parallax Correction Really Improve The Accuracy of Satellite Rain Estimation Algorithm?
Aug 16 ·7min read

What really is p-value? It really takes a long time for me to figure out the concept of this value. From my experience, I believe the best method to understand about p-value is through a real example. So that’s why in this post, I will explain about p-value using a real example that I really want to prove. But before that, I will explain about another concept or theory that make a p-value is relevant, the null hypothesis and normal distribution . The concept of satellite rain estimation algorithm and parallax correction will be explained too.
Null Hypothesis
The null hypothesis is a hypothesis that implying that we are very skeptic about our assumption a.k.a being devil advocate . The antonym of the null hypothesis is an alternative hypothesis or the statement that our assumption is right. So, in this case, our null hypothesis is parallax correction don’t improve the accuracy of satellite rain estimation algorithm and the alternative hypothesis is in the other hand, parallax correction improve the accuracy of satellite rain estimation algorithm .
Normal Distribution
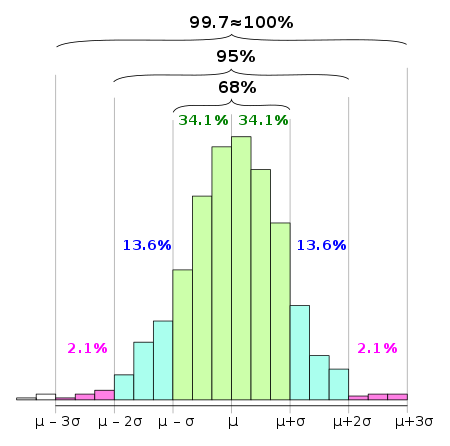
In my personal understanding, the normal distribution is the distribution that will happen normally in any normal condition . If we are gathering enough data, the histogram of the data will make a bell-like shape centered on the average of the data .

The normal distribution has 2 properties, mean (μ) and standard deviation (σ) . From an empirical experiment, if we take a very large data and make a histogram from it , it will show us that :
- About 68% of values fall within one standard deviation of the mean.
- About 95% of the values fall within two standard deviations from the mean.
- About 99.7% — fall within three standard deviations from the mean.

P-Value
In the normal distribution, beyond 3σ if you want to know the percentage of data lies there you can use this formula that its principle is taking into account the shape of the bell curve of the normal distribution:

And that is the definition of the p-value. In the normal distribution context, the p-value is just a portion of data that lies in the bell curve based on z-value . Z-value is a value of real data that has been rescaled in the standard deviation unit .

So, when you transform the data to z-value, the center of the bell curve is no longer the average of data but zero . Now we know the concept of the p-value but still little vague without the real example. Before we move on the real example, I will explain a little bit about the parallax correction of the satellite and satellite rain estimation algorithm.
Satellite Rain Estimation Algorithm
It’s a set of algorithms to estimate the rainfall that falls somewhere that within the scope weather satellite. A weather satellite is a satellite that captures EM wave from Earth in various frequency (all material that has a temperature above 0 Kelvin is actually radiating an EM in various frequency depend on the temperature of that material). The EM that radiated from the earth is the representation of the outer temperature of the earth. When the top of earth is a cloud, then the satellite actually captures the temperature of the cloud . But when there is no cloud, it will capture the temperature of land or sea (temperature of the cloud will be colder than land or sea).
The capabilities of a weather satellite that can capture of the cloud are used to estimating the rainfall below the cloud. One of the simplest rainfall estimation algorithm is called auto estimator. Based on this paper, we can estimate the amount of rainfall in a certain area based on this formula.
Where T is a temperature that captured by satellite, based on infrared channel .
Parallax Correction
Sketchily, to calculate the correction we need atmospheric lapse rate to estimate the height of the cloud, the position of cloud against satellite and slope angle of satellite that observes the cloud . Why we need parallax correction? Short answer, the curvature of the earth makes everything complicated and the cloud is not just some simple flat object, it’s has a height and these resulting everything becomes a little misplaced . Anyway, if you want to know more about parallax correction, you can check this reference (in Bahasa Indonesia). The author is my senior colleague in my workplace and he is very experienced about estimation algorithm of weather satellite and parallax correction. In fact, the part of my script later in the experiment to do parallax correction calculation is from him.
The Experiment
In this experiment, I will limit the scope of the satellite from an area to just 1 point. Because the verification of this experiment is using a rain gauge. Before the experiment begins, we must:
- Define the null hypothesis and that’s “ parallax correction don’t improve the accuracy of satellite rain estimation algorithm” and so the alternative hypothesis is “parallax correction improve the accuracy of satellite rain estimation algorithm”.
- Define the alpha value . The common alpha value is 0.05 and 0.01 but actually, it depends on your experiment. I don’t know if this right choice but in this experiment, I choose 0.05 .
The last and the most important but outside the obligation in carrying out the p-value test is how we do a calculation to determine if the estimation becomes better or worse after the correction. It simple, first we calculate the absolute value of the difference between the estimated value of the auto estimator and auto estimator after correction against rain gauge (the truth data). And then we do ‘auto estimator minus auto estimator after correction’ if the value is positive (>0) the estimated rainfall become better , otherwise, if the value is negative (<0) the estimation becomes worse .
In data science, raw data is always very ‘dirty’ and so my full set of scripts (for the cleansing and merging data) in this experiment is full of ‘magic number’ a.k.a a very conditional constant that exists just for the sake of this experiment. So here I just share an already cleansed data and the script to do an auto estimator calculation and it’s parallax correction.
You can download the ‘clean’ data here . Auto estimator and parallax correction script can be downloaded here . The input of the auto estimator and parallax script is the PGM data from Kochi university here . The instruction to download a batch data can be on their website too .
In the clean data that I already refer before, I already make all calculation that needed to get a z-value of 0 and that is 0.5779751399 . This value is far bigger than our alpha value. So the result is we can’t reject the null hypothesis . We cannot erase our doubts and it’s not safe to say parallax correction really improve the accuracy of auto estimator algorithm .
If we draw the z value of 0 and below based on the normal distribution, we will get a graph like below.

Here the script to make the graph above.
#!/usr/bin/python3from scipy.stats import norm
import numpy as np
import matplotlib.pyplot as plt
def draw_z_score(x, cond, mu, sigma, title):
 y = norm.pdf(x, mu, sigma)
 z = x[cond]
 plt.plot(x, y)
 plt.fill_between(z, 0, norm.pdf(z, mu, sigma))
 plt.title(title)
 plt.show()x = np.arange(-3,3,0.001)
z0 = 0.577975139913483
draw_z_score(x, x<z0, 0, 1, 'z<%s'%(str(z0)))
That’s the conclusion of the experiment. So what do you think? Is there an error in my script or assumption in the calculation parallax correction. I already refer the script to calculate the auto estimator and parallax correction before, you can read it and show to me if there is an error in the calculation.
reference:
https://www.statisticshowto.datasciencecentral.com/empirical-rule-2/ , accessed on 16 July 2019
https://www.statsdirect.com/help/distributions/normal.htm , accessed on 16 July 2019
https://goodcalculators.com/p-value-calculator/ , accessed on 16 July 2019
https://www.academia.edu/35505495/Teknis_Koreksi_Parallaks_Satelit_Himawari , accessed on 18 July 2019
http://weather.is.kochi-u.ac.jp/archive-e.html , accessed in 16 August 2019
Rani, Nurhastuti Anjar, Aulia Khoir, and Sausan Yulinda Afra. “Rainfall Estimation Using Auto-estimator Based On Cloud-Top Temperature Of Himawari 8 Satellite Compared To Rainfall Observation In Pangkalpinang Meteorological Station.” Proceeding of International Symposium for Sustainable Humanosphere . 2017.
Recommend
About Joyk
Aggregate valuable and interesting links.
Joyk means Joy of geeK