

MySQL Cluster Auto-Recovery
source link: https://www.tuicool.com/articles/hit/ENjEFvj
Go to the source link to view the article. You can view the picture content, updated content and better typesetting reading experience. If the link is broken, please click the button below to view the snapshot at that time.
MySQL8 Cluster and Networking Problems
Category :security
This is my second post on the topic of reliable MySQL8 cluster. Hopefully the last one as things look much brighter now.
In my previous post about MySQL8 and building an InnoDB cluster , I’ve described the overall design of the KeyChest backend. This has been running well for a couple of weeks till a network unreliability caused a collapse.
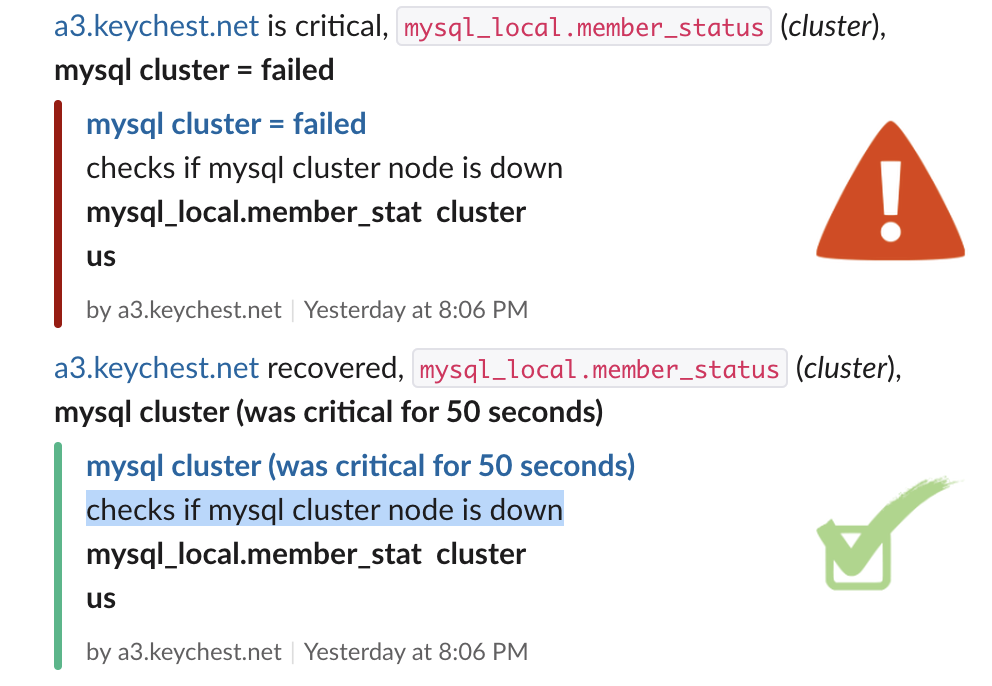 Successful test of node failure notification in Slack
I have been yet again forced to look even deeper than last time into the underlying issues causing KeyChest crashes. The logs showed that cluster nodes kept losing connection with other nodes and were “kicked out”.
Search For The Cause
I could focus the search for the cause of MySQL cluster instability thanks to Netdata . This monitoring system has been constantly showing a large percentage of dropped packets on a public interface of one of the cluster nodes. I didn’t think too much about it at first as the warning was for a public network interface, which was not used by KeyChest. As such, I assumed the problem could simply be linked to the firewall.
This time, I took the issue more seriously and used a couple of tools (well, I tried most of the diagnostics from this comprehensive tutorial (tuning Linux networking stack) – available for Centos7. Netstat showed dropped RX packets – interestingly on public as well as private NICs.
Iface             MTU    RX-OK RX-ERR RX-DRP RX-OVR    TX-OK ...
 eth0             1500    95892      0   3825 0         80290
 eth1             1500 24108079      0   3825 0      23952080
 lo              65536 22389898      0      0 0      22389898
Another glance at netstat data showed a pretty high softirq number and when I zoomed on squeezed out packets, it showed continuously non-zero values.
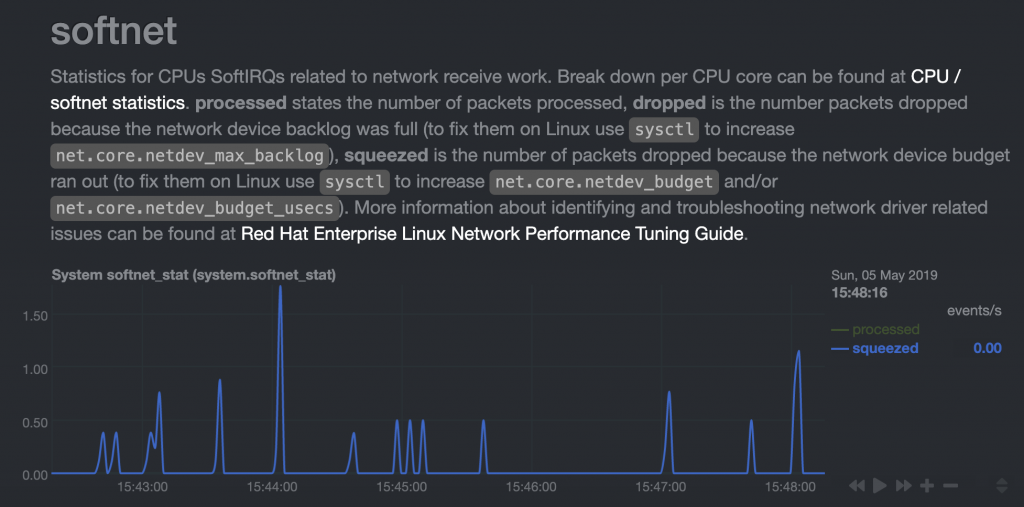 Running out of netdev budget – some RX packets are not processed.
Software interrupts (softirqs) was another symptom that didn’t disappear even when I increased the default value of net.core.netdev_budget with sysctl. I have also used the perf tool and sent stack locations where packets were lost to the DigitalOcean support as they meant very little to me.
To cut the story short, I had to accept that there is nothing I can do with the networking issues and there are likely to be significant “bursts” of dropped packets that will cause disconnection of our MySQL8 cluster nodes.
So we know there is very likely an infrastructure problem. The question is, can we mitigate it on the application layer?
MySQL Tuning
The first thing was to adjust sysctl values related to networking – as the MySQL cluster is fairly utilised, with a limit of 500 connections, it was worth reviewing file handle and network-related values – net.core.somaxconn, net.core.netdev_max_backlog, net.core.rmem*, net.core.wmem*, etc.
The next step was to look into the configuration of MySQL for replication – https://dev.mysql.com/doc/refman/8.0/en/group-replication-options.html.
What’s interesting are changes of default values in 8.0.x versions of MySQL. For example –
group_replication_exit_state_action
has changed from ABORT to READ_ONLY. A change, which impacted KeyChest.
The most interesting change – in version 8.0.16 – was introduction of
group_replication_autorejoin_tries
, which enables automatic reconnections of nodes that disconnected from a cluster.
The next step was to upgrade from 8.0.15 to 8.0.16 – this guide from MySQL – https://dev.mysql.com/doc/refman/8.0/en/linux-installation-yum-repo.html shows how to add MySQL8 to the local yum repos so you can start simply upgrading with “yum update”.
Note: You don’t have to do mysql_upgrade from version 8.0.16 as it’s done as part of the package update.
While the upgrade with yum was smooth, it turned out that mysqlrouter stopped working. For some reason it was not able to read its configuration file any more. After a number of bootstrapping attempts, as simple reinstallation of mysqlrouter did the trick:
- yum remove mysql-router-community
- yum install mysql-router-community
- systemctl disable mysqlrouter
- systemctl enable mysqlrouter
- systemctl start mysqlrouter
- systemctl status mysqlrouter
We finally got to the state where we started – database worked. The last stop was adding a new parameter to /etc/my.cnf – our effective configuration file for MySQL:
group_replication_autorejoin_tries=2
When I checked log files in the morning – I could see the following set of records:
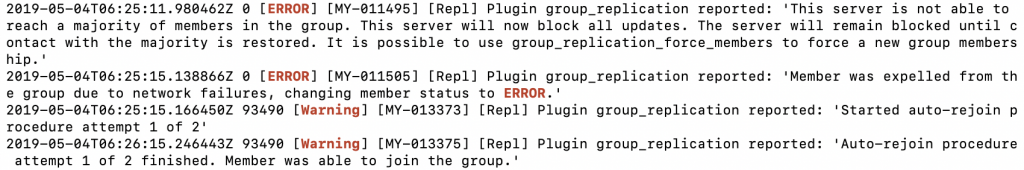 “This server is not able to reach a majority of members in the group.” -> “Started auto-rejoin procedure attempt 1 of 2”.
Auto-rejoin worked, hurray!
Monitoring
Still, it’s not a bad idea to know when this happens. While I asked the netdata community to add new metrics for MySQL8 cluster as the existing replication collector doesn’t work for the cluster ( GET SLAVE STATUS doesn’t return any data).
As I really like the netdata took, I wanted to give it a shot and see if I can add some useful metrics myself. The first step was to find out which MySQL command returns useful data. The winner is:
SELECT * from performance_schema.replication_group_members;
It returns the following set of useful information that can be used for alerts and dashboards:
*************************** 1. row ***************************
CHANNEL_NAME: group_replication_applier
MEMBER_ID: 45079783-9385-11e8-9706-1605ec76d48e
MEMBER_HOST: a2
MEMBER_PORT: 3306
MEMBER_STATE: ONLINE
MEMBER_ROLE: PRIMARY
MEMBER_VERSION: 8.0.16
*************************** 2. row ***************************
CHANNEL_NAME: group_replication_applier
MEMBER_ID: 7d1dbd7b-5c44-11e9-8027-8ef83dffb8f9
MEMBER_HOST: a3
MEMBER_PORT: 3306
MEMBER_STATE: RECOVERING
MEMBER_ROLE: SECONDARY
MEMBER_VERSION: 8.0.16
*************************** 3. row ***************************
CHANNEL_NAME: group_replication_applier
MEMBER_ID: c66c22ce-5c46-11e9-b7de-1a4e03cb7ac2
MEMBER_HOST: a1
MEMBER_PORT: 3306
MEMBER_STATE: ONLINE
MEMBER_ROLE: SECONDARY
MEMBER_VERSION: 8.0.16
In terms of the netdata configuration, one has to add a SELECT privilege for the netdata user:
grant select on performance_schema.* to 'netdata'@'localhost';
I have then expanded two files:
- dashboard metrics – /usr/libexec/netdata/python.d/mysql.chart.py ; and
- alerts – /usr/lib/netdata/conf.d/health.d/mysql.conf
In the first one, I’ve added:
a new query into the Service definition
- QUERY_MEMBERS = ‘select * from performance_schema.replication_group_members;’
2 lines to GLOBAL_STATS:
- ‘Cluster_nodes_up’,
- ‘Cluster_nodes_down’,
1 line to ORDER array
- ‘member_status’,
the CHARTS dictionary:
- ‘member_status’: {
- ‘options’: [None, ‘Cluster nodes’, ‘nodes’, ‘cluster’, ‘mysql.member_status’, ‘stacked’],
- ‘lines’: [
- [‘Cluster_nodes_up’, ‘up’, ‘absolute’, 1, 1],
- [‘Cluster_nodes_down’, ‘down’, ‘absolute’, 1, 1]
- ]
- },
and a data extraction code from members
member_data = raw_data[‘members’][0]
- count_ok = 0
- count_all = 0
- for member_node in member_data:
- count_all += 1
- if member_node[5] == ‘PRIMARY’:
- pass
- if member_node[4] != ‘ONLINE’:
- if member_node[4] != ‘RECOVERING’:
- pass
- else:
- pass
- else:
- count_ok += 1
- to_netdata[‘Cluster_nodes_up’] = count_ok
- to_netdata[‘Cluster_nodes_down’] = count_all – count_ok
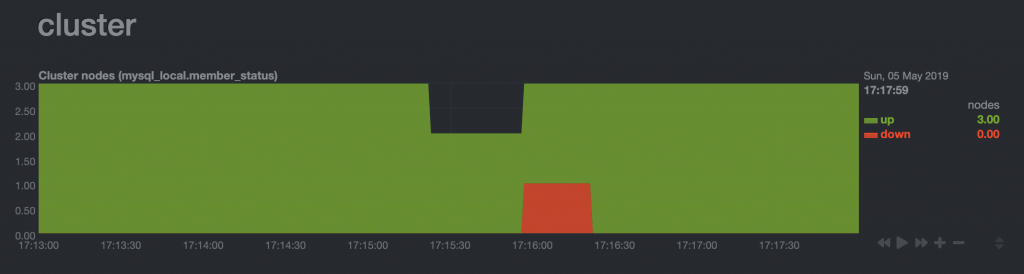 MySQL node restart – systemctl restart mysqld
And a small change of the health.d/mysql.conf file
- template: mysql_cluster
- on: mysql.member_status
- calc: ($down > 0)?0:1
- units: ok/failed
- every: 10s
- crit: $this == 0
- delay: up 1s down 1s multiplier 1.5
- info: checks if mysql cluster node is down
- to: dba
and we are getting Slack notifications whenever a node goes down and leaves the cluster.
Recommend
About Joyk
Aggregate valuable and interesting links.
Joyk means Joy of geeK