

Migrating to Unified Logging: Console and Instruments [FREE]
source link: https://www.tuicool.com/articles/hit/2eAjYfa
Go to the source link to view the article. You can view the picture content, updated content and better typesetting reading experience. If the link is broken, please click the button below to view the snapshot at that time.
iOS developers have plenty of logging solutions. Apple provides some, whereas others are by third-party frameworks. However, there’s a relatively new logging solution on the block that leaves the rest in the dust: Apple’s unified logging system .
The unified logging system has been Apple’s standard for logging since iOS 10. Announced at WWDC 2016 , it’s not that new. It comes with performance and privacy at the forefront. With unified logging, you can reduce the nasty side-effects of logging, maintain your user’s privacy and make debugging a breeze.
In this tutorial, you’ll convert an app’s old-fashioned print statements over to os_log and unleash the power of the unified logging system!
By the time you’re done with this tutorial, you’ll learn the purpose of unified logging and how to:
- Protect your users’ sensitive data inside your logs.
- Filter and categorize your log statements.
- View your logs in Console.
- Use signposts to debug performance issues.
Getting Started
To start off, download the sample project using the Download Materials button at the top or bottom of this tutorial. You’ll use a fun app from another great RayWenderlich tutorial , with some extra print statements sprinkled throughout the project.
The Chirper app is any bird watcher’s dream. Search for the name of the bird you’re interested in and the app searches a public database of recordings.

Open the project, run the app and take a look at the debug console output. You can see the logs printed in the output.

It’s a good start, but not enough if you want to be confident that your app is doing the right thing. The print statements are all mixed together, so you have no good way to figure out what’s really going on in your app. By changing them to os_log calls from the unified logging system, you’ll be able to tag debugging messages depending on the type of activity happening in the app and also avoid showing sensitive personal data.
Adding Log Statements
To get the privacy, organization and performance of the unified logging system, you need to convert the app’s logs from print statements to os_log , the heart of Apple’s unified logging system.
Start off by opening MainViewController.swift and adding this code to the top of the file:
import os
The os framework provides the tools you’ll need for tracing activity and logging operations to make diagnosing problems in your app easier.
Several times throughout this tutorial, you’ll need to find a particular piece of code in a file. You could scroll through the file and look with your eyes, but it’s much easier to open the Find dialog. When you type the name of a method, you’ll see the occurrences of text highlighted.
With your cursor blinking in the editor, press Command-F and type the code you want to find, in this case, update . Next, press return on your keyboard to iterate through the different occurrences until you locate the update(response:) method definition. It contains the first print statements you’ll convert.
Note : If you’re looking for a specific declaration, use Control-6 to use the jump bar to find the method or property in the current file. If you need to search for a method in the project, you can use Open Quickly — the keyboard shortcut is Command-Shift-O (the letter “O”).
The first line of the method is a print statement. Change it to use os_log like so:
os_log("Updating with network response.")
Build and run to start using the new code. Congratulations, you’re now using unified logging!

Great! So now you have your first log message using unified logging, but what good does this change do? To understand the benefits further, you’ll move on to using the Console app. Console is an app on your Mac that shows all the logged messages for your computer. You can view logs from the Simulator there, not only for your app.
Open the Console app via Spotlight. You can also find it in your Applications folder, inside Utilities .
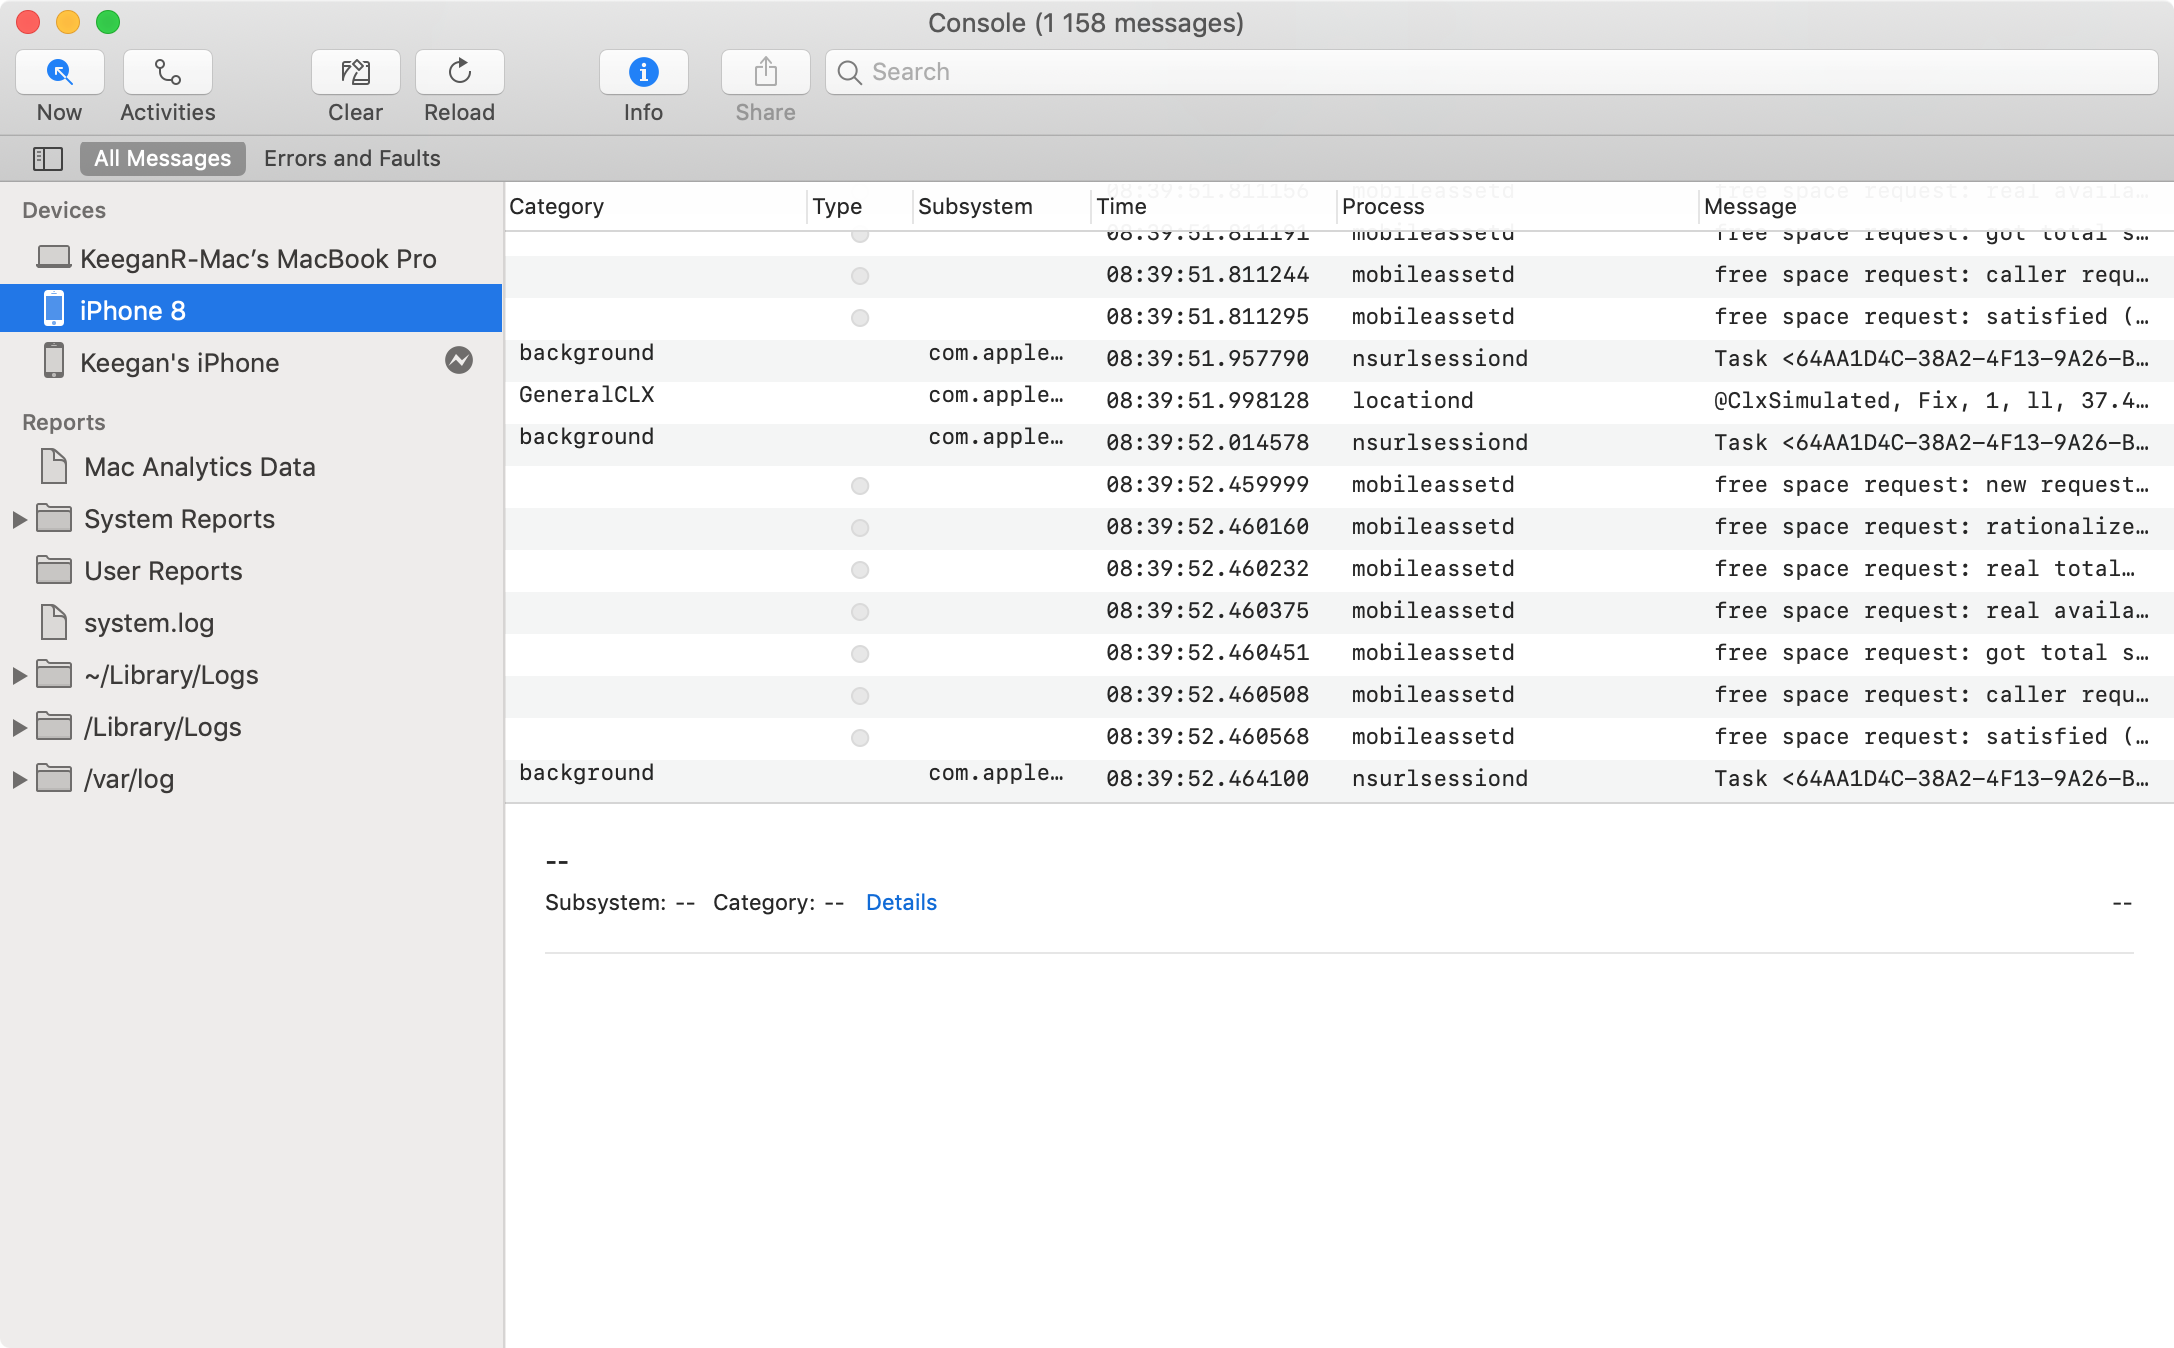
First, select the name of the iPhone simulator you’re using from the Devices pane on the left. Viewing a stream of log output can be overwhelming. At any given moment, your device is doing lots of work and you might lose track of your logs in the chaos.
Time to make it easier for you to keep track of your logs. Switch back to the Simulator. In Chirper, type rhea in the search box at the top and wait for the results to load:

Look at the Console app and your logs will look something like this:
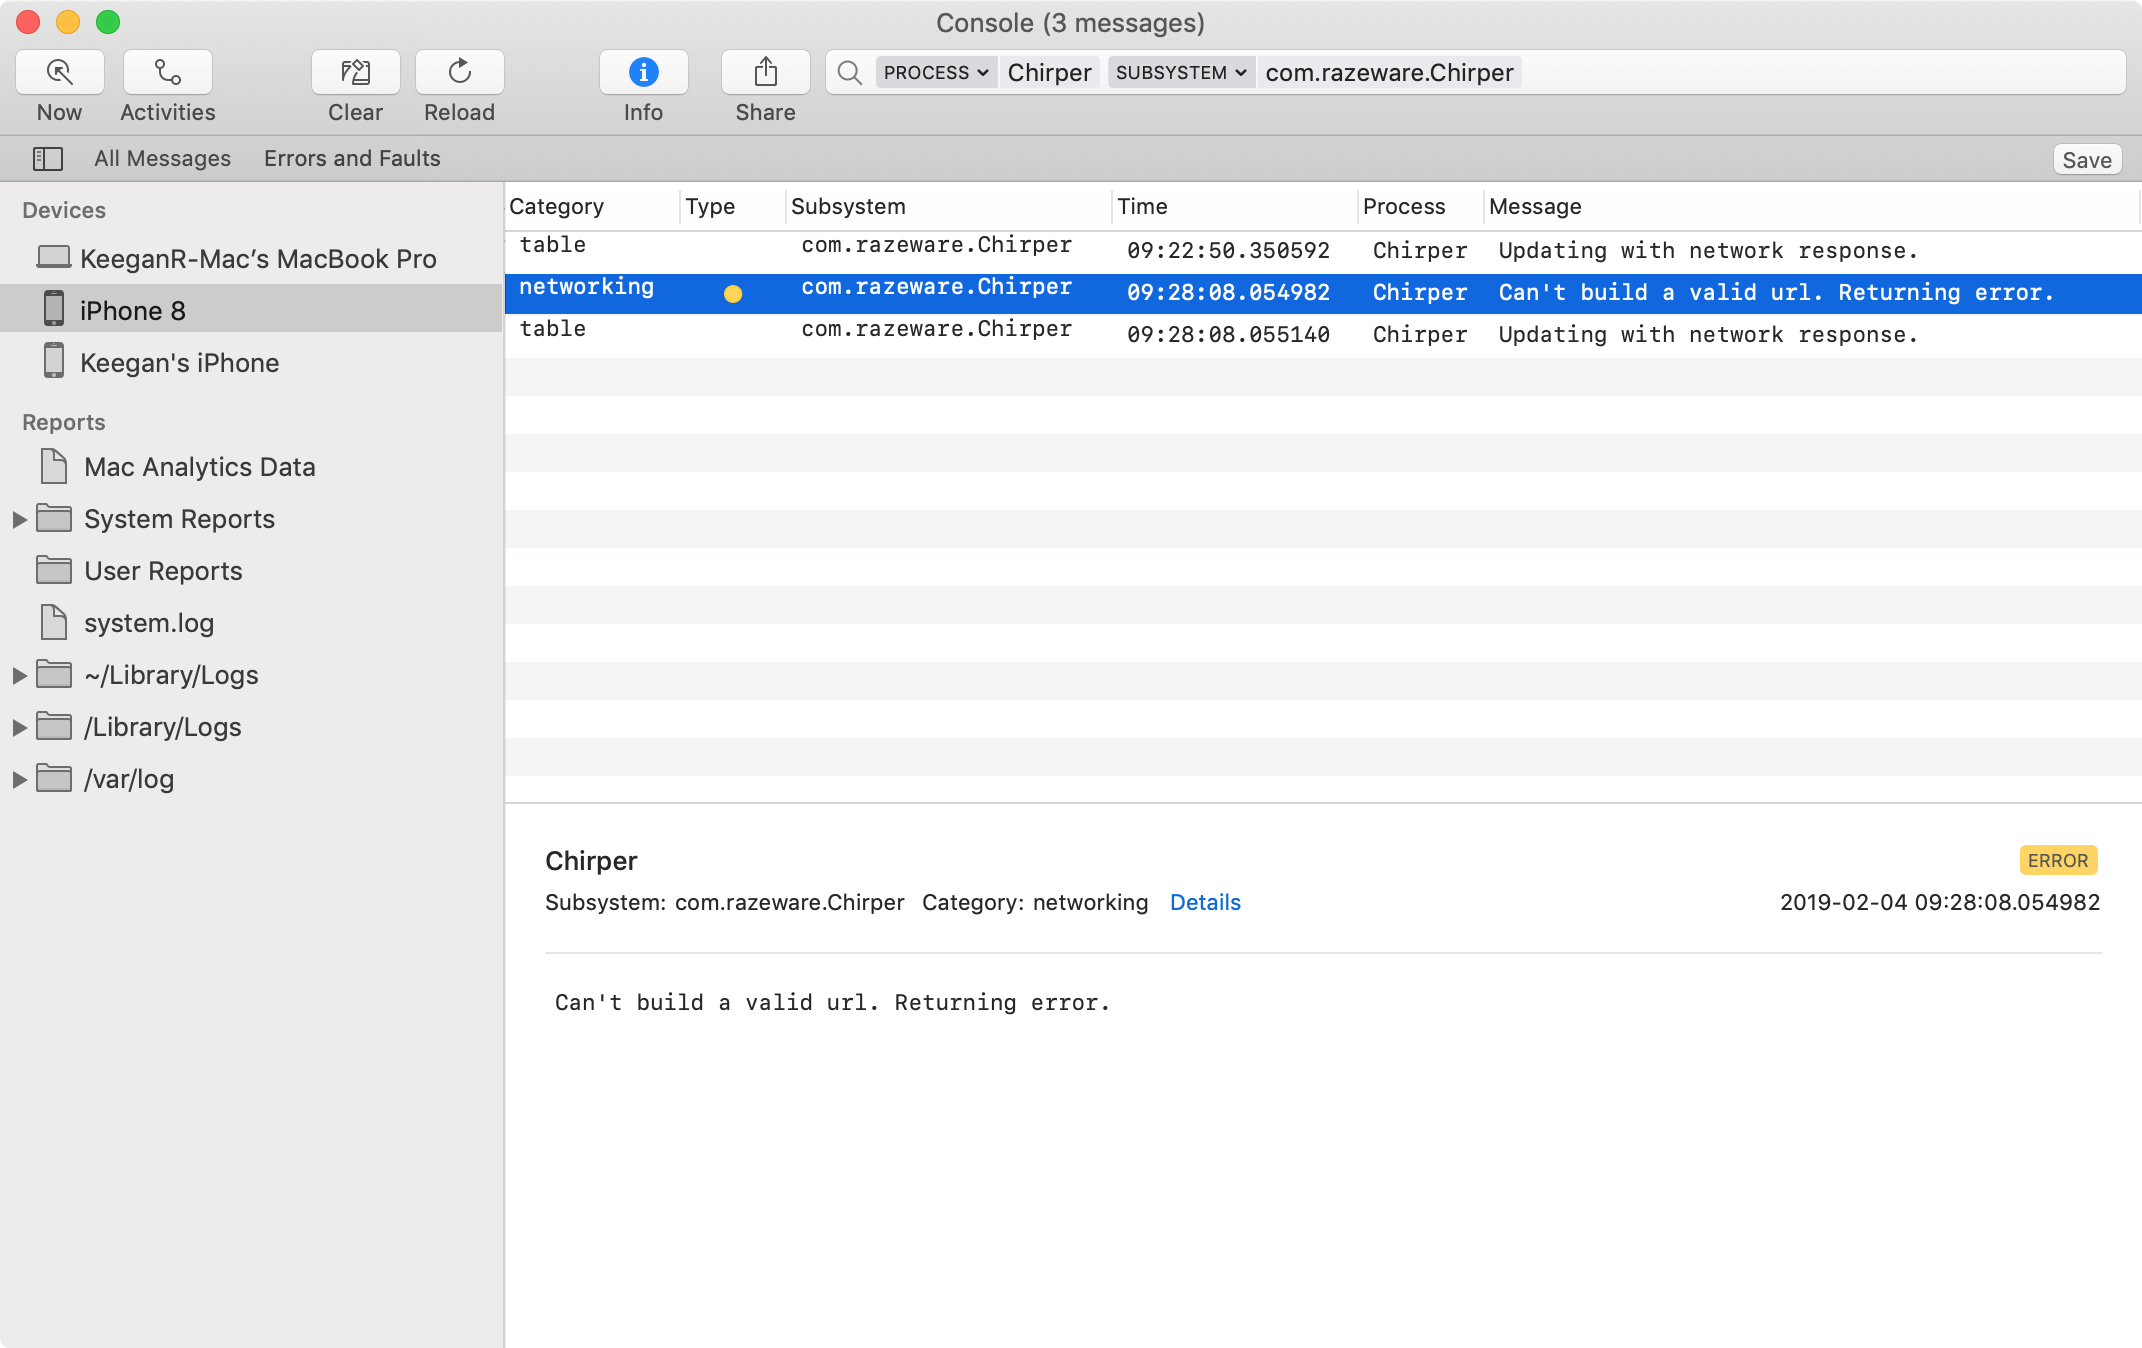
You need to find the log that you converted, so type Updating with network response in the search box in the upper right and press return on your keyboard:

You can remove a lot of the noise by filtering the results. Right click on the log statement and choose Show Process ‘Chirper’ . After that, remove the manual search criteria that you used before.

Your search bar should look like this now:

My console is still showing 426 messages. That’s a bit too much, but os_log can clean things up.
OSLog object
Each os_log statement uses an OSLog object. Your first os_log statement doesn’t specify an OSLog to use, so it uses a default shared OSLog . By using your own custom OSLog , you can specify the subsystem and category that your logs fall under.
You can usually think of the subsystem as your app and the category as the feature that the log statement falls under.
You’ll create your own OSLog objects to organize your logs. To start off, create a Swift file named Log.swift . Add the following to the end of the file:
import os

private let subsystem = "com.razeware.Chirper"

struct Log {
  static let table = OSLog(subsystem: subsystem, category: "table")
}
Log provides a namespace for the OSLog objects that you’ll use for your logging. For now, you only need one OSLog for the log statement you created earlier.
Next, open MainViewController.swift and swap out your new OSLog object for the os_log statement in update(response:) :
os_log("Updating with network response.", log: Log.table)
The log message is still the same, but you add the log: parameter at the end of the statement.
Then, with Console still open, build and run the app. Find your log statement in Console. If you can’t find it, search for Updating with network response again.
Once you’ve found it, right click the log and choose Show subsystem ‘com.razeware.Chirper’ :

Now your Console will only show the logs that you create under the com.razeware.Chirper subsystem. Very cool!
You can also right click on a log message and choose to filter by the category or any other identifying information to help you drill down into the logs.

Log Levels
As with any good logging system, unified logging comes with different log levels you can use to customize your logging behavior. The unified logging system can store logs either on disk or only in memory. You can also configure the output so that some log levels aren’t even shown at all.
There are five different log levels:
- Default : Use this level for standard log messages. The logging system stores these logs in memory and moves them to disk when it reaches a limit.
- Error : You use this level when something goes wrong in your app. The logging system always saves these logs to disk.
- Fault : This indicates that something has gone wrong on the system level, such as a device running out of storage. This level is always saved to disk.
- Info : Meant for capturing background information that might help during troubleshooting an issue, this level is not moved to disk immediately. A Fault-level log will cause Info-level logs to move to disk.
- Debug : Use this level for frequent and detailed logs when debugging an issue. This level isn’t meant for production code and will not show in any log output without a configuration change.
Note : You can change the default behavior of each log level. To learn more, read Apple’s official documentation on Customizing Logging Behavior While Debugging.
Specifying log levels
Your first os_log statement doesn’t specify any logging level, so it uses the default one. Next, you’ll add a log message with a different level. You’ll be stepping out of MainViewController.swift for the time being, so it’s a good idea to create a new OSLog object to keep things separate.
Open Log.swift . Add this to Log :
static let networking = OSLog(subsystem: subsystem, category: "networking")
Now you’re ready to add some logging to the networking layer of the app. Open NetworkingService.swift . Add this import statement to the top of the file so you can make use of os_log :
import os
Next, find this print statement in fetchRecordings(matching:page:onCompletion:) :
print("Can't build a valid URL. Returning error.")
That looks like a good case for error level logging. Replace this line with an os_log statement of the appropriate log level:
os_log("Can't build a valid URL. Returning error.",
  log: Log.networking, type: .error)
To see what the log looks like in Console, find the endpoint property of NetworkingService — this is a great time to use Control-6 — and change it to an invalid URL:
let endpoint = ">https://www.xeno-canto.org/api/2/recordings"
You’ve added the > to the beginning of the URL, making it invalid.
Build and run, then check Console for the new message:
Once you’re done exploring the logs, change the endpoint property of NetworkingService back:
let endpoint = "https://www.xeno-canto.org/api/2/recordings"
Now you’ve begun to understand how to test out different log messages.
Formatting StaticStrings
Still in NetworkingService.swift , find the following log message:
print("Successfully fetched \(count) recordings.")
This log message records the number of recordings fetched every time you get new results. It’s not a crucial piece of data and it might pollute the logs.
You can use the info type to easily filter it out of your log output. It also won’t save to disk unless a fault occurs, making your clients’ logs easier to read through.
Replace it with the following code:
os_log("Successfully fetched \(count) recordings.",
  log: Log.networking, type: .info)
Something isn’t right, though. You should see this error:

The os_log function doesn’t take a regular String for the log message. Instead, it requires the lesser known, but more performant, StaticString .
StaticString , as the name suggests, doesn’t support the string interpolation that you’re used to in Swift. You need to use some good old-fashioned format specifiers to put dynamic information into your log messages.
Note : To see all the available options for format specifiers, take a look at the documentation on String Format Specifiers .
Change your log statement to this:
os_log("Successfully fetched %d recordings.",
  log: Log.networking, type: .info, count)
Rather than using the string interpolation that is available in regular Swift strings, you use the %d format specifier and pass the count as the last parameter to os_log .
Console does not show info log messages by default, so open Console and ensure that the Action ▸ Include Info Messages menu item is ticked.
Build and run the app. Once the networking service loads the results, you should see a log message like this show up in Console:

Protecting Privacy
When you’re logging messages for a specific user’s activity inside your app, you should be extremely careful about accidentally logging personal or sensitive information about the user. Aside from the the basic trust between a developer and his users, it’s also bound to get you into trouble with the folks at Apple. ;]
While still in NetworkingService.swift , find the following print statement in fetchRecordings(matching:page:onCompletion:) :
print("Getting recordings from \(url)")
Next, convert it to an os_log statement.
os_log("Getting recordings from %s.", log: Log.networking,
  type: .info, url.absoluteString)
The type is set to info since it’s not crucial, but could be useful in case there’s a fault or error. You use the %s format specifier to pass the URL into the log statement.
One of the more interesting features on unified logging is that it’s private by default. If you run the app on a real device, not the simulator, without the Xcode debugger attached, any dynamic strings you log will be redacted like this:

Scalar values such as numbers are public, but any strings or objects are hidden. Great news for anyone that has logged a password to a log file by mistake. :]
When running the app on a simulator, or a device attached to Xcode’s debugger, your dynamic strings will not be publicly viewable. If you’re sure that a string does not contain any sensitive information, you can make it public by using the {public} keyword.
Update the log statement to make the URL public:
os_log("Getting recordings from %{public}s.", log: Log.networking,
  type: .info, url.absoluteString)
Now, the data you’re logging will always be visible in Console.

Note : Just as you can make a string or object public by using %{public} , you can make a number or boolean private by using %{private} .
Debugging With Signposts
os_log is a great tool for efficient logging in your app, but the unified logging system has another tool to help with debugging:
Signposts. Signposts are another logging mechanism that you can use to better visualize your code as it runs. They also work well for debugging performance.
A signpost is a type of log that can be visualized in Instruments . You can use it to see when a task begins and ends, as well as any other events related to the task.
You’ll use signposts to take a closer look at fetchRecordings(matching:page:onCompletion:) . First, you’ll need to create a Signpost ID that will help Instruments identify the signpost. At the top of fetchRecordings(matching:page:onCompletion:) , add this line:
let signpostID = OSSignpostID(log: Log.networking)
Next, create your first signpost after the end of the guard block that starts with guard let url = components?.url . Immediately after guard statement, add this code:
os_signpost(.begin,
  log: Log.networking,
  name: "Fetch recordings",
  signpostID: signpostID,
  "%@",
  url.absoluteString)
The Structure of a Signpost
os_signpost takes six parameters:
- Type : The type of signpost call. This call marks the start of your signpost, so you use
.begin. - Log : Same as
os_log, you pass anOSLogobject to help categorize your signposts. - Name : The name helps Instruments group together signpost events. As a bonus, it makes things easier for you to read as well. :]
- Signpost ID : While not necessary if you have unique names for your signposts, the Signpost ID is a cleaner way to identify your signposts.
- Log Message : Along with the signpost event, you can provide a log message with any other important info.
- Format Arguments : These provide any arguments for format strings in your log message.
In life, when there’s a beginning, there must be an end. Your signposts are the same, in that sense. :] So, you’ll need to fire os_signpost with a .end event when the app has finished fetching the recordings to fully utilize the power of signposts in this method.
fetchRecordings(matching:page:onCompletion:) fires a completion handler when it has finished. You’ll need to add the signpost event just before firing the onCompletion closure. In the nested fireErrorCompletion(_:) function, find the line that fires the completion handler:
.
onCompletion(RecordingsResult(
  recordings: nil,
  error: error,
  currentPage: 0,
  pageCount: 0))
Add a new signpost event immediately before it:
os_signpost(.end,
  log: Log.networking,
  name: "Fetch recordings",
  signpostID: signpostID,
  "%@",
  error?.localizedDescription ?? "No error")
This signpost event is similar to the one you created earlier: It uses the same name and the same signpost ID so Instruments will group them together. It fires if fetchRecordings(matching:page:onCompletion:) finishes with an error. The event type is set to .end to indicate the end of the event and you pass the error into the format string to have it show up in Instruments.
You still need to add a signpost event when the recordings are successfully fetched. Look for this line that passes the results to the completion handler:
onCompletion(recordingsResult)
Immediately before that, add a new signpost event:
os_signpost(.end,
  log: Log.networking,
  name: "Fetch recordings",
  signpostID: signpostID,
  "Fetched %d recordings with %d pages remaining.",
  count,
  result.numPages)
And that’s it! You’re ready to look at the signposts in Instruments.
Viewing Signposts in Instruments
First, from Xcode, open Instruments by pressing Command-I on your keyboard, or go to Product ► Profile . It is important to use this method so Xcode builds the app and launches Instruments with the process already attached to it.

Next, choose the Blank document type.
Then, click + at the top right to add an instrument. Search for the os_signpost instrument and double-click the item to add it:

Now click ◯ at the top left to start recording. Play around in the Chirper app in the Simulator. Perform a search and page through the results.
When you’re finished playing around with the app, click ▢ at the top left of Instruments to stop the recording. You should see something like this:

You can see some information about the performance of the code within your signposts. The min duration , max duration and standard deviation metrics are great indicators that can help you dial in the performance of your code. They describe the time it takes to make it from the start signpost to the end signpost.
Drill down on the signposts you created in the networking category to see the log messages you added:

And that’s all there is to signposts. Hopefully you won’t have too many performance issues to debug, but if you do, the os_signpost instrument could be a big help. Congratulations!

Where to Go From Here?
You can download the completed version of the project using the Download Materials button at the top or bottom of this tutorial. There are still a handful of print statements left in the finished app. Why not convert them to the appropriate os_log and os_signpost statements for practice?
With your newfound knowledge of the unified logging system, you can add as many logs as you need to your apps and rest assured that your users will be well supported. With minimal performance impact and an easy way to organize your log messages, logging is a treat with os_log and os_signpost .
If you’d like to learn more, the official documentation on the unified logging system is a great reference.
If you’re more of a visual learner, check out the Unified Logging and Activity Tracing and Measuring Performance Using Logging WWDC videos.
Do you have anything to share about using unified logging in your own apps? If you have any questions or insights, I’d love to hear from you in the forum discussion below.
Recommend
About Joyk
Aggregate valuable and interesting links.
Joyk means Joy of geeK