

Introducing a Web Component and Data API for Quick, Draw!
source link: https://chinagdg.org/2018/11/introducing-a-web-component-and-data-api-for-quick-draw/
Go to the source link to view the article. You can view the picture content, updated content and better typesetting reading experience. If the link is broken, please click the button below to view the snapshot at that time.

Introducing a Web Component and Data API for Quick, Draw!
Source: Introducing a Web Component and Data API for Quick, Draw! from Open Source
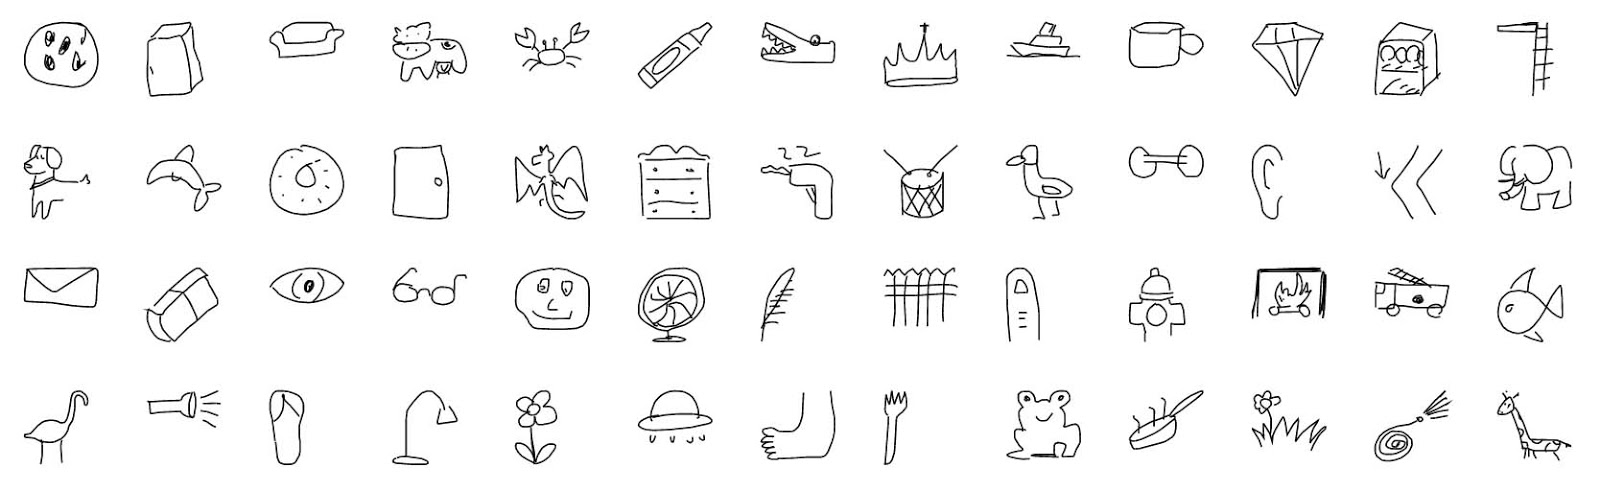
Over the past couple years, the Creative Lab in collaboration with the Handwriting Recognition team have released a few experiments in the realm of “doodle” recognition. First, in 2016, there was Quick, Draw!, which uses a neural network to guess what you’re drawing. Since Quick, Draw! launched we have collected over 1 billion drawings across 345 categories. In the wake of that popularity, we open sourced a collection of 50 million drawings giving developers around the world access to the data set and the ability to conduct research with it.
“The different ways in which people draw are like different notes in some universally human scale” – Ian Johnson, UX Engineer @ Google
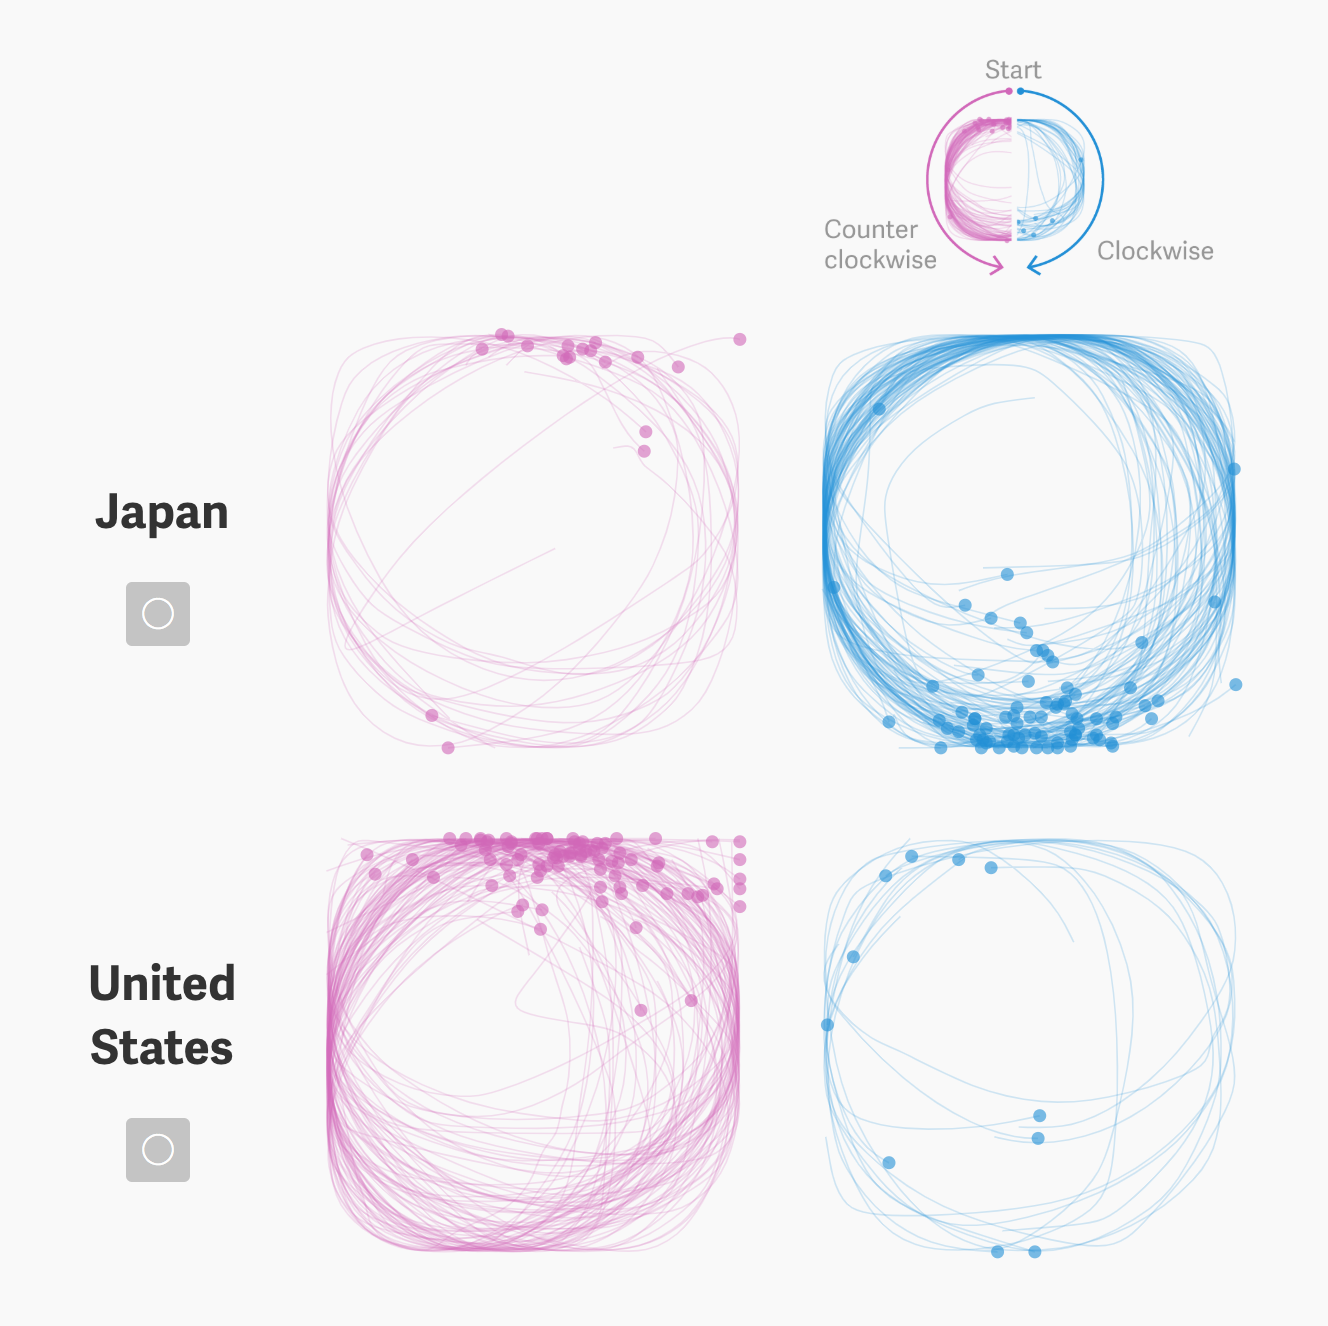
Since the initial dataset was released, it has been incredible to see how graphs, t-sne clusters, and simply overlapping millions of these doodles have given us the ability to infer interesting human behaviors, across different cultures. One example, from the Quartz study, is that 86% of Americans (from a sample of 50,000) draw their circles counterclockwise, while 80% of Japanese (from a sample of 800) draw them clockwise. Part of this pattern in behavior can be attributed to the strict stroke order in Japanese writing, from the top left to the bottom right.
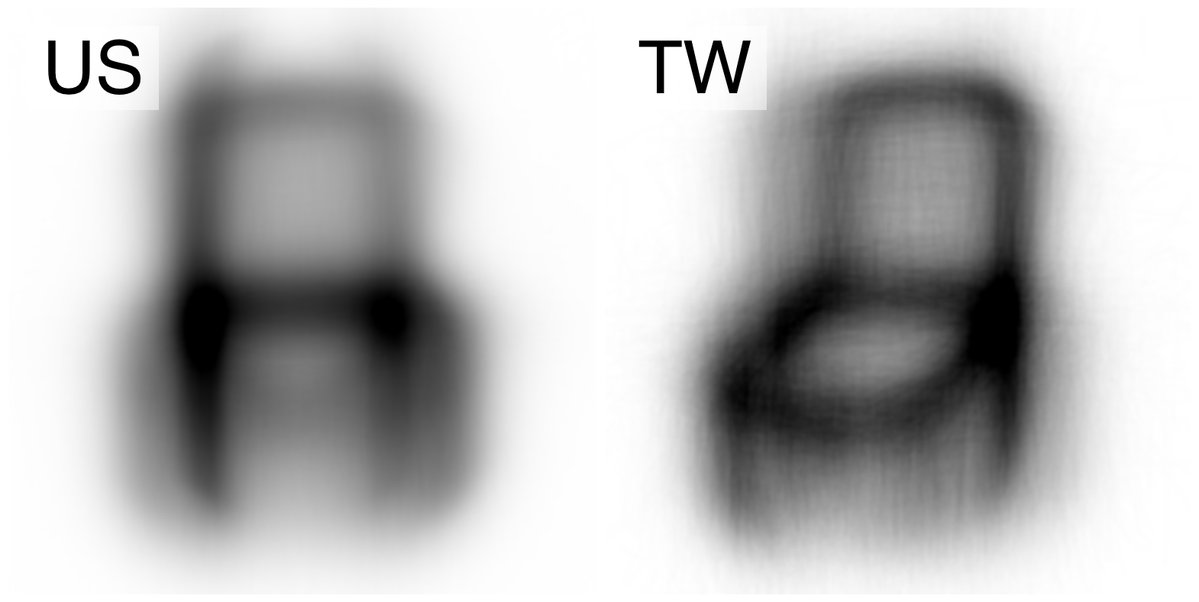
It’s also interesting to see how the data looks when it’s overlaid by country, as Kyle McDonald did, when he discovered that some countries draw their chairs in perspective while others draw them straight on.
On the more fun, artistic spectrum, there are some simple but clever uses of the data like Neil Mendoza’s face tracking experiment and Deborah Schmidt’s letter collages.
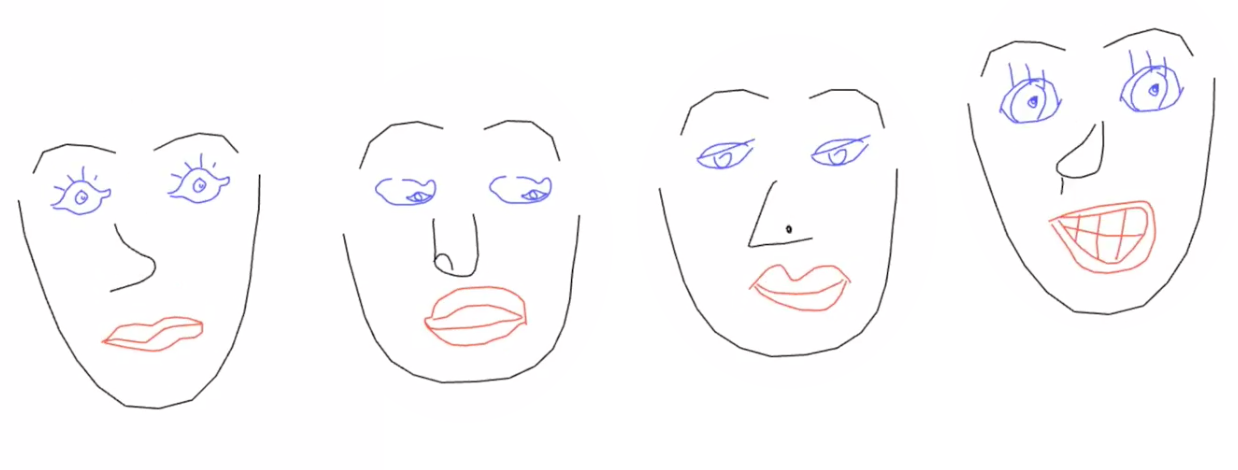 See the video here of Neil Mendoza mapping Quick, Draw! facial features to your own face in front of a webcam


 See the process video here of Deborah Schmidt packing QuickDraw data into letters using OpenFrameworks
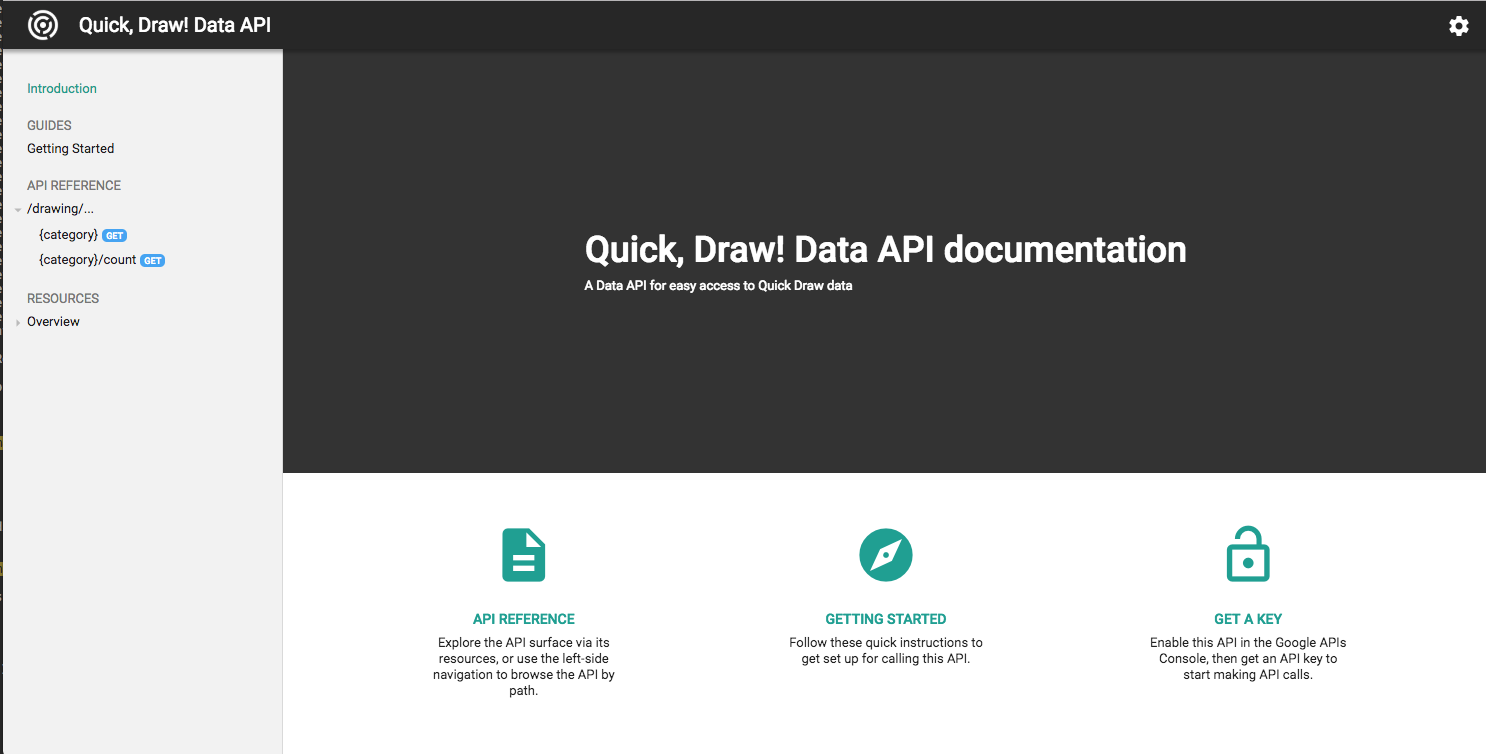
endpoints_api_service:
  name: quickdrawfiles.appspot.com
  rollout_strategy: managed
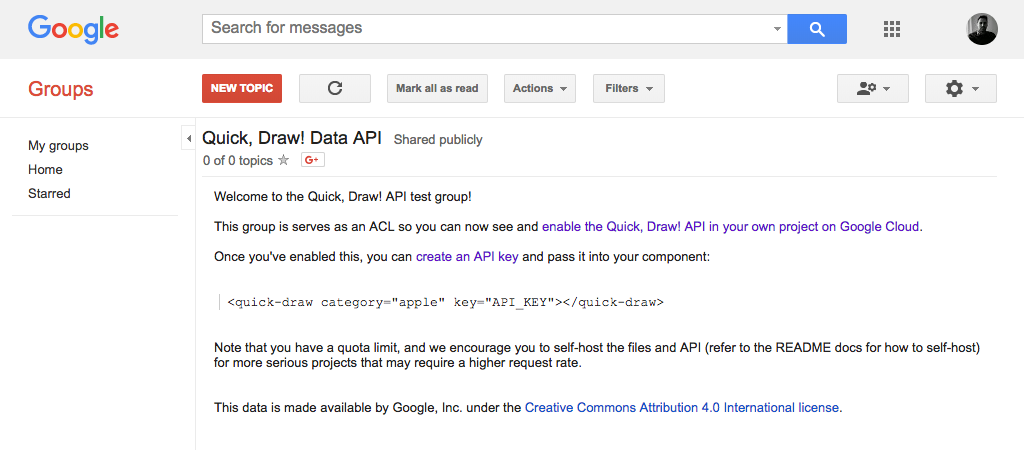 The Google Group used as an Access Control List
 After joining the group, you can search for and add the Quick, Draw! Data API in your GCP project
By Nick Jonas, Creative Technologist, Creative Lab
Editor’s Note: Some may notice that this isn’t the only dataset we’ve open sourced recently! You can find many more datasets in our open source project directory.
Recommend
About Joyk
Aggregate valuable and interesting links.
Joyk means Joy of geeK