

What to do (or not do) about top wait stats
source link: https://www.tuicool.com/articles/hit/3In6zem
Go to the source link to view the article. You can view the picture content, updated content and better typesetting reading experience. If the link is broken, please click the button below to view the snapshot at that time.
One of the most common terms to come up in discussions about SQL Server performance tuning is wait stats . This goes back a long way, even before this 2006 Microsoft document, " SQL Server 2005 Waits and Queues ."
Waits are absolutely not everything, and this methodology is not the only way to tune an instance, never mind an individual query. In fact, waits are often useless when all you have is the query that suffered them, and no surrounding context, especially long after the fact. This is because, quite often, the thing a query is waiting on is not that query's fault . Like anything, there are exceptions, but if you're picking a tool or script only because it offers this very specific functionality, I think you are doing yourself a disservice. I tend to follow a piece of advice Paul Randal ( @PaulRandal ) gave me some time ago:
…generally I recommend starting with whole instance waits. I'd never start troubleshooting by looking at individual query waits.
Occasionally, yes, you might want to dig deeper into an individual query and see what it is waiting on; in fact Microsoft recently added query-level wait stats to showplan to help with this analysis. But these numbers are typically not going to help you tune the performance of your instance as a whole, unless they are helping point out something that happens to also be affecting your entire workload. If you see one query from yesterday that ran for 5 minutes, and notice that its wait type was LCK_M_S , what are you going to do about it now? How are you going to track down what was actually blocking the query and causing that wait type? It might have been caused by a transaction that wasn't committing for some other reason, but you can't see that if you can't see the state of the entire system and are focusing just on individual queries and the waits they experienced.
Jason Hall ( @SQLSaurus ) mentioned something in passing that was interesting to me as well. He said that if query-level wait stats were such an important part of tuning efforts, that this methodology would have been baked into Query Store from the start. It has been added recently (in SQL Server 2017), but you still don't get per-execution wait stats; you get averages over time, like the query stats and procedure stats you can already see in DMVs. So sudden anomalies might be apparent based on other metrics that are captured per query execution, but not based on averages of wait times that are drawn over all executions.
The point of this post is to discuss some of the more common wait types we see out in our customer base, and what kind of actions you can (and shouldn't) take when they happen. We have a database of anonymous wait stats that we've been collecting from our Cloud Sync customers for quite some time, and since May of 2017 we've been showing everyone how these look over on the SQLskills Waits Library .
Paul talks about the reason behind the library and also about our integration with this free service . Basically, you look up a wait type you're experiencing or curious about, and he explains what it means and what you can do about it. We supplement this qualitative info with a chart showing how prevalent the current wait is among our user base, comparing that to all the other wait types we see, so you can quickly tell if you are dealing with a common wait type or something a little more exotic. Here's an example chart for CXPACKET , the most common wait type out there:

I started going a little further than this, mapping out some of the more common wait types, and noting some of the properties they shared. Translated into questions a tuner might have about a wait type they are experiencing:
- Can the wait type be solved at the query level?
- Is the core symptom of the wait likely to be affecting other queries?
- Is it likely you will need more information outside the context of a single query and the wait types it experienced in order to "solve" the problem?
When I set out to write this post, my goal was just to group the most common wait types together, and then start jotting notes about them relating to the above questions. Jason pulled the most common ones from the library, and then I drew some chicken scratch on a whiteboard , which I latertidied up a bit. This initial research led to a talk that Jason gave on the most recent TechOutbound SQL Cruise in Alaska. I'm kind of embarrassed that he put a talk together months before I could finish this post, so let's just get on with it. Here are the top waits we see (which largely match Paul's survey from 2014 ), my answers to the above questions, and some commentary on each:
10 : LCK_M_X Blocked while trying to update a row, page, partition, etc. with an exclusive lock. This could be due to schema locks (e.g. offline rebuild), escalation from explicit locking hints, long-running transactions, or a host of other reasons. This can often be because an index is "hot" – it might be obvious from the query which index it is, or that there are explicit hints like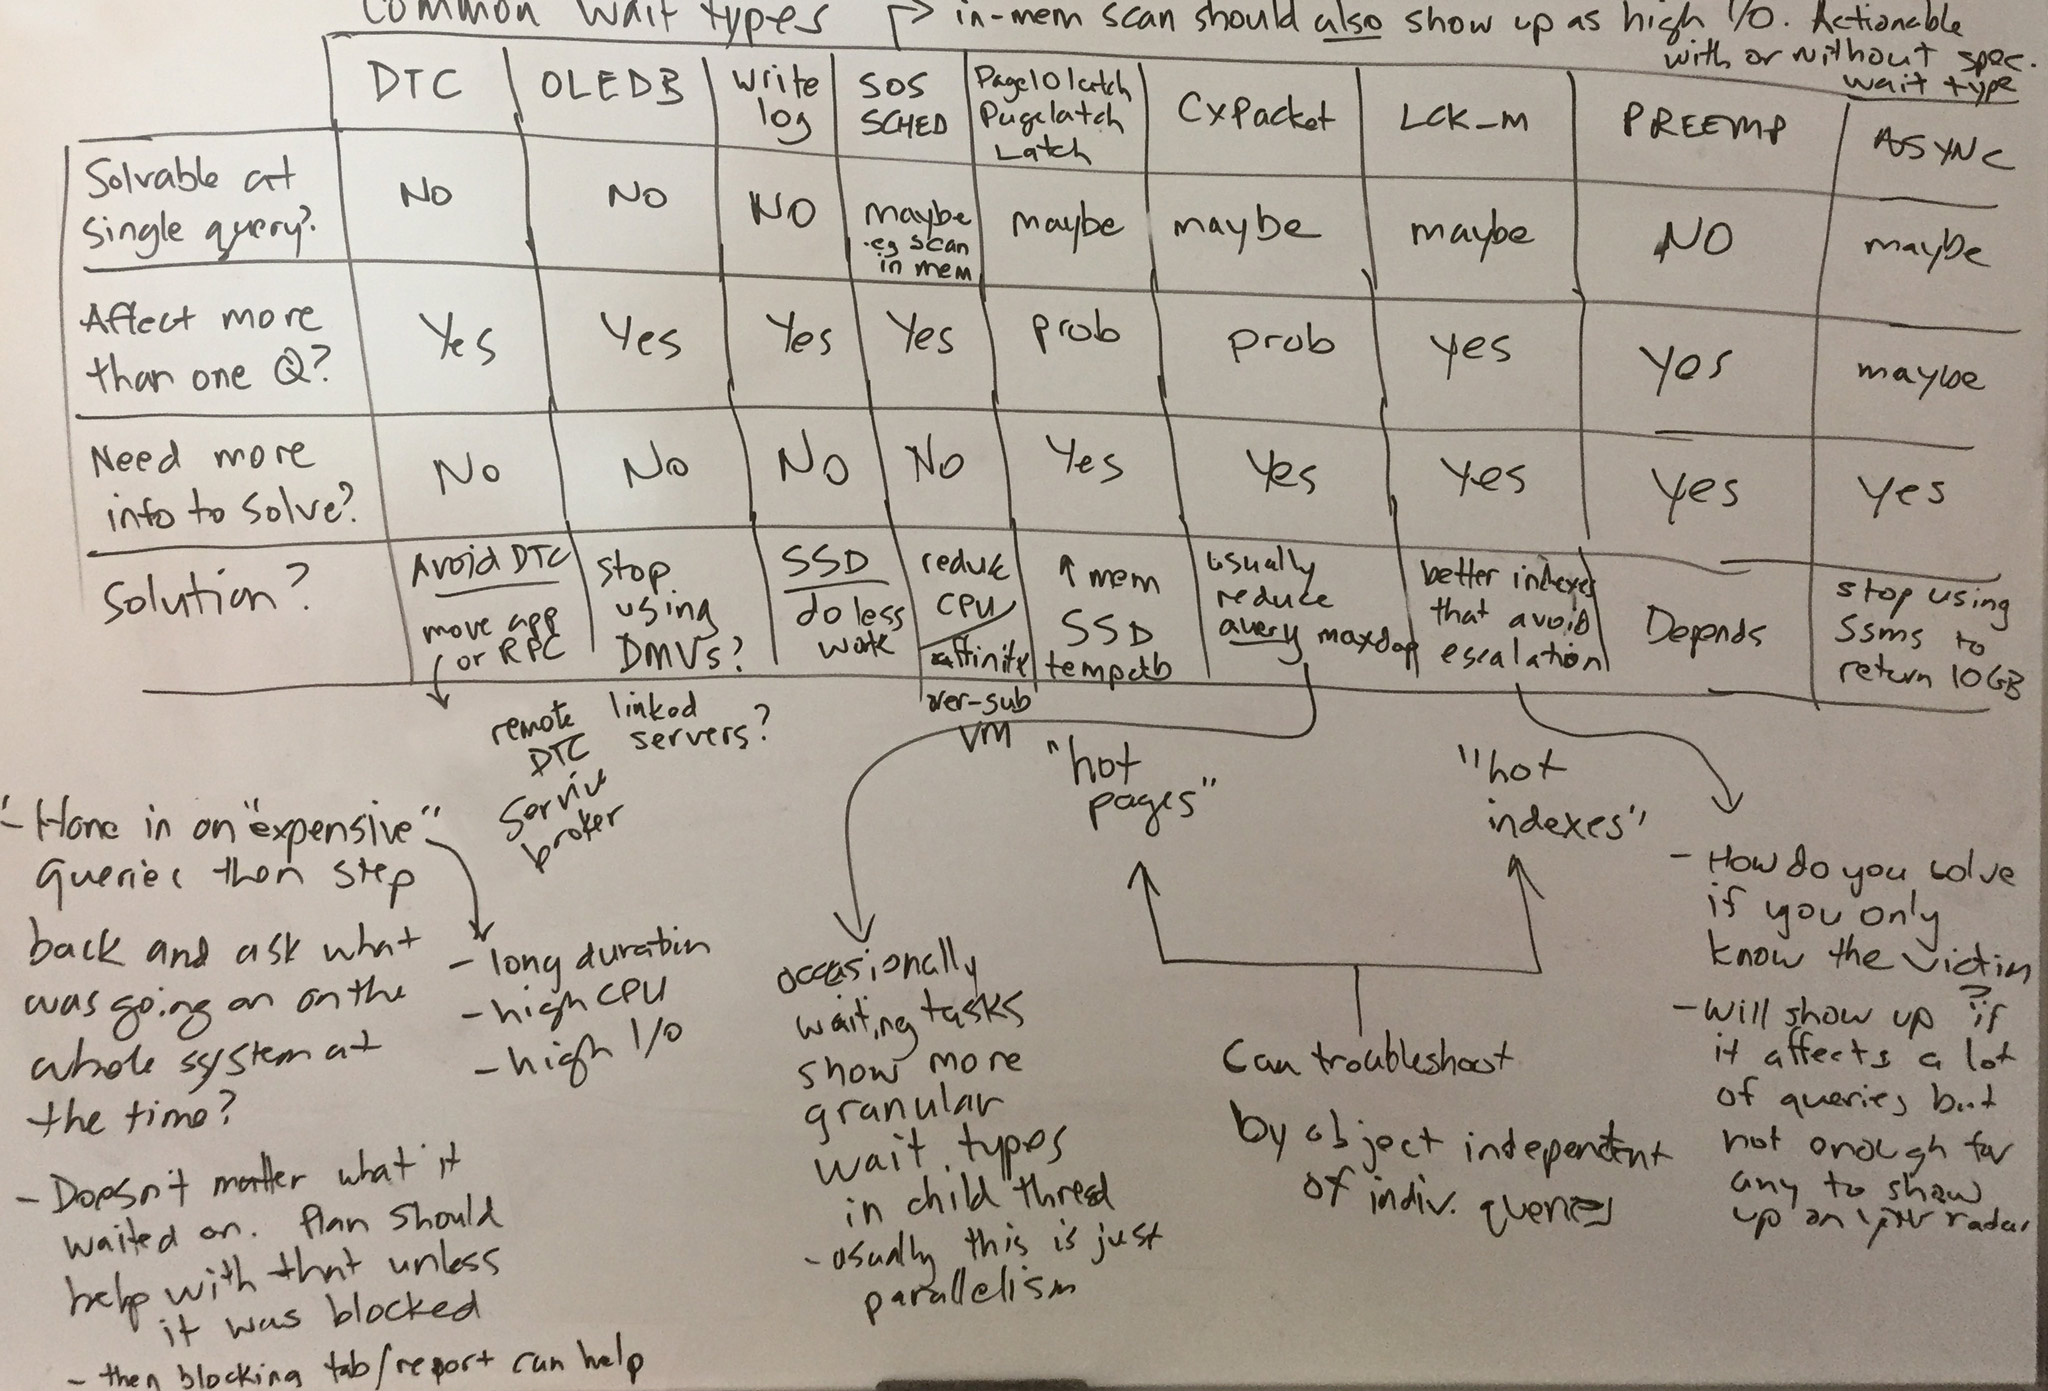
TABLOCKX , but it might not. The wait type alone won't tell you any of that; you'll need to catch the long-running version of the query in the act, and investigate things like the execution plan, sys.dm_tran_locks , sys.dm_os_waiting_tasks , and maybe even follow a blocking chain to the leader. More details in the library and in this post about knee-jerk reactions .
Solvable at query level? Maybe Likely affects other queries? Yes Need more external info? Yes 9 : LCK_M_U Essentially the same as #10, except this is just a normal update lock, not an exclusive one.More details in the library and in this post about knee-jerk reactions .
Solvable at query level? Maybe Likely affects other queries? Yes Need more external info? Yes 8 : WRITELOG Blocked waiting for a log block to be written to disk. While you could argue that this wait occurs because you are just writing too much to the log, this is a database- or system-wide problem that is almost certainly affecting more than just the current query you're troubleshooting. It may be that you have too many huge transactions constantly writing to the log, in which case you can consider chunking write operations , changing truncate/load processes to upsert, or even delayed durability or In-Memory OLTP. It also could become more prevalent if you are using synchronous HA technology, like mirroring or Availability Groups. It is more likely this will be associated with slow I/O in general, in which case you should consider moving the log to SSD or better, if possible.More details in the library , and see these posts from Paul (part one |part two),Erin Stellato, andTim Radney.
Solvable at query level? No Likely affects other queries? Yes Need more external info? N/A 7 : LCK_M_IX Like #9 and #10 above, but this time it is an intent exclusive lock (which Klaus Aschenbrenner discusses here ).More details in the library and in this post about knee-jerk reactions .
Solvable at query level? Maybe Likely affects other queries? Yes Need more external info? Yes 6 : LATCH_EX Waiting for an exclusive latch on a non-page data structure like page buffers or a data or log file. Examples include waiting for a log file to autogrow or even aNOLOCK query's shared latches delaying an update. You'll need to chase these down using sys.dm_os_waiting_tasks and sys.dm_os_latch_stats , and then looking up the latch class in the Latch Classes Library , but only do so if this is a top wait on your system and is affecting a large number of queries.
Solvable at query level?
Maybe
Likely affects other queries?
Probably
Need more external info?
Yes
5 : ASYNC_NETWORK_IO
Waiting for acknowledgement that data has been sent by TDS. Often this is misinterpreted as an indicator of slow network bandwidth; I picture a DBA shouting to his whole office, "Stop downloading large files!" This is almost never a network issue; usually due to delays in client processing, where cursor-like processing, MARS, linked servers, or underpowered clients are in play. Most often it is trying to render 50 billion rows in an SSMS grid on a machine with 4 GB of RAM, or a paging application that pulls the whole table, shows 50 rows, and then pauses, waiting for you to click next. The app just can't (or won't) keep up, and SQL Server registers this wait type as it's waiting for the app to consume more rows. More details in the library and in this post about knee-jerk reactions .
Solvable at query level? Maybe Likely affects other queries? Maybe Need more external info? Yes 4 : SOS_SCHEDULER_YIELD This just means that a thread has voluntarily yielded at the end of its 4ms quantum . It could indicate unexpected scans, sorts, or compilation times; or an under-powered / over-subscribed virtual machine. If this is a top wait, is a new issue, and can be correlated with an actual performance issue, look at these queries insys.dm_exec_requests , see if the current plan is performing a large scan or sort that could be avoided, and if there is no clear cause, dig deeper . More details in the library and in this post about knee-jerk reactions .
Solvable at query level? Maybe Likely affects other queries? Yes Need more external info? No 3 : PAGEIOLATCH_SH Waiting to read a data page that must first be read from disk. This sounds like an issue with the I/O subsystem, and you should spot this via latency insys.dm_io_virtual_file_stats . But it's usually due to insufficient memory – or things that are pushing pages out of memory, like explicit DBCC DROPCLEANBUFFERS calls or just too many scans of different, large tables. Add memory if possible, move other memory-hungry databases or applications to other servers, or tune queries to remove unnecessary scans. More details in the library and in this post about knee-jerk reactions .
Solvable at query level? Maybe Likely affects other queries? Probably Need more external info? Yes 2 : LCK_M_S Waiting to acquire a shared lock on a row, page, partition, etc. This can happen briefly when an S lock is taken out on the entire database (e.g. someone is changing a database setting) or the basic and more common "writers blocking readers" scenario. If this is a top wait and you can correlate it to specific performance issues in your workload, try to capture the affected resource(s) throughsys.dm_os_waiting_tasks and sys.dm_tran_locks . One mitigation could be using Read Committed Snapshot, but you need to be aware of the impact to tempdb . More details in the library and in this post about knee-jerk reactions .
Solvable at query level? Maybe Likely affects other queries? Yes Need more external info? Yes 1 : CXPACKET By far the most talked-about and misunderstood wait type in existence. Most of the time, this just means parallelism is happening. The knee-jerk reaction is to set serverMAXDOP to 1.Don't do this. For the longest time, CXPACKET combined both "good" parallel waits (controller thread waiting for all the threads to finish) and "bad" parallel waits (one or more producer threads have finished but are waiting for other producers to finish). This blending made it very difficult to determine if CXPACKET waits were a problem or just an attribute of a highly parallel workload.
In SQL Server 2016 SP2, 2017 CU3, and Azure SQL Database, this has all changed. CXPACKET has scuttled the "good" parallel waits into their own benign wait type, CXCONSUMER ( more details here ). In these newer versions, this new wait type should be ignored but, if CXPACKET is still high, it is more likely that you are experiencing "bad" parallelism (typically skewed distribution due to bad stats or bad estimates).
In either case, you can determine the cause and take remediation steps, following Paul's advicehere andhere, and see more details in the library .
Solvable at query level? Yes Likely affects other queries? Maybe Need more external info? YesSummary
In most of these cases, it is better to look at waits at the instance level, and only hone in on query-level waits when you are troubleshooting specific queries that exhibit performance problems regardless of wait type. These are things that surface for other reasons, like long duration, high CPU, or high I/O, and can't be explained by simpler things (like a clustered index scan when you were expecting a seek).
Even at the instance level, don't chase down every wait that becomes the top wait on your system – you'll ALWAYS have a top wait, and you'll never be able to stop chasing it down. Make sure you ignore benign waits ( Paul keeps a list ) and only worry about waits that you can associate with an actual performance problem you are experiencing. If CXPACKET waits are high, so what? Are there any other symptoms aside from that number being "high" or happening to be at the top of the list?
It all comes down to why you're troubleshooting in the first place. Is a single user complaining about a single instance of a rogue query? Is your server on its knees? Something in between? In the first case, sure, knowing why a query is slow can be useful, but it's quite expensive to track (never mind keep indefinitely) all of the waits associated with every single query, all day, every day, on the odd chance you want to come back and review them later. If it's a pervasive problem isolated to that query, you should be able to determine what's making that query slow by running it again and collecting the execution plan, compilation time, and other runtime metrics. If it was a one-time thing that happened last Tuesday, whether you have the waits for that single instance of the query or not, you may not be able to sort out the problem without more context. Maybe there was blocking, but you won't know by what, or maybe there was an I/O spike, but you'll have to go track down that issue separately. The wait type on its own usually just doesn't provide enough information except, at best, a pointer to something else.
Of course, I need to earn my keep, here, too. Our flagship product, SQL Sentry , takes a holistic approach to monitoring. We collect instance-wide wait stats, categorize them for you, and graph them on our dashboard:

You can customize how any individual wait is categorized and whether or not that category even shows up on the dashboard . You can compare the current wait stats with built-in or custom baselines, and even set up alerts or actions when they exceed some defined deviation from the baseline. And, perhaps most importantly, you can look at a data point from the past, and sync the entire dashboard to that point in time, so you can capture all of the surrounding context and any other situation that may have influenced the issue. When you find more granular things to focus on, like blocking, high disk latency, or queries with high I/O or long duration, you can drill into those metrics and get to the root of the problem rather quickly.
For more info on both general wait stats approaches and our solution specifically, you can look at Kevin Kline's white paper, Troubleshooting SQL Server Wait Stats , and you can download a two-part webinar presented by Paul Randal, Andy Yun ( @SQLBek ), and Andy Mallon ( @AMtwo ):
- Part 1 : Performance Troubleshooting Using Wait Statistics
- Part 2 : Rapid Analysis of Wait Statistics with SentryOne
And if you want to give the SentryOne Platform a spin, you can get started here with a limited time offer:
Download an Extended, 45-Day Free Trial
Recommend
About Joyk
Aggregate valuable and interesting links.
Joyk means Joy of geeK