
38

使用sysstat graph来分析sar获取的性能数据
source link: https://www.linuxprobe.com/sysstat-graph-sar.html
Go to the source link to view the article. You can view the picture content, updated content and better typesetting reading experience. If the link is broken, please click the button below to view the snapshot at that time.
导读
sysstat工具包是一个linux下性能分析基本必备的,而通过里面的sa1工具可以实现将当前的性能数据记录到文件中,便于性能回溯。不过文本性的东西虽然能看到具体指标的值 ,不过总归没有图形化的东西来的直观。这里就结合sysstatgraph为例,对sa1的结果进行查看分析。
一、环境要求
一、环境要求
- 运行sysstat服务,并在/var/log/sa目录下有sarXX文件生成
- php5.2以上版本
二、安装sysstatgraph
1、下载sysstat graph包,当前最新版本为0.4 。将该包解压后,放到web目录下,这里以apache httpd为例 ,解包到/var/www/html 目录。
2、编辑config.php文件,默认如下:
define('SYSSTATDATAPATH','/var/log/sa');
define('JSONSTRUCTUREFILENAME','data.json');
define('NETWORKINTERFACELIST',serialize(array('lo')));
// define('NETWORKINTERFACELIST',serialize(array('lo','eth0')));
第一行指定了systat 生成文件的目录,所以建立一台分析服务器,将其他主机的/var/log/sa打包复制到该主机,将放到相应目录,并修改该路径。
第二行指生成的json文件,默认情况下,先读取该json文件,并将数据返回到html 页面上。可以在命令下执行php index.php ,会输出并生成该文件。
第三行指定了查看网络流量的网卡接口,默认只配置了回环接口。想要使用其他接口,可以将lo 修改为其他接口,如eth0 。有多个接口时,可以按第四行的方法进行配置。
3、通过http://ip/index.php访问,图示类以如下:
4、sysstat graph 查看的性能指标
通过该工具,可以查看以下性能指标
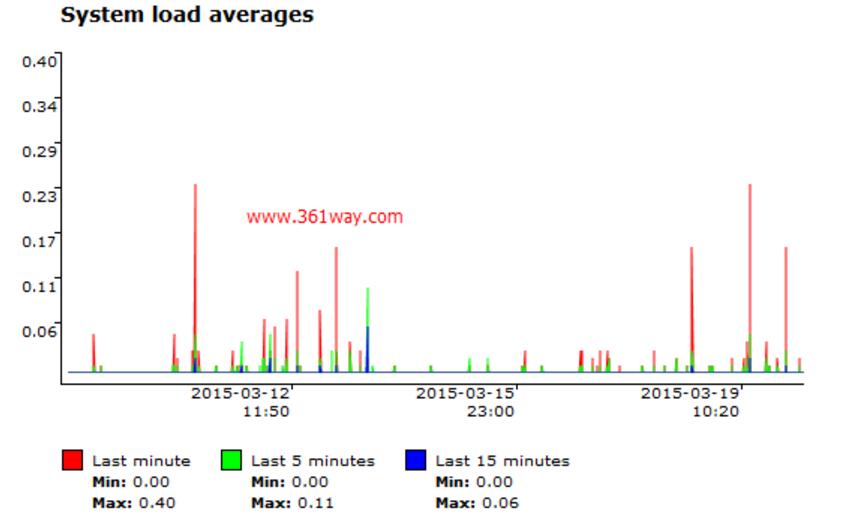
Tasks created (per second)
Context switches (per second)
CPU utilisation (User/System/IOwait)
Memory usage / Swap usage (megabytes)
Running/sleeping task count (threads)
System load averages
Network packets (received/transmitted per second) - per adapter
Network kilobytes (received/transmitted per second) - per adapter
三、后记
本来想通过python 实现读取sarXX文件生,将数据通过ajax 直接图示展现(和之前先写入rrd数据库,再通过rrdtool 生成不同),在查阅资料时发现php版本的该软件包。这里记录下以备以后借鉴参考。
Recommend
About Joyk
Aggregate valuable and interesting links.
Joyk means Joy of geeK