

How Long Are Typical Unmoderated UX Tasks?
source link: https://measuringu.com/how-long-are-typical-unmoderated-ux-tasks/
Go to the source link to view the article. You can view the picture content, updated content and better typesetting reading experience. If the link is broken, please click the button below to view the snapshot at that time.
How Long Are Typical Unmoderated UX Tasks?
Many usability studies (especially benchmark studies) suffer from trying to do too many things. That includes asking participants to attempt too many tasks. It’s understandable why tasks get packed in—even low-cost usability testing takes time and money, so you want to make the most of the effort. This is especially the case when participants are difficult or expensive to recruit.
You want to be able to cover as many tasks as possible, but if you have too many tasks, you won’t get through them in the allotted time. It would be good to know how long it usually takes to complete typical tasks while planning the study.
Of course, task duration depends on the context. The application being tested, participants’ roles, research goals, research protocols (e.g., think-aloud, non-think-aloud, tree test), and the data collection mode (moderated or unmoderated) will all play a role.
We had a similar challenge a few years ago when we investigated the “average” task completion rate, but task times seem even more context dependent than completion rates.
In this case, though, we’re analyzing completion times not to set a performance benchmark (which is highly context dependent) but rather to get an idea about typical task duration for planning purposes. This will help researchers quickly calculate how many tasks they may plan to include given a study’s time constraints.
We narrowed our focus to unmoderated studies because participants can get stuck or flounder for a long time without a moderator. We also limited ourselves to traditional usability tasks with small numbers of precisely defined completion goals (e.g., book a hotel room on a specified date in a specified location within a specified price range). In other words, these are pragmatic tasks (where shorter task times reflect more efficient design) rather than hedonic activities (where longer times reflect more engagement as users interact with a product).
Details of the Datasets
Using our MUiQ® platform to conduct unmoderated UX studies, we collected data from 1,222 tasks as shown in Table 1. These tasks were composed of think-aloud (TA), non-TA, and tree test tasks across 112 different studies (a mix of desktop and mobile websites, mobile apps, and prototypes) from 2021 to 2023.
The average sample size per task was 71, with a low of 3 participants and a high of 211.
The overall distribution of times ranged from 3 to 505 seconds (about 8.4 minutes), with a mean of 72 seconds, a median of 54 seconds (interquartile range from 30 to 88 seconds), and a geometric mean of 51 seconds. As expected, the distribution was skewed by a few very long tasks (Figure 1 shows the completion time distributions for the three types of studies). Consequently, we focused on medians and geometric means rather than arithmetic means to estimate the centers of the distributions.
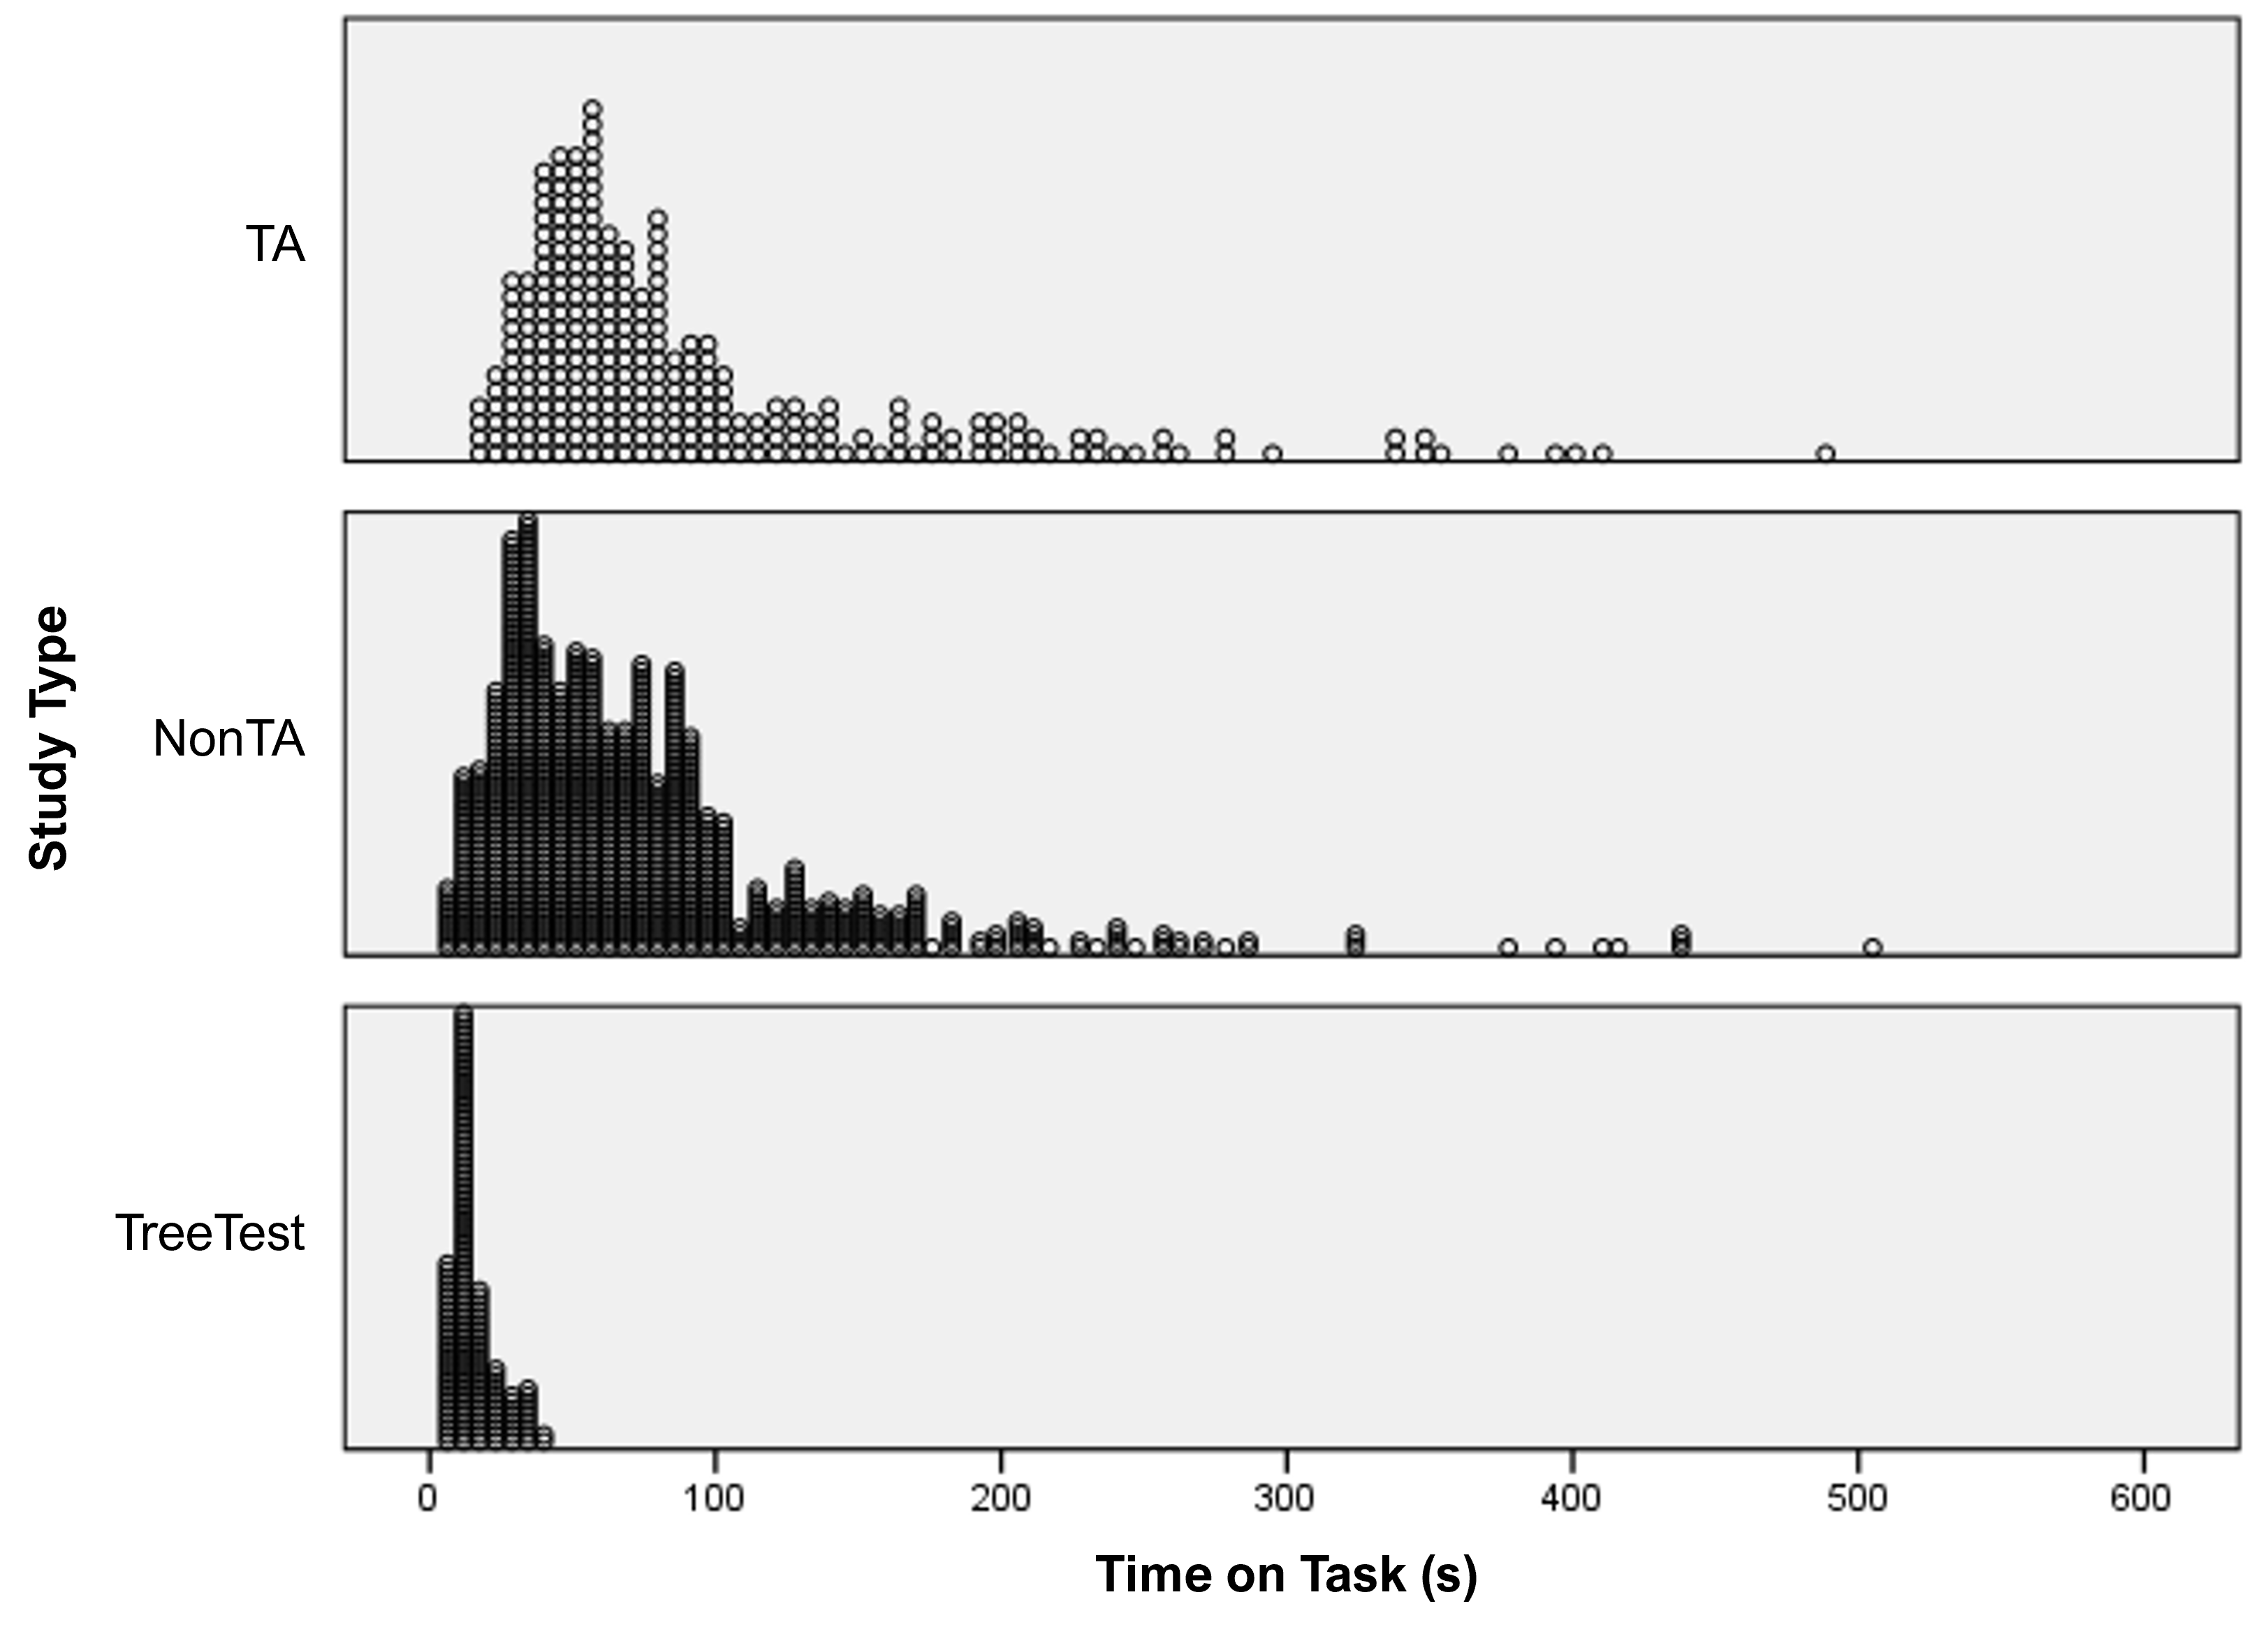
Figure 1: Dot plots of task completion times for TA, non-TA, and tree test tasks.
As shown in Table 1, our dataset had a lot more non-TA (803) than TA (270) or tree test (149) tasks. We collected many of the non-TA tasks in large-scale UX benchmark studies. All differences between the means, medians, and geometric means of the study types were statistically significant (p < .01). The median time for TA (67 seconds) was 18% longer than the median for non-TA (57). As expected, times for tree tests were much faster than those for more complex tasks.
| Study Type | Median | Geo Mean | Mean | St Dev | Minimum | Maximum | N (Tasks) |
|---|---|---|---|---|---|---|---|
| TA | 67 | 74 | 96 | 80 | 3 | 489 | 270 |
| Non-TA | 57 | 57 | 75 | 64 | 3 | 505 | 803 |
| Tree Test | 13 | 14 | 15 | 8 | 5 | 41 | 149 |
Table 1: Summary of task completion times (in seconds) for three types of unmoderated UX studies.
Table 2 shows the key percentiles for each study type. The 50th percentile is the median. The 25th and 75th percentiles are the endpoints of the interquartile range.
It’s rare for studies to have only a single task, so Table 3 also shows what the task time alone would take up for five tasks—something more typical in our experience. Note that these time estimates don’t include the time needed to read tasks before attempting them or answer post-task questions.
| Study Type | 5th | 10th | 25th | 50th | 75th | 90th | 95th |
|---|---|---|---|---|---|---|---|
| TA | 28 | 34 | 46 | 67 | 111 | 205 | 268 |
| Non-TA | 15 | 23 | 34 | 57 | 90 | 149 | 200 |
| Tree Test | 7 | 8 | 10 | 13 | 18 | 29 | 34 |
Table 2: Key percentiles for each study type (cells are completion times in seconds).
| Study Type | 50th (Median) | 75th | 90th | 95th |
|---|---|---|---|---|
| TA | 5.6 | 9.2 | 17.1 | 22.3 |
| Non-TA | 4.8 | 7.5 | 12.4 | 16.7 |
| Tree Test | 1.1 | 1.5 | 2.4 | 2.8 |
Table 3: Estimated times (in minutes) for different percentiles to complete five tasks for each study type (task completion time only—does not include time for reading tasks or completing post-task questions).
So which percentile should you use for planning? Starting with the median (the 50th percentile) seems like a good place to start, but it’s risky. By definition, the median is the point at the middle of the distribution where 50% of tasks in our data were longer. That means that half the time, the tasks will take longer than planned. It’s usually better to be a bit conservative and use something like the 75th percentile.
There are also other times when you want to be sure you have enough time, so it would be better to use the 90th or 95th percentile.
Summary and Discussion
The key takeaways from our analysis of 1,222 unmoderated task times are:
Median times for different research protocols are significantly different. The task time distributions for the three research protocols are different enough that researchers should use the estimates in Tables 2 and 3 when planning a TA, non-TA, or tree test study rather than the overall median and interquartile percentiles.
Use the 75th percentile for planning. When you plan an unmoderated study and lack historical data about the task, we generally recommend using the 75th percentile for the planned research protocol. This means most tasks will take less than these times by task type:
- Tree Tests: 20 seconds
- Non-TA Tasks: ~90 seconds
- TA Tasks: ~120 seconds
These estimates don’t include pre-task or post-task questions. The task times in the analysis are only the times participants spend attempting a task and don’t include reading instructions or answering post-task questions. Both activities will add some time to an overall study depending on the length and complexity of instructions and the number of questions.
There are no moderated data in these estimates. This analysis did not include any data from moderated studies (tasks with an attending researcher). We included only data from unmoderated studies collected using the MUiQ platform.
The dataset is not necessarily broadly representative. Although we created a large dataset of task times from unmoderated TA, non-TA, and tree test studies, a broader dataset could likely include longer times. We created our data sets from the types of UX studies we typically conduct, which may be different from other UX research contexts where pragmatic tasks are more complex (e.g., coding an error-free speech recognition app) or there is more of a focus on hedonic activities (e.g., “spend as much time as you want to browse the website to see if you find anything interesting”).
These data do not define “good” task times. Be careful not to extrapolate this time data into a benchmark. An unmoderated task that takes 40 seconds is shorter than the median time in our dataset, but this doesn’t mean it’s necessarily a fast or efficient task experience. For example, clicking a login or entering a search string are tasks that should take much less than 30 seconds.
Recommend
About Joyk
Aggregate valuable and interesting links.
Joyk means Joy of geeK