

Prioritizing App Stability — Mobile Performance @ Lyft
source link: https://eng.lyft.com/prioritizing-app-stability-cb7b4cf65d50
Go to the source link to view the article. You can view the picture content, updated content and better typesetting reading experience. If the link is broken, please click the button below to view the snapshot at that time.

Prioritizing App Stability — Mobile Performance @ Lyft
Note: Although the strategies outlined in this article are platform agnostic, we are using concrete examples from Android to highlight their execution.
Creating a Performance Framework
In the spring of 2020 we started the journey to improve the performance of Lyft’s mobile applications, initially focusing on app start time (also known as Time to Interact or TTI). There was a great deal of opportunity for improvement in the TTI space at Lyft and we were confident that with a small investment, we would be able to add meaningful impact. The success of this project helped pave the way for further investment in Mobile Performance at Lyft.
Making the jump from a single TTI investment into a holistic plan to improve Mobile Performance at Lyft meant we would have to think beyond a single metric. In doing so, we also wanted to establish key focus areas to avoid “boiling the ocean” through too many avenues of improvement. Leveraging Google’s Android performance documentation, we focused our investment in Mobile Performance into the three metrics with the highest opportunity for improvement.
- Time to interact (app start): Continuing reducing app startup time that started in 2020
- Stability: Reducing the number of crashes and ANRs (App Not Responding) any given user experiences
- Rendering performance: Maintaining a high, buttery smooth frame rate
When evaluating the prioritization of the above metrics, we created a table using rough estimates of each metric’s opportunity size, actionability, and user impact. We gave each area a weight and multiplied them to get a score. The weight of “How Actionable” is determined by the engineering effort level required for the first improvement. The weight of “Customer Impact” is determined by the extra time and effort users need to spend during app interaction because of performance issues. Below is an excerpt specifically outlining the Android Lyft Driver app.
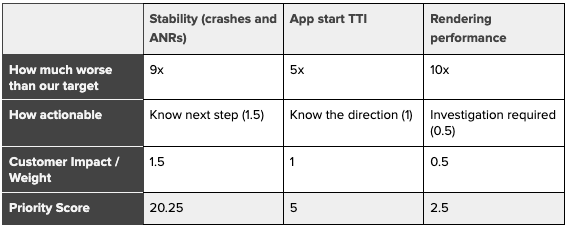
Priority score calculation
Based on the Priority Score above, we were able to identify that app stability was a clear candidate for prioritization. There are two subcategories within stability: crashes and ANRs. Crash reports typically contain more debuggable information compared to ANR reports, so we decided to tackle app crashes first.
Priority #1: App Crashes
Crashes can occur anywhere across the code and vary in complexity and actionability. Root-causing crashes can require deep knowledge of the underlying systems and frameworks. These two characteristics of crashes can result in both investigation rabbit holes and an overwhelming amount of information to act on. It was important to start with the most obvious low-hanging fruit that had the potential to yield results we could learn from.
We started by collecting relevant statistics using established observability tools: our own stability reporting analytics, Bugsnag, and Google Play Console. Synthesizing this information led to a few key takeaways:
- Native crashes were not included in Lyft’s internal crash rate tracking. Native crashes are crashes thrown from the native layer. They are captured and reported differently from regular Java crashes. We used Bugsnag for general crash reporting, but never enabled the native crash reporting feature.
- Top 10 crashes contributed to 53% of overall crashes. Given the scale of the Lyft app, there could be many kinds of crashes. We were surprised to find that the top 10 crashes were responsible for more than 50% of the total volume. The pie chart below lists the top crashes and their percentage.
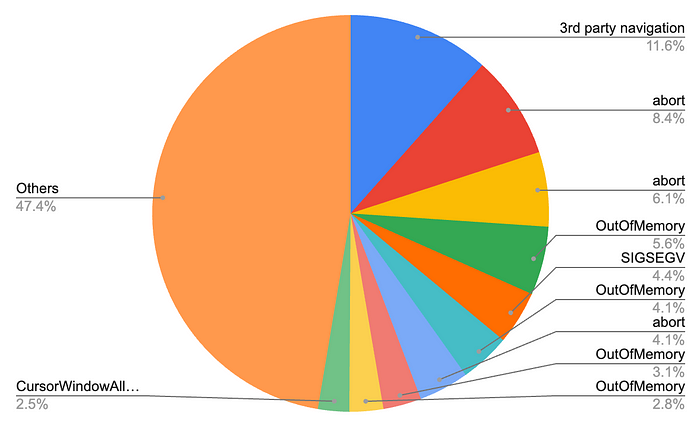
Top crashes from the Lyft app
- Top crashes were long-lasting and “not actionable”. Every crash in the top 10 held that position for at least 6 months. This was due to the fact that these crashes would require outsized time to fix. Some also had increased slowly over time, slipping under the radar of standard triage and on-call responsibilities.
The top crashes could be categorized into three buckets:
- Crashes caused by 3rd party SDKs: Mapping and navigation were the largest contributors.
- OutOfMemory crashes: Instabug has a nice overview of these crashes here.
- Native crashes: Occurring in the Native/C++ Layer of the Android operating system.
Top crash categories
We needed to make a decision: which crash bucket should we target first? The crash volumes were similar, so the opportunity for improvement was dependent on the actionability of crashes within the major buckets.
Since crashes in the Google Maps SDK were not actionable because we have no control over third party libraries, our only option was to report them to Google and work with their engineers to resolve them. Similarly, we did not have enough tooling to root cause native crashes, so these weren’t immediately actionable without first building observability tools. Luckily there were actionable stack traces for some of the OutOfMemory (OOM) crashes, so we decided to give these a shot.
Deep Diving OOM Crashes
By looking through quite a few OOM crash stack traces, we found many calls to a RxJava2 blocking API (e.g. blockingGet()) when reading values synchronously from disk.
When reading data from the disk, Lyft’s internal storage solution always creates a new IO thread by subscribing on the IO scheduler, reading and caching the data in a PublishRelay, and utilizing the blockingGet() function from RxJava2.
There are a few issues with this approach in relation to OOM crashes. The RxJava documentation notes that the IO scheduler can create an unbounded number of worker threads. Since the IO scheduler uses CachedThreadPool, the scheduler does not remove idle threads immediately. Instead, the scheduler keeps threads alive for about 60 seconds before clearing them. Rather than reusing threads, it creates 1000 new threads if there are 1000 reads in a minute. Each thread can occupy 1MB~2MB memory at minimum, leading to OOM exceptions.
We profiled the top disk read operations for Lyft’s apps, and fortunately found that the majority of disk reads came from only two places in the codebase where the number of reads was exceptionally high at >2k times per minute! At this point we had our root cause.
Since new threads were only created when data was read from disk, the patch was relatively straightforward. When the app was launched via a cold-start and data was read from disk for the first time, we could then cache the data in local memory. This allows subsequent reads to happen from the cache and prevent disk reads from creating many threads.
The experiment results indicated that not only did the solution reduce OOM crashes, but it also reduced native crashes by 53%. We didn’t expect the patch to have such a dramatic impact on native crashes, but clearly the cause of many native crashes was actually low application memory.
Expanding to ANRs
We were not immediately able to identify additional actionable crash reports using Bugsnag, so using our prioritization framework, we pivoted to our second subcategory of app stability: ANRs (App Not Responding).
ANRs occur when the UI thread is blocked for longer than 5 seconds and the operating system prompts the user to close the app. ANRs are typically difficult to root-cause without corresponding stack traces. Fortunately Bugsnag, the tool Lyft uses for monitoring app stability, not only provides stack traces for ANRs, but also groups related ANRs together when the stack traces are similar. After sorting ANR reports in descending order, we found that once again our persistence layer was the top culprit. Specifically, our use of SharedPreferences was causing the majority of ANRs.
We wanted to understand more about how SharedPreferences might cause ANRs, so we dug into Google’s documentation. Google recommends calling SharedPreferences.apply() to write and edit data asynchronously. Under the hood, SharedPreferences.apply() adds disk write operations to a queue instead of executing these operations immediately. For several lifecycle events including Activity.onStop(), Service.onStartCommand() and Service.onDestroy(), SharedPreferences executes all queued disk write operations on the main thread synchronously (this article provides a bit more detail). As a result, if there are many operations in the queue, executing them all synchronously may block the main thread for a long enough period of time to cause an ANR.
Once again we wanted to see how this might affect the Lyft codebase, so we profiled disk write operations, and found that disk write frequency for Lyft’s applications was as high as 1.5k times per minute. In some cases the same value was even written to disk multiple times per second wasting valuable resources. Generally we were able to identify that Lyft’s internal storage framework had abstracted the underlying storage mechanism, meaning disk storage and memory storage used the same interface, so developers were inadvertently treating disk and memory storage as one and the same.
To mitigate this, first we worked with product teams to remove any unnecessary disk writes from their features. Next, we added logging to audited superfluous disk writes. Then at the feature level, we created a memory cache for each of these superfluous disk writes and only wrote to the memory cache. Finally, we synchronized the memory cache and disk storage at a reasonable frequency depending on the use case. We also separated disk storage interface from memory storage interface to reduce confusion.
After conducting an experiment for a few months, the solution yielded a 21% reduction of ANRs.
Long Term Strategy
Based on the two experiments results above, we realized that disk storage played a much more critical role in our application’s stability than we initially thought. After addressing these tactical issues, we also proposed a long-term strategy based on what we had learned thus far:
- Monitor disk read/write frequency. Actual disk read/write frequency of our disk storage framework should be monitored and held under a reasonable range regardless of implementation strategy because, as we found, superfluous direct disk read/write can cause unnecessary performance issues.
- Provide the right abstraction. Disk operations are much slower than memory operations. Having synchronous interfaces for disk operations is disingenuous, and provides the wrong abstraction for developers, which is why modern disk solutions like DataStore (Google) and SimpleStore (Uber) use asynchronous interfaces.
- Dive deep into frameworks that impact your entire developer community. There are many disk storage solutions and each solution has its own pros and cons. Understanding them before use will prevent potential issues. In our example, we could have avoided ANRs if we understood SharedPreferences at a much deeper level.
Takeaways
In our first blog post, we outlined how our small initial investment in TTI garnered enough internal support to invest in a longer term strategy for mobile performance.
In this blog post, we outlined how we started developing that longer term strategy by first defining investment areas and then defining a prioritization framework. Using that prioritization framework, we were able to address the most problematic and systemic issues plaguing our codebase and dramatically improved the overall app stability.
While this was a viable initial strategy, the nature of low-hanging fruit is it becomes more sparse over time. In our next blog post, we will discuss how we grew the actionability of issues in the performance space by increasing investments in observability and debuggability.
Acknowledgments
Thanks to Ryan Tempas, Pierce Johnson, Corey Walo and Millie Walsh for the great support in related projects and this article!
Lyft is hiring! If you’re interested in mobile performance, check out our careers page.
Recommend
About Joyk
Aggregate valuable and interesting links.
Joyk means Joy of geeK