How to Analyze iPhone Battery Analytics Logs and Battery Health On-Device with Device Status⁺
Index
 Device Status⁺
Device Status⁺
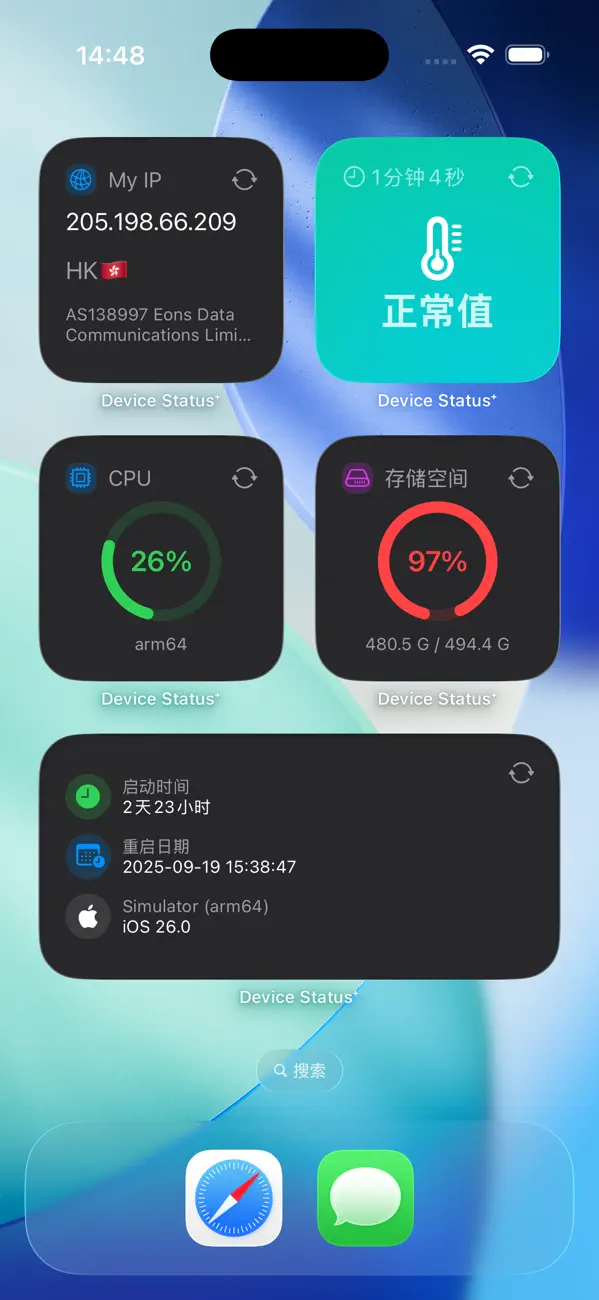
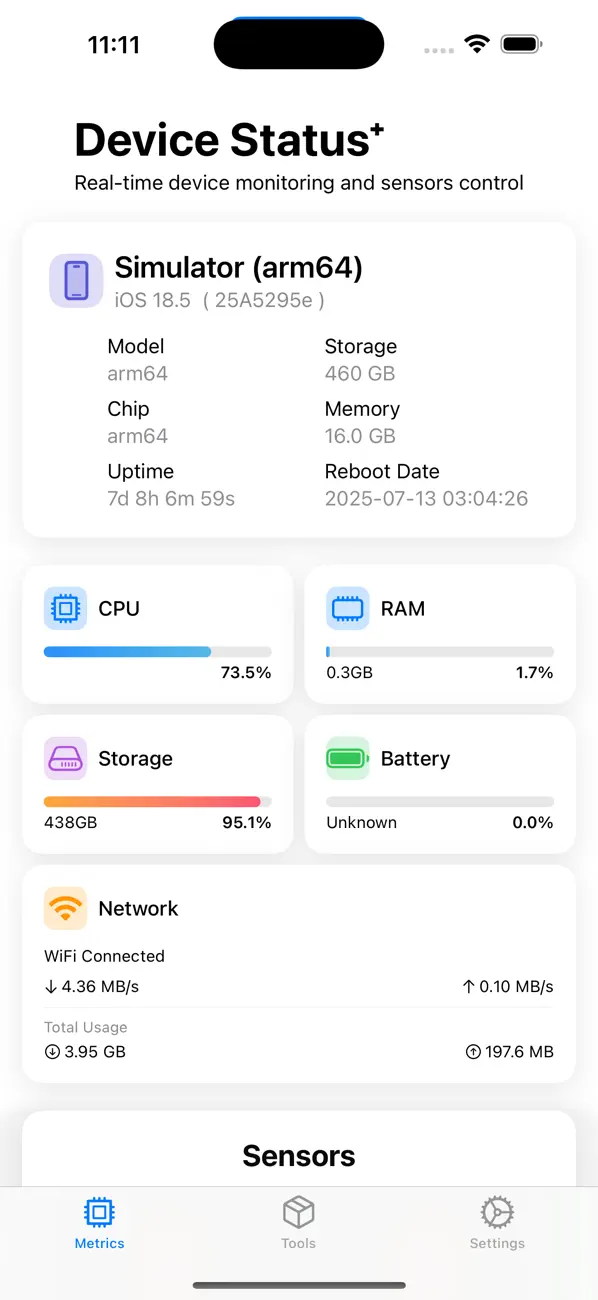
Device Status⁺ is an iPhone and iPad app for monitoring and managing device status, providing quick and intuitive access to key device information. Perfect for phone repair technicians and hardware enthusiasts.


The most detailed battery report on your iPhone is not in Settings → Battery. It is hiding in a file iOS generates every single day — and almost no one reads it.
Once you enable Share iPhone Analytics, the system writes a daily Analytics-YYYY-MM-DD-….ips.ca.synced log. Open it and you will find a stream of JSON lines that quietly contains a complete battery chemistry checkup: cycle count, capacity, internal resistance, temperature exposure, screen-on time, charge time, and per-app hangs. Apple uses this internally. To everyone else it is unreadable.
Device Status⁺ ships a Battery Log Analyzer that turns that daily stream into a health report with a single score — fully on-device. This guide covers what the log is, how to get it, and exactly which numbers the analyzer pulls out.
What is Device Status⁺?
Device Status⁺ is a free system-monitoring app by Space-Time Transformation Technology Co., Ltd. (iOS 17.0+; iPhone, iPad, Mac M-series, Apple Vision Pro, Apple Watch). Its companion Diagnostic Log Analyzer reads point-in-time sysdiagnose snapshots; the Battery Log Analyzer covered here reads the daily Analytics logs that track your battery's long-term health.
All processing is local. Nothing is uploaded.
What Is the Battery Analytics Log?
Each daily file is a stream of JSON objects, one per line, mixing many message types. Buried among them are the messages that describe your battery:
BatteryConfigValueHistogram— capacity, cycle count, temperature, voltage, current, Qmax, FCC, first-use date, uptimeDailyWirelessUsageAgg— screen-on timeaggregate_chargetime— charge timeHangTracerHangsByApp— per-app hang counts
Unlike a sysdiagnose (a one-time full-body snapshot of hardware, storage, and crashes), the battery analytics log is a daily, automatically-recorded trend. The two are complementary: one tells you what your hardware is, the other tells you how your battery ages.
Step 1: Turn on Analytics and grab the log
- Open Settings → Privacy & Security → Analytics & Improvements.
- Enable Share iPhone Analytics (if it is off, the first daily file appears the next day).
- Open Analytics Data and search for
Analytics. - Pick the most recent
Analytics-…-….ips.ca.syncedfile → Share → save it, then import it into Device Status⁺.
A single file is small, but it is still parsed as a stream — never loaded whole into memory.
Step 2: Stream-parse without loading everything
BatteryLogParser reads the file with an InputStream, line by line, and routes each JSON object to the matching extractor. Because it never holds the whole file in memory, even an unusually large daily log parses cleanly on older devices.
The metrics it extracts
From the four message families above, the analyzer reconstructs the raw picture:
- Capacity & cycles — nominal and raw max capacity, design capacity, cycle count, first-use date.
- Electricals — voltage range, current range, Qmax (maximum capacity under current conditions), FCC (full charge capacity).
- Environment — temperature summary across the day.
- Usage — screen-on time (from
DailyWirelessUsageAgg) and charge time (fromaggregate_chargetime). - App hangs — per-app hang counts from
HangTracerHangsByApp, correctly separating "debugger-attached" counts from "runtime" counts so the numbers are not double-counted.
These raw fields are the ingredients. What makes the report useful is what the analyzer computes from them.
The numbers you actually care about
BatteryLogReport derives the metrics that answer real questions:
- Computed Health =
NominalChargeCapacity÷AppleRawMaxCapacity— the actual usable-capacity ratio, independent of what iOS reports. - System Health =
MaximumCapacityPercent— the figure iOS itself reports in Settings, for direct comparison. - Daily charge range =
DailyMinSoc – DailyMaxSoc— a profile of your daily charging habit. - Battery-life score (0–100) =
screen-on-time ÷ 10800 × 60 + health × 40— a single intuitive number that fuses "how long it lasts" with "how healthy it is." - Plus: full-charge range, Qmax range, voltage / current bands, temperature summary, capacity stability, and cell consistency.
Showing both a computed health figure and the system-reported one side by side is the point: when iOS says 90% but the raw chemistry says 84%, you see the gap immediately.
How it looks
The headline number is a progress ring for battery health, colored by tier (green / yellow / red) so the state reads at a glance. Every metric beneath it is a card, and the whole report can be exported as plain text in one tap — handy for sharing with a repair technician or keeping a personal history.
Diagnostic Log vs Battery Log: Which One?
They answer different questions, and you may want both:
| Diagnostic Log (sysdiagnose) | Battery Log (Analytics .ips) |
|
|---|---|---|
| What it is | A point-in-time full-body snapshot | A daily, auto-recorded trend |
| Best for | Hardware config, storage wear, crashes | Long-term battery health & daily usage |
| How often | Captured manually on demand | Generated automatically every day |
If your phone crashed last night, read the sysdiagnose. If you want to know whether your battery is degrading faster this month, read the analytics log.
One-tap import via the Share Extension
From the Analytics Data list, open a .ips file and tap Share. The sharelog extension auto-detects the type — a .ips routes to the Battery Log Analyzer, a sysdiagnose_*.tar.gz to the Diagnostic Log Analyzer — shows a short confirmation card, and on confirm hands it off.
As with sysdiagnose, the extension itself does no parsing. It copies the file into the App Group container (ShareInbox/), writes a pending signal to App Group UserDefaults, and wakes the host app via the devicestatus URL scheme. Back in the foreground, the host's ShareImportCoordinator consumes the queue, clears the signal, and the actual analyzer runs where memory is plentiful — then sheets the report and deep-links to it. One tap to the user; a careful handoff under the hood.
Privacy and robustness
The same three promises that govern the Diagnostic Log Analyzer apply here:
- Fully offline, on-device — no network request at any stage.
- Readability first — every parse ends in a card; raw fields are retained but not shown by default.
- Production-grade robustness — path-traversal protection, file-render guardrails (text capped at 512 KB / 4,000 lines, CSV at 1,000 lines), and human-readable error messages instead of cryptic internal codes.
Final thoughts
Your iPhone has been writing a detailed battery diary every day; you just had no way to read it. The Battery Log Analyzer turns that diary into a health report — cycle count, real capacity, daily usage, and a single 0–100 score — without sending anything off the device.
Pair it with the Diagnostic Log Analyzer for the hardware side, and you have a complete, private checkup: what the device is today, and how its battery is trending over time.
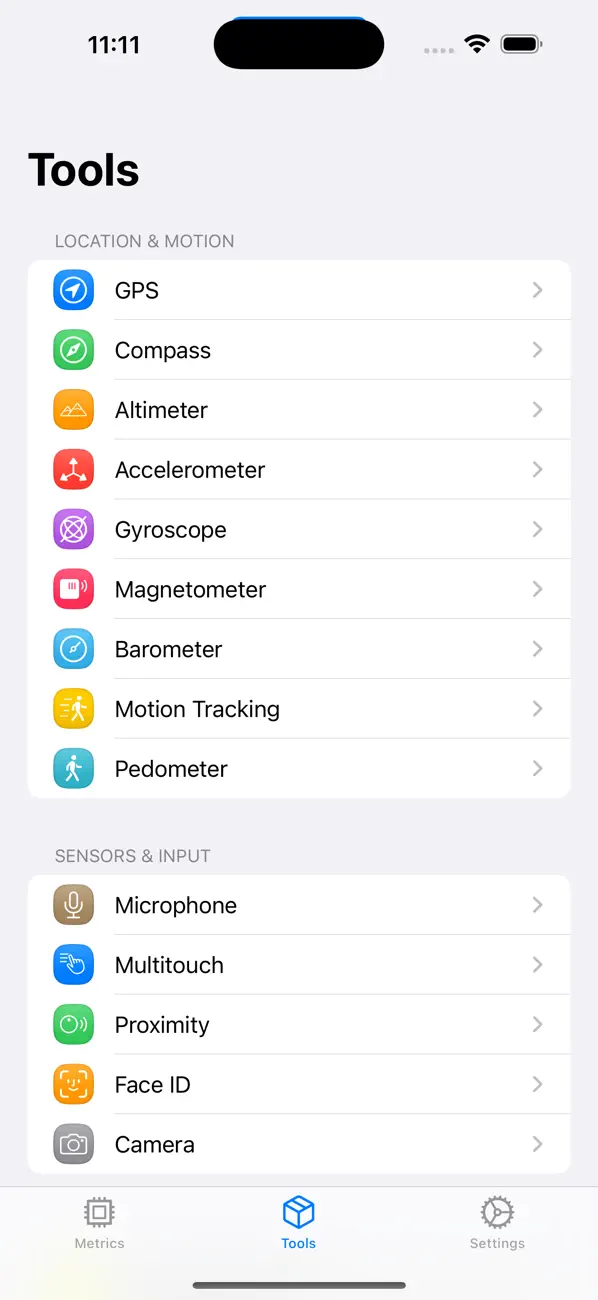
Features
Location & Motion
Accelerometer, Altimeter, Barometer, Compass, GPS, Gyroscope, Magnetometer, Motion Tracking, Pedometer.
Sensors & Input
Camera, Face ID, Microphone, Multitouch, Proximity sensor testing tools.
Multi Platform
Support for iPhone, iPad, Mac, Apple Watch, and Apple Vision Pro.
Output Testing
Color & Brightness, Flashlight, Haptic Feedback, Vibration, Volume testing.
Screenshots