

Call of Duty: Warzone 2.0 CPU and GPU Benchmark | TechSpot
source link: https://www.techspot.com/article/2579-cod-warzone-2-benchmark/
Go to the source link to view the article. You can view the picture content, updated content and better typesetting reading experience. If the link is broken, please click the button below to view the snapshot at that time.
Call of Duty: Warzone 2.0 CPU and GPU Benchmark
By Steven Walton December 7, 2022
Call of Duty: Warzone 2.0 is a new free-to-play battle royale game, a sequel to 2020's CoD: Warzone and part of the latest Modern Warfare II release, but as a F2P title, it doesn't require the full game to enjoy the multiplayer action. Today we're taking a look at CPU and GPU performance in this title, and as expected, it was a bit of a nightmare to test, because that's just how it is for multiplayer games.
While we usually like to benchmark around 40 GPUs, given what's involved here, that just wasn't feasible, but we think we have a good sample of current-gen hardware. In total we tested 7 CPUs and 10 GPUs across three resolutions using two quality presets. The results are super interesting, which you will see in a second.
But how do you test a multiplayer battle royale game like Warzone 2.0? It's never easy, especially if you want to test more than one or two hardware configurations. Gathering accurate data is a real mission and super time consuming. This is because no two matches play out the same way, with players dropping in different locations, system load can vary, and you also need to land in the same location to carry out the path for the benchmark pass and ideally you want to do this somewhere where you won't often end up being killed, so good luck with that.
We also found that realistically you can only execute a single pass per game, not only because we were getting killed at the end of the test almost every single time, but because as the match progresses, the frame rate generally increases as there are fewer players.

For example, with just 30 players left we saw 1% lows increase by 25%, though the average frame rate was only boosted by ~6%, suggesting that there was a lot less stress on the CPU in late game. We were only able to test this a few times as it required a late game circle.
Speaking of which, we decided to conduct our testing in a central location as this would allow us to land with relative ease every time, regardless of the flight path and the landing zone. The potential downside to benchmarking a quieter section of the map is that the performance can be a bit higher than what you'll typically see in the busier sections of the map, and we did look into this, noticing that performance was often ~10% better for the benchmark pass.

But there's very little we can do about this as you won't often complete even a 20 second pass in the busy area, let alone a 60 second pass. What we did notice is that scaling was similar for the hardware configurations we checked, so the margins between the various CPU and GPUs tested should remain the same.
What all of this means is, testing the hardware configurations that we did, took at least as long as all the testing we did for Modern Warfare 2 using the built-in benchmark -- but for 44 graphics cards.
For this Warzone 2.0 testing, loads of time was lost just waiting for games, eventually loading into a game and getting to the section used for testing, and on numerous occasions we were killed while testing, invalidating the results forcing us to start over.
For this testing we've covered 1080p, 1440p and 4K resolutions, using the "Ultra" and "Minimum" quality presets. We'll start with the CPU benchmarks which was gathered using the RTX 4090 and we've only been able to test Zen 4 and Raptor Lake CPUs.
AMD's Zen 4 processors were tested with DDR5-6000 memory and Intel's Raptor Lake with DDR5-6400, as those are the optimal kits we have for each platform right now, and they're similar in terms of pricing.
CPU Benchmarks
CPU: Ultra Preset
Starting with 'Ultra' preset testing at 1080p, we find that the Core i9-13900K is the fastest CPU, pushing the RTX 4090 to 242 fps on average, with 177 fps for the 1% lows.
This was just 2% faster than the Ryzen 9 7950X when comparing the average frame rate, though it was 6% faster when comparing 1% lows.
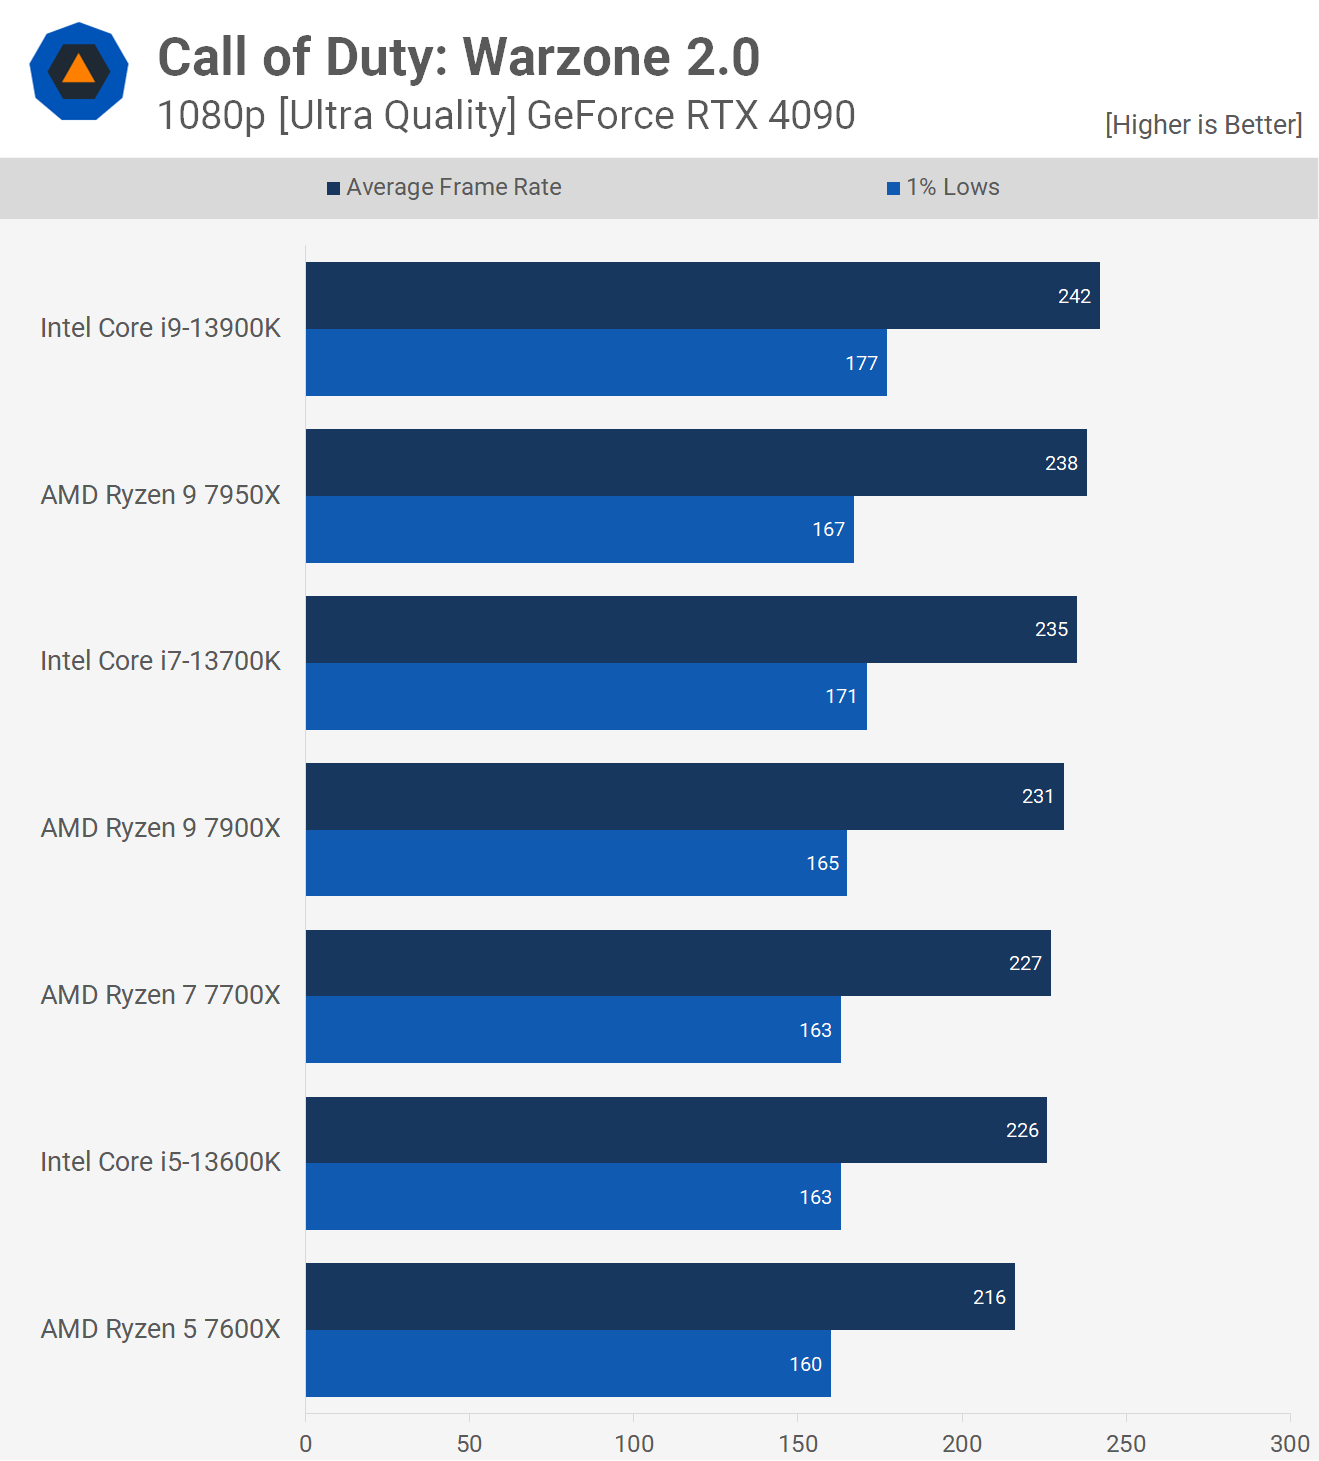
From the 13600K to the 13900K we're looking at a mere 7% difference in performance for the average frame rate and 9% for the 1% lows, so even though the Core i9 is faster, the margins aren't huge.
The Ryzen 7700X, 7900X and 7950X all stood between the 13600K and 13900K. It was just the 7600X that was slower, trailing the 13600K by a 4% margin, though 1% lows dropped by an insignificant margin. All CPUs allowed the RTX 4090 to render more than 200 fps on average which is good to see.

Increasing the resolution to 1440p resulted in a hard GPU bottleneck at around 200 fps with similar 1% lows across the board. So even with the GeForce RTX 4090, if you're for some reason playing Warzone 2.0 using ultra quality settings, provided you have a fairly modern CPU, you will almost always be GPU limited.

This is also true for 4K resolution gameplay, of course, as we run into a serious GPU bottleneck limiting the average frame rate with the RTX 4090 to 145 fps with 1% lows for 77 - 79 fps. That being the case, let's check out the more competitive 'Minimum' quality preset.
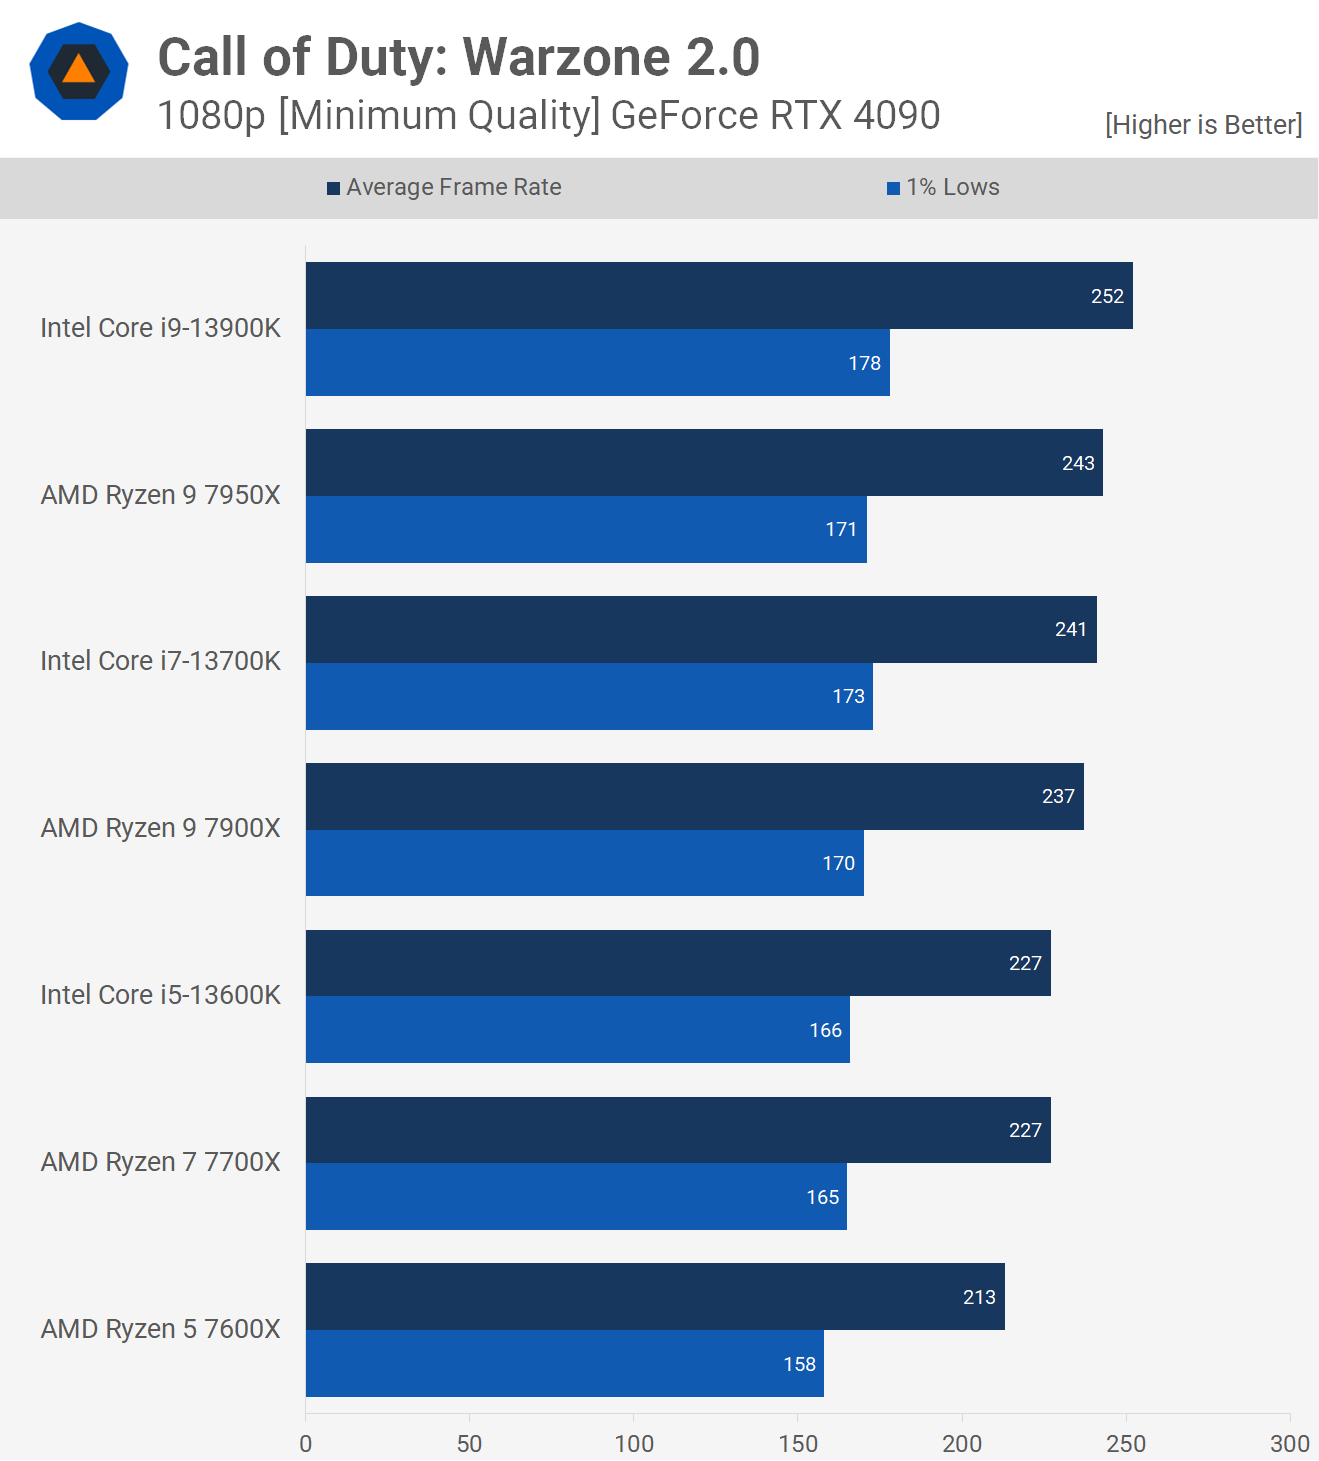
CPU: Minimum Preset
For those looking to drive maximum frame rates and get that visual competitive advantage, the minimum preset works well, though we're sure tweaking a few of the settings will be optimal.
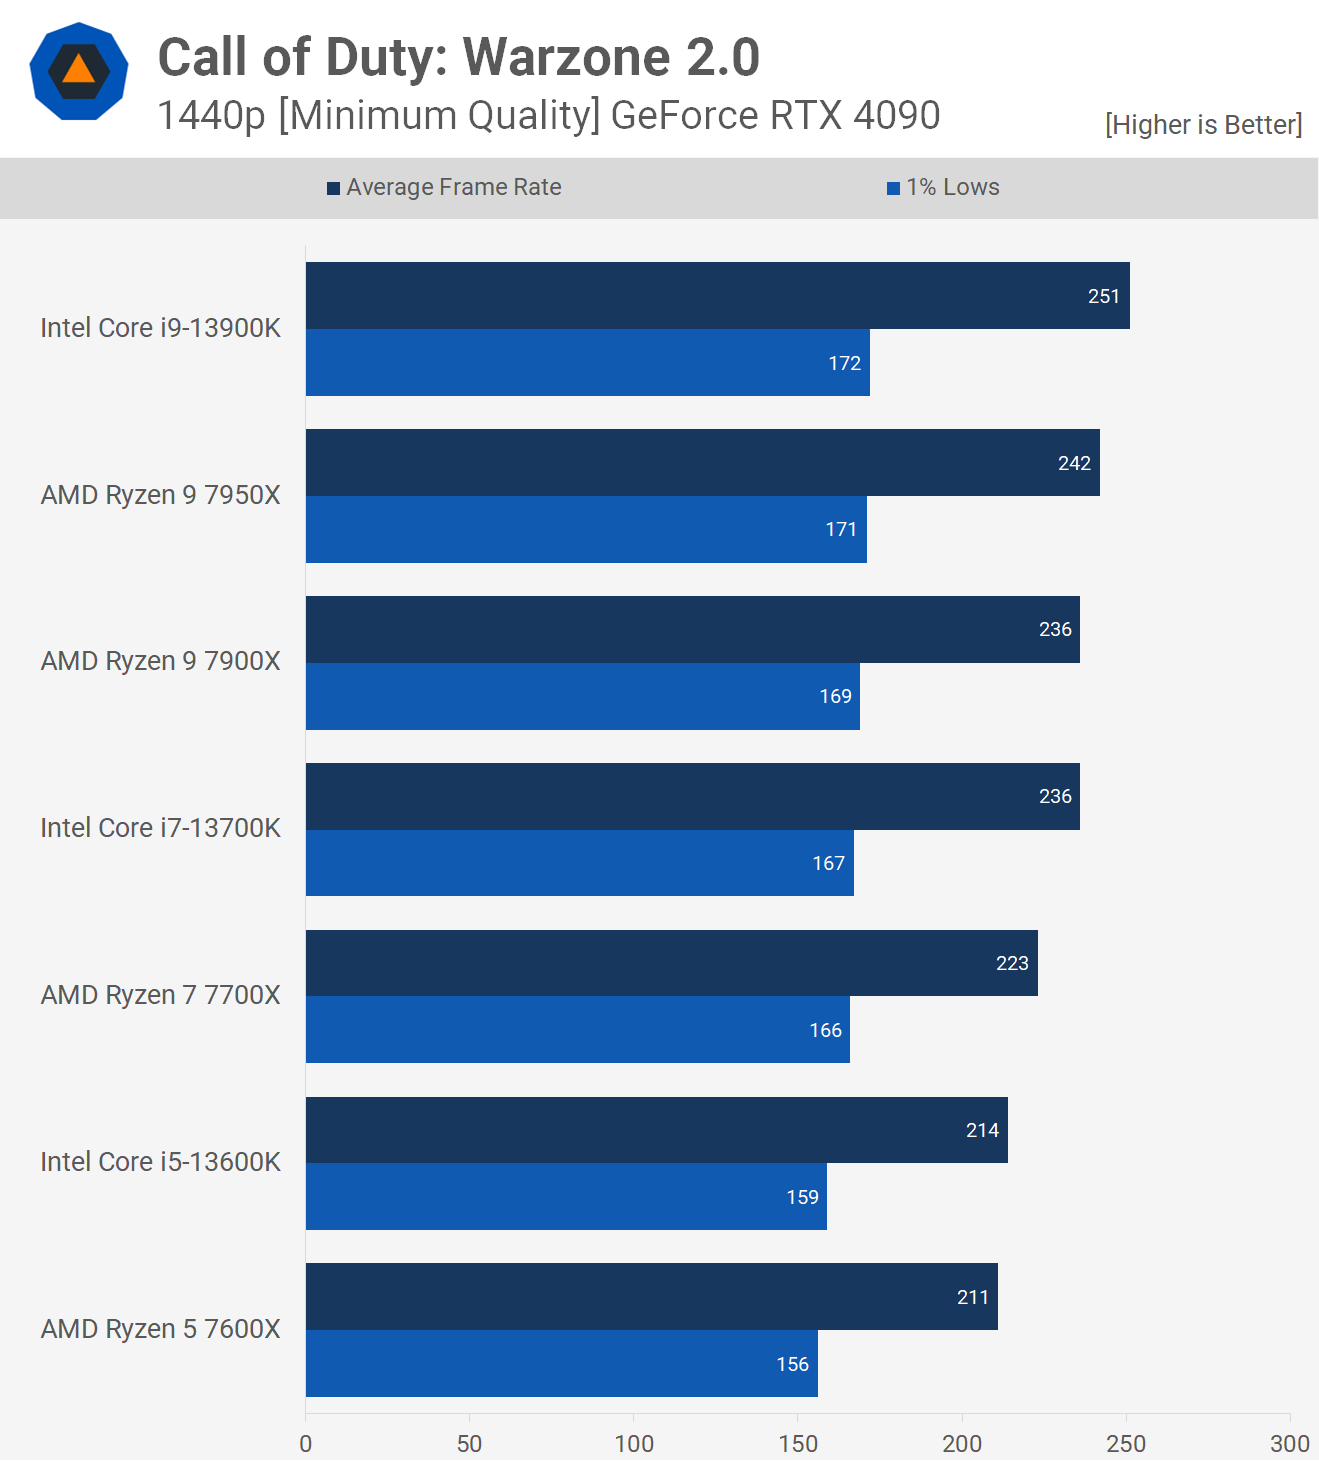
Here we find yet again that at 1080p the 13900K is the performance leader, pushing 252 fps on average, making it 4% faster than the Ryzen 7950X. Meanwhile, the Ryzen 9 processors matched the 13700K, while the 7700X only managed to match the 13600K. They did so with 227 fps, making both parts 10% slower than the 13900K.
The 7600X disappoints here with 213 fps making it 6% slower than the 13600K and 15% slower than the 13900K.
Increasing the resolution to 1440p has virtually no impact on the performance of AMD Zen 4 processors, though we do see a hit to the 13700K and 13600K along with the 1% lows of the 13900K.
The 13900K remains ahead of the 7950X by a 4% margin, though it's a mere percent faster when comparing 1% lows. The 7900X and 13700K are now neck and neck, while the 7700X is slightly faster than the 13600K, and the 7600X is able to match the Core i5 processor.
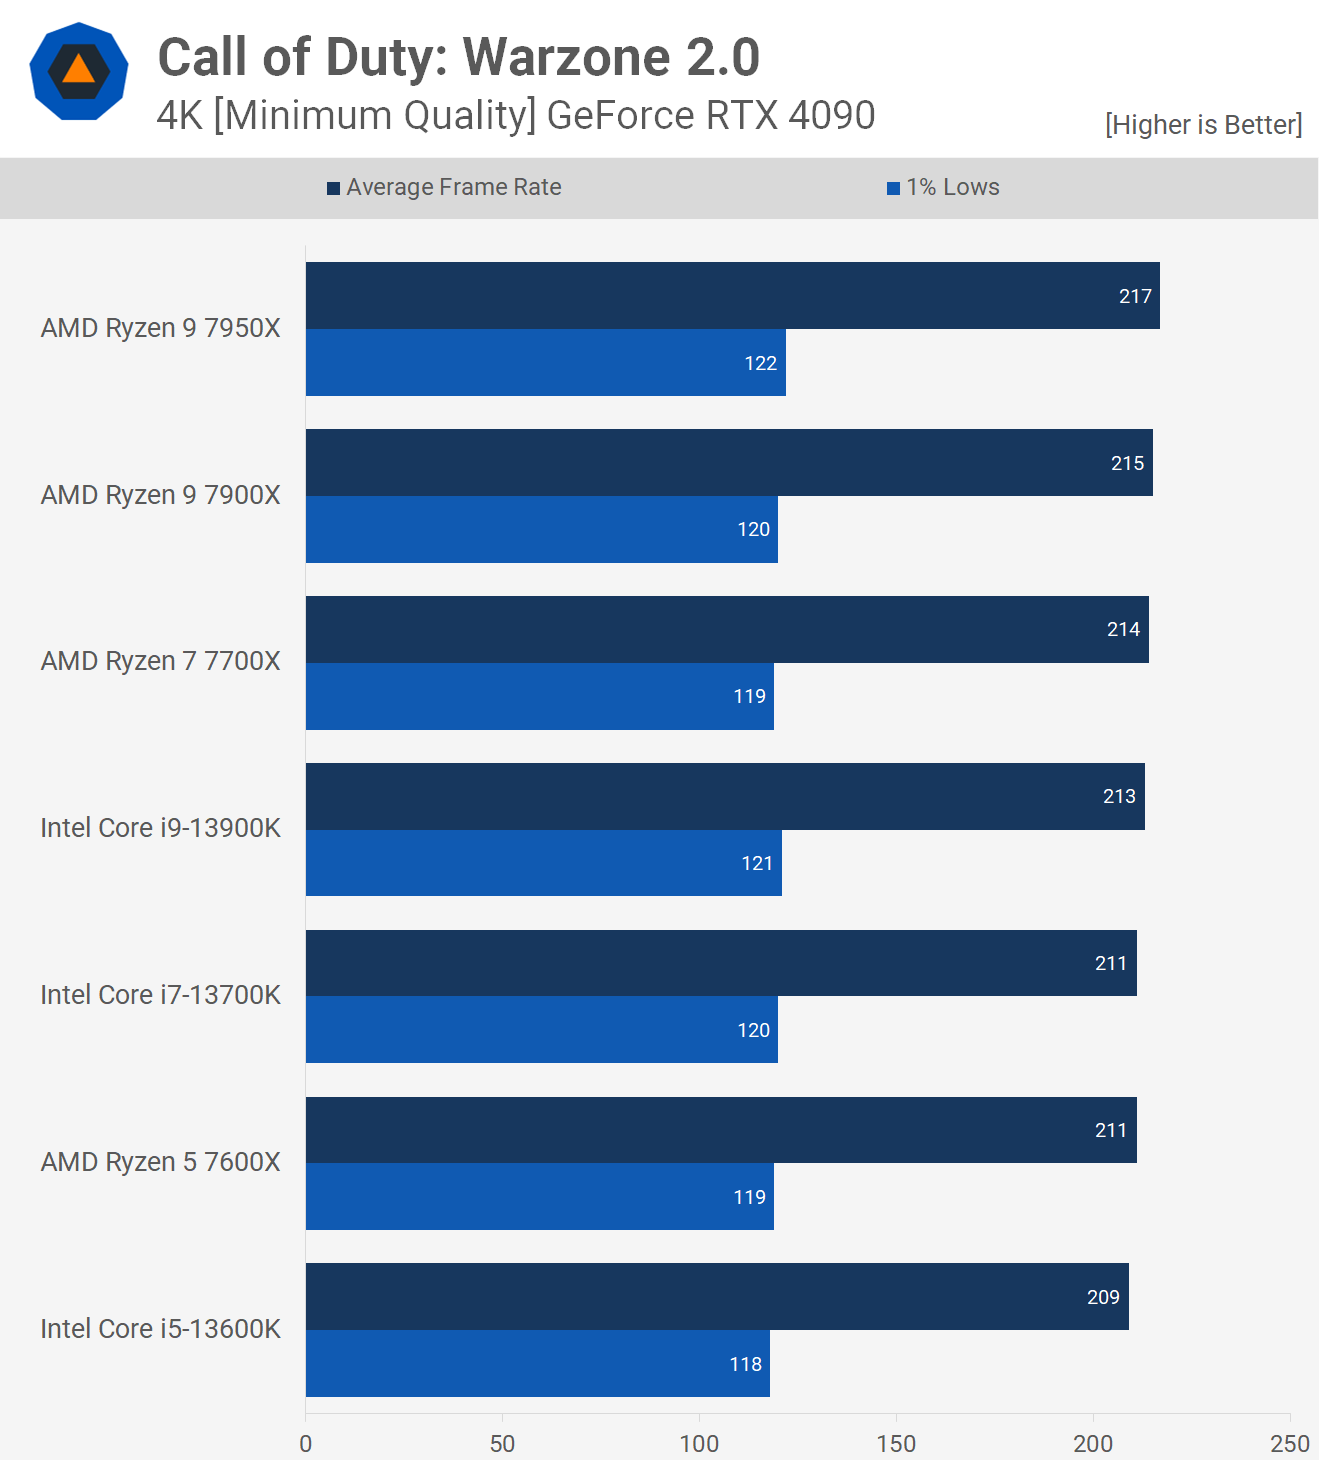
At 4K resolution we are primarily GPU limited, even with the minimum quality settings. So if you're gaming at 4K, Zen 4 and Raptor Lake will deliver comparable levels of performance, based on what we're seeing here with the RTX 4090.
GPU Benchmarks
GPUs: Ultra Preset
For the GPU benchmarks we have an assortment of GPUs because we couldn't test all the graphics cards we would have wanted. Using the ultra quality preset at 1080p we unsurprisingly find the RTX 4090 at the top of our graph, beating the RTX 4080 by a slim 12% margin due to the mostly CPU-limited test conditions.
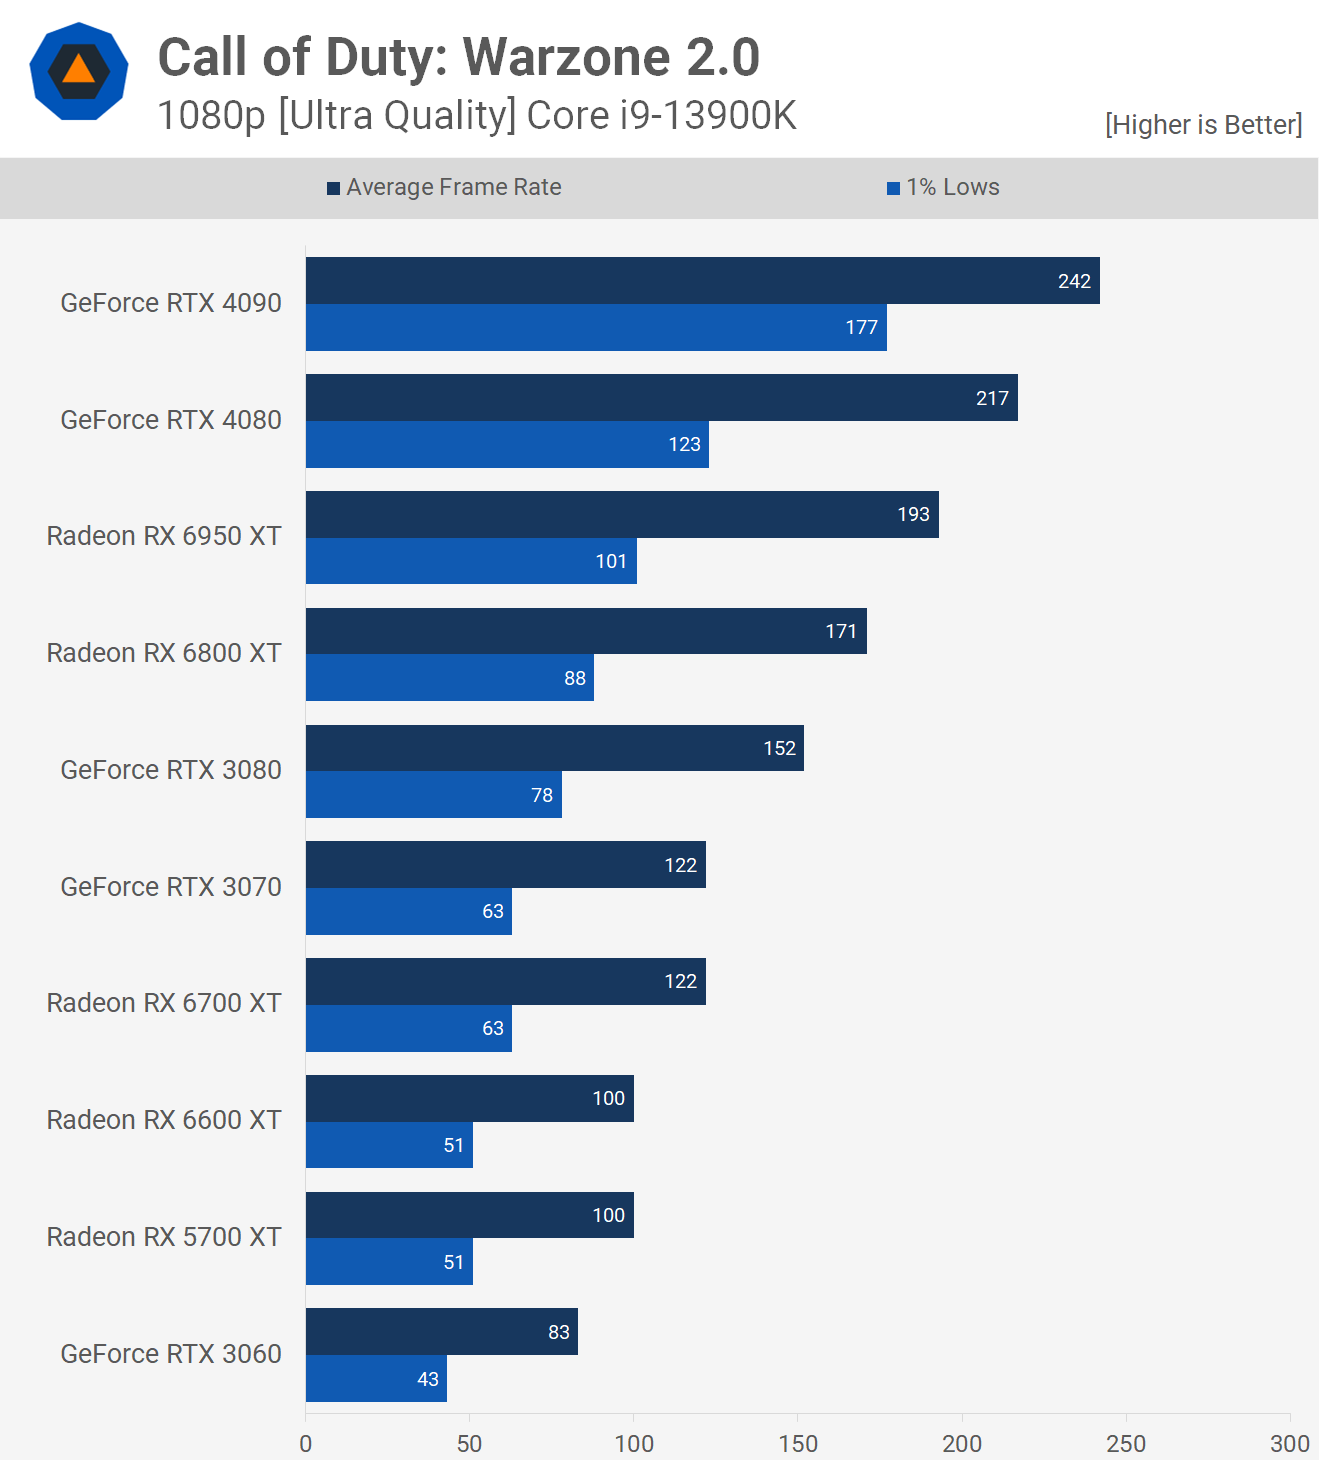
The RTX 4080 was also just 12% faster than the 6950 XT as the Radeon GPU rendered 193 fps, making it 13% faster than the 6800 XT.
As we found in our previous Modern Warfare 2 testing, Radeon GPUs excel in this title, and we're seeing more of that here as the 6800 XT easily beat the RTX 3080 by a 13% margin, while the 6700 XT matched the RTX 3070.
Then we see that both the Radeon 6600 XT and 5700 XT smoked the RTX 3060 by a 20% margin.
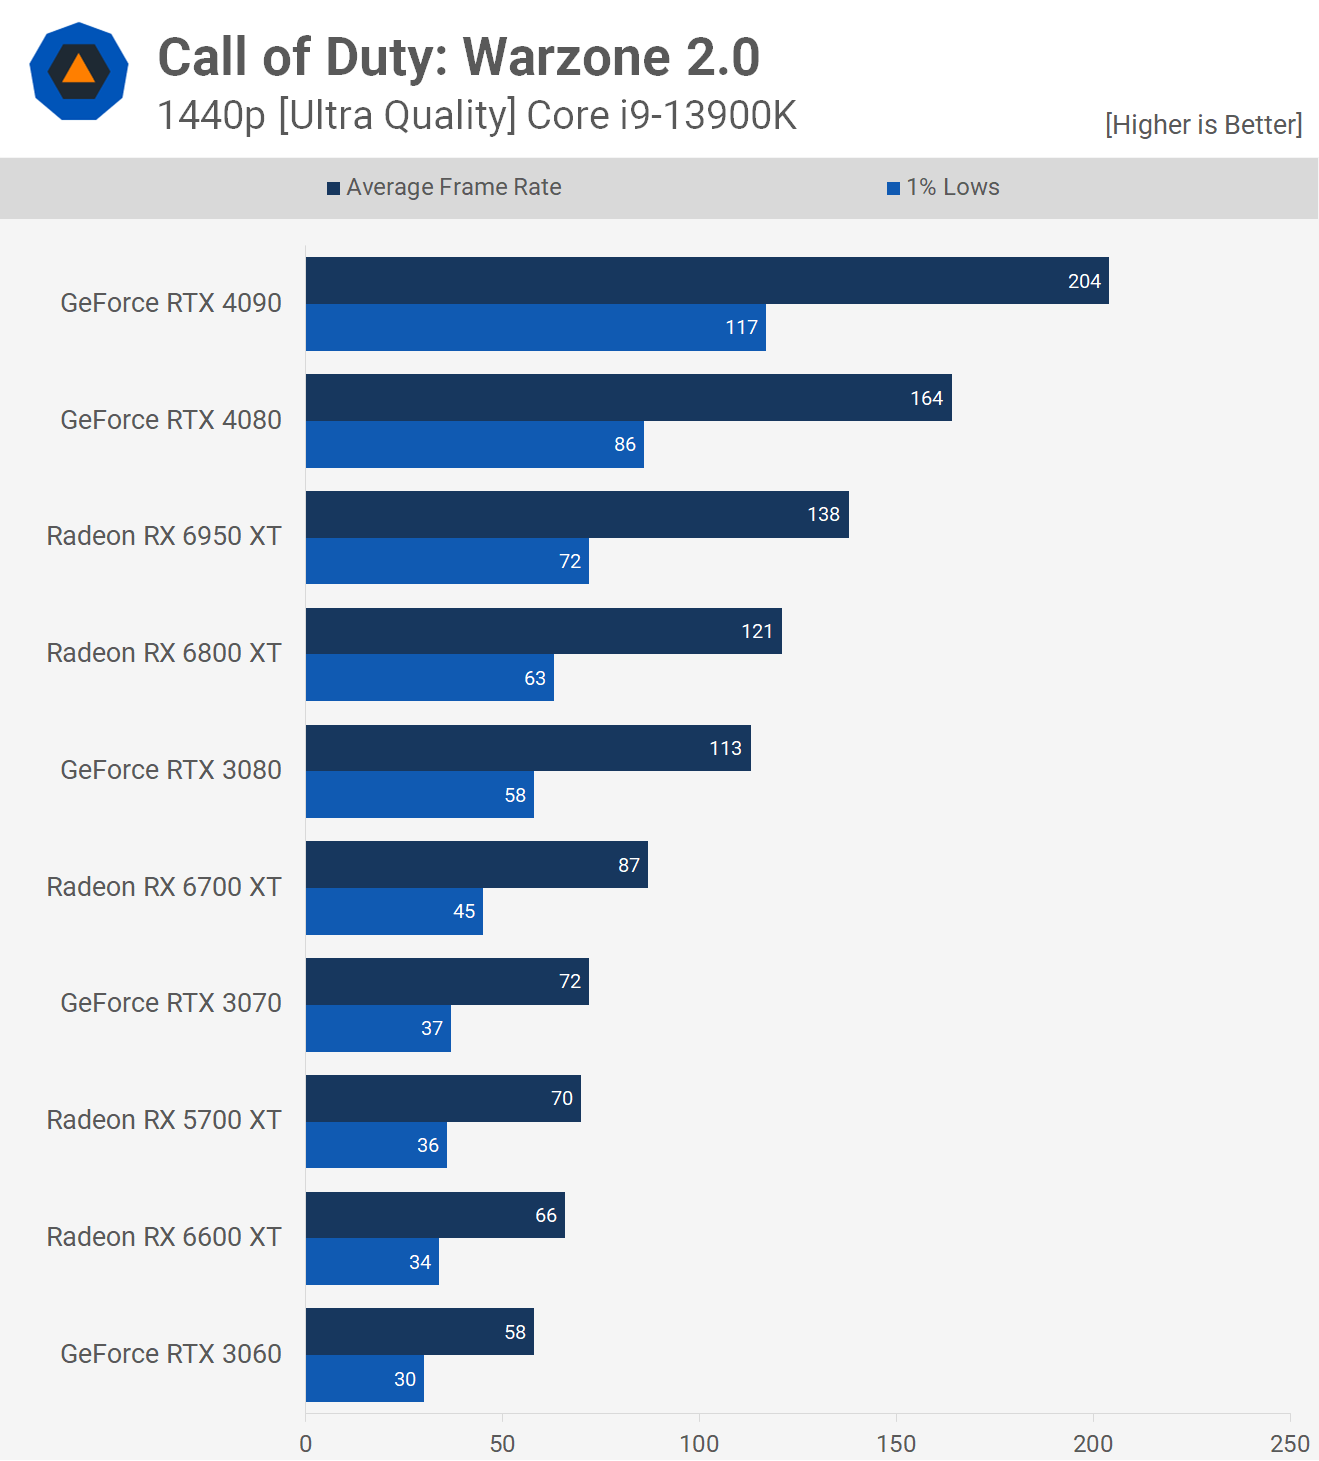
Jumping up to 1440p affords the GeForce RTX 4090 a little more breathing room and now the Ada Lovelace flagship is 24% faster than the 4080 and 48% faster than the 6950 XT.
The Radeon 6800 XT is now also just 7% faster than the RTX 3080, though the 6700 XT was able to pull out a good lead over the RTX 3070.
Shockingly, the 5700 XT was seen delivering RTX 3070-like performance, easily beating the RTX 3060, this time by a 21% margin.
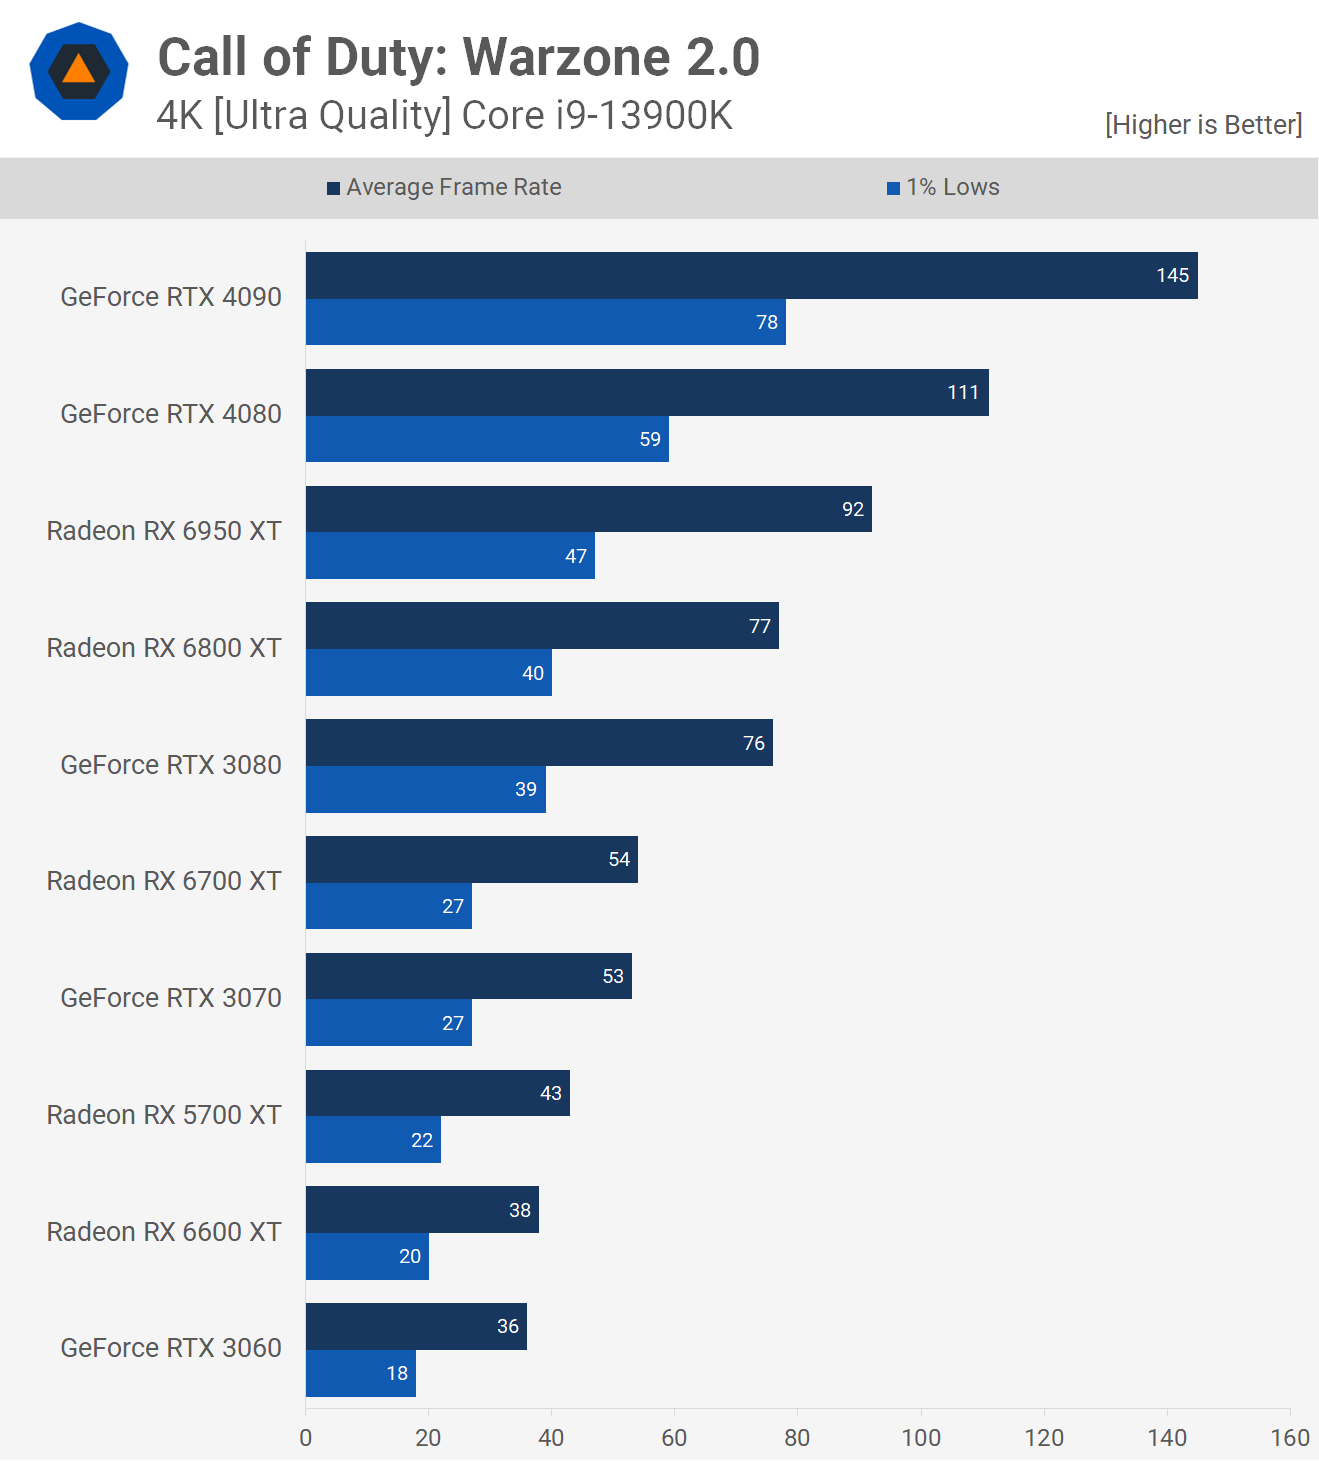
Then at 4K, the RTX 4090 is seen to be 31% faster than the RTX 4080 and almost 60% faster than the 6950 XT. The RTX 3080 finally caught the 6800 XT, while the RTX 3070 matched the 6700 XT. The old mid-range Radeon 5700 XT was still roughly 20% faster than the RTX 3060.
GPUs: Minimum Preset
Now with the minimum quality settings loaded, please note the game was completely reset each time when going from Ultra to Minimum (or vice versa) as a full game restart is required to re-compile shaders and load all settings...

At 1080p we can see that the Radeon 6950 XT is able to match the GeForce RTX 4080 and RTX 4090 due to the CPU bottleneck. The 6800 XT also matched the average frame rate of RTX 40 series GPUs, though 1% lows were considerably lower.
This meant that the 6800 XT beat the RTX 3080, while the 6700 XT beat the RTX 3070. Then we see that the 6600 XT was 30% faster than the RTX 3060, while the 5700 XT was 22% faster.

Increasing the resolution to 1440p helps to reduce the CPU bottleneck, but even so the RTX 4090 was unable to beat the 4080, even with the Core i9-13900K onboard.
Meanwhile, the Radeon 6000 series had no issue beating the GeForce 3000 series with the 6800 XT knocking off the RTX 3080 by a 13% margin.

Finally we see that the RTX 4090 is 20% faster than the 4080 at 4K resolution, while the 6950 XT was 12% slower than the 4080. The Radeon 6800 XT was 10% faster than the RTX 3080, the 6700 XT matched the RTX 3070, and the 5700 XT embarrassed the RTX 3060 by more than a 20% margin in this scenario.
Wrap Up
Having spent so much time testing Warzone 2.0, we wish we had more data to show for our efforts, but that's just how it goes with multiplayer titles. For GPU testing, the built-in benchmark works well enough, and we don't believe the margins have changed from our original coverage, even with a few new driver updates.
For CPU testing, though, this really has to be done in-game, and that's what we'll be doing for our big head-to-head CPU benchmarks moving forward. But for day-one CPU results, Warzone 2.0 isn't practical as any game update will likely break the results, which would force us to update all our data each time. When testing just a few CPUs this is not a problem, but when you're doing a round up with over 20 processor configurations it's just not feasible.
For the absolute best performance in Warzone 2.0 the recipe is rather obvious right now: the Core i9-13900K + GeForce RTX 4090 is the way to go. Bang for your buck though, the Core i5-13600K with something like the Radeon RX 6800 XT would be a killer combo given the 6800 XT can be had for under $600 these days, and was generally faster than the RTX 3080.
As we found in our 40+ GPU benchmark of Modern Warfare 2, the old Radeon RX 5700 XT is a weapon in this game and nothing has changed with Warzone 2. At 1440p using the ultra quality settings it was just 3% slower than the RTX 3070 and just 14% slower using the minimum quality preset, chucking out over 120 fps on average.
The RTX 3060 is disappointing in this titles considering how much it costs, and the Ryzen 5 7600X was also disappointing, though certainly not to the same degree. Still, trailing the 13600K by ~7% wasn't nice to see and while we're sure 7600X owners will be happy with the performance, when GPU limitations are removed the 13600K is the superior performer here.
Shopping Shortcuts:
Recommend
About Joyk
Aggregate valuable and interesting links.
Joyk means Joy of geeK