
2

一次mongodb cpu很high的解决方法
source link: https://bajie.dev/posts/20220721-mongodb_cpu/
Go to the source link to view the article. You can view the picture content, updated content and better typesetting reading experience. If the link is broken, please click the button below to view the snapshot at that time.
一次mongodb Cpu很high的解决方法
2022-07-21
2 分钟阅读
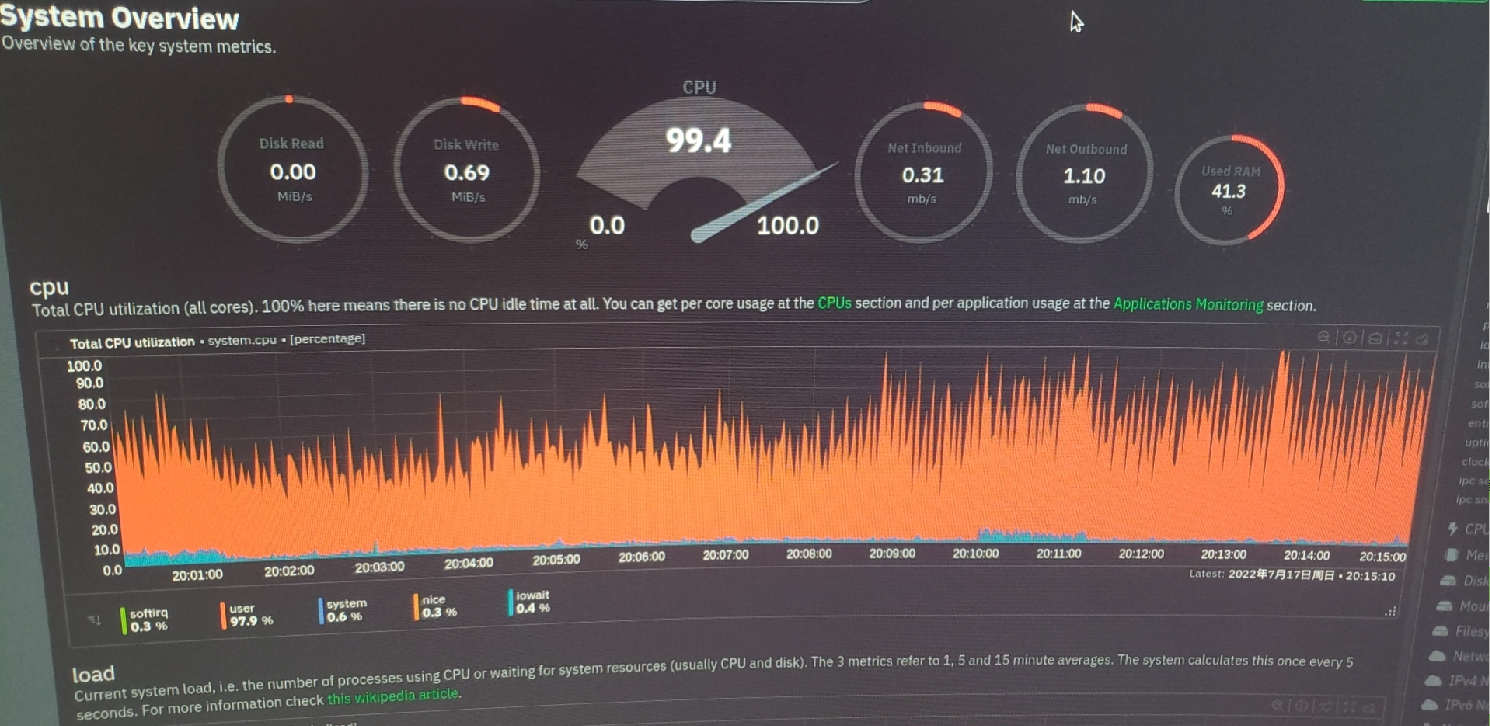
接到同事的通知,说mongodb的cpu很高,下不去,看有什么办法。
看了一下图,cpu都99.4%了,确实很高:
登上机器,首先去看mongod的log,都试如下的查询,都很慢:
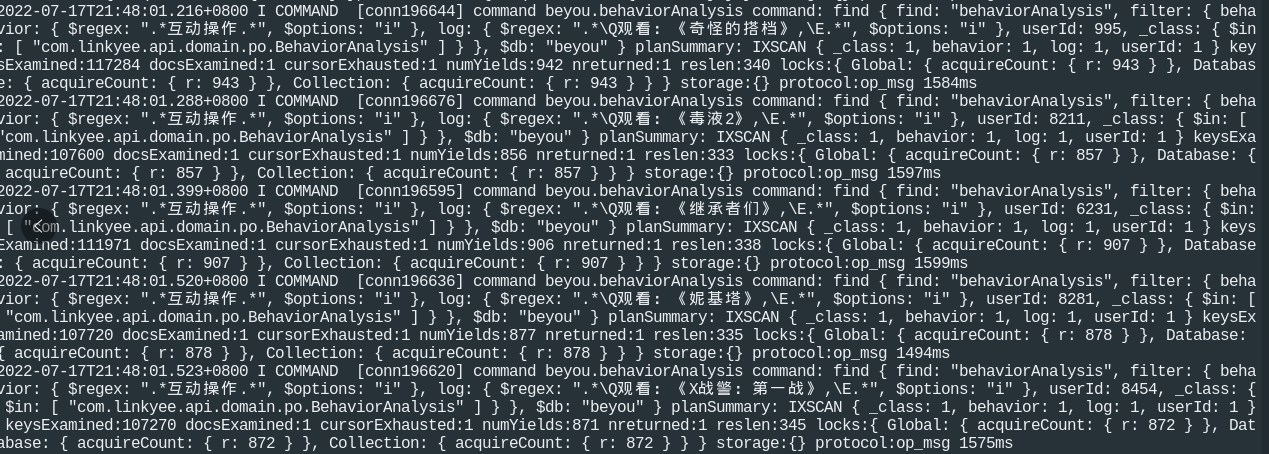
copy出一条来,备用
2022-07-17T21:30:42.556+0800 I COMMAND [conn196670] command beyou.behaviorAnalysis command: find { find: "behaviorAnalysis", filter: { behavior: { $regex: ".*互动操作.*", $options: "i" }, log: { $regex: ".*\Q观看:《罗马的房子》,\E.*", $options: "i" }, userId: 7345, _class: { $in: [ "com.linkyee.api.domain.po.BehaviorAnalysis" ] } }, $db: "beyou" } planSummary: IXSCAN { _class: 1, behavior: 1, log: 1, userId: 1 } keysExamined:111564 docsExamined:2 cursorExhausted:1 numYields:890 nreturned:2 reslen:571 locks:{ Global: { acquireCount: { r: 891 } }, Database: { acquireCount: { r: 891 } }, Collection: { acquireCount: { r: 891 } } } storage:{} protocol:op_msg 2268ms
fallback
发现确实很慢啊,op_msg 居然要2268ms,但是mongodb的数据目录总共才6G多,不客观啊。
看看表结构和索引:
> show dbs;
admin   0.000GB
beyou   0.063GB
config  0.000GB
local   0.000GB

> use beyou;
switched to db beyou

> show collections;
activityLog
behaviorAnalysis

> db.behaviorAnalysis.find({},{_id:0}).limit(1);
{ "name" : "812304163055734784", "createTime" : ISODate("2022-02-19T12:46:44.360Z"), "behavior" : "互动操作", "log" : "加入看单:《爱的迫降》", "userId" : 2, "_class" : "com.linkyee.api.domain.po.BehaviorAnalysis" }

> db.behaviorAnalysis.getIndexes();
[
        {
                "v" : 2,
                "key" : {
                        "_id" : 1
                },
                "name" : "_id_",
                "ns" : "beyou.behaviorAnalysis"
        },
        {
                "v" : 2,
                "key" : {
                        "_class" : 1,
                        "behavior" : 1,
                        "log" : 1,
                        "userId" : 1
                },
                "name" : "_class_1_behavior_1_log_1_userId_1",
                "ns" : "beyou.behaviorAnalysis"
        }
]
发现表结构不复杂,索引呢有两个,一个缺省的单字段索引_id,另一个是多字段索引,4合一的( _class、behavior、log、userId )
继续,来看看查询:
find {
  find: "behaviorAnalysis",
  filter: {
      behavior: { $regex: ".*互动操作.*", $options: "i" },
      log: { $regex: ".*\Q观看:《罗马的房子》,\E.*", $options: "i" },
      userId: 7345,
      _class: { $in: [ "com.linkyee.api.domain.po.BehaviorAnalysis" ] }
  },
  $db: "beyou" }
  planSummary: IXSCAN { _class: 1, behavior: 1, log: 1, userId: 1 } keysExamined:111564
planSummary里,IXSCAN是查了索引,但是keyExamined居然有111564个,太多了吧。
再看看索引,明显4合一的效率有问题。
那就简单了,删掉这个4合一的索引,新建一个userId的索引,既然叫userId,那推测它是唯一的,重建索引需要后台执行,并且在业务不繁忙的时候再跑
db.behaviorAnalysis.createIndex({"userId":1},{"name":'idx_userId',background:true,unique:true});
同事执行的时候报错:
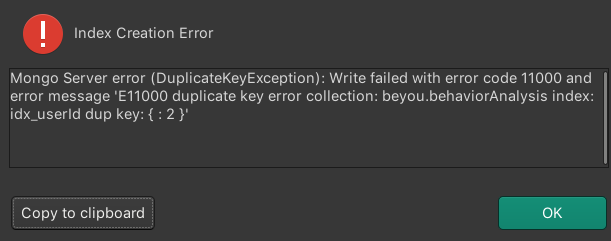
居然key重复了,那就把 unique:true 去掉了再执行,就成功了。
然后cpu就立竿见影,从100%降低到了2.8%
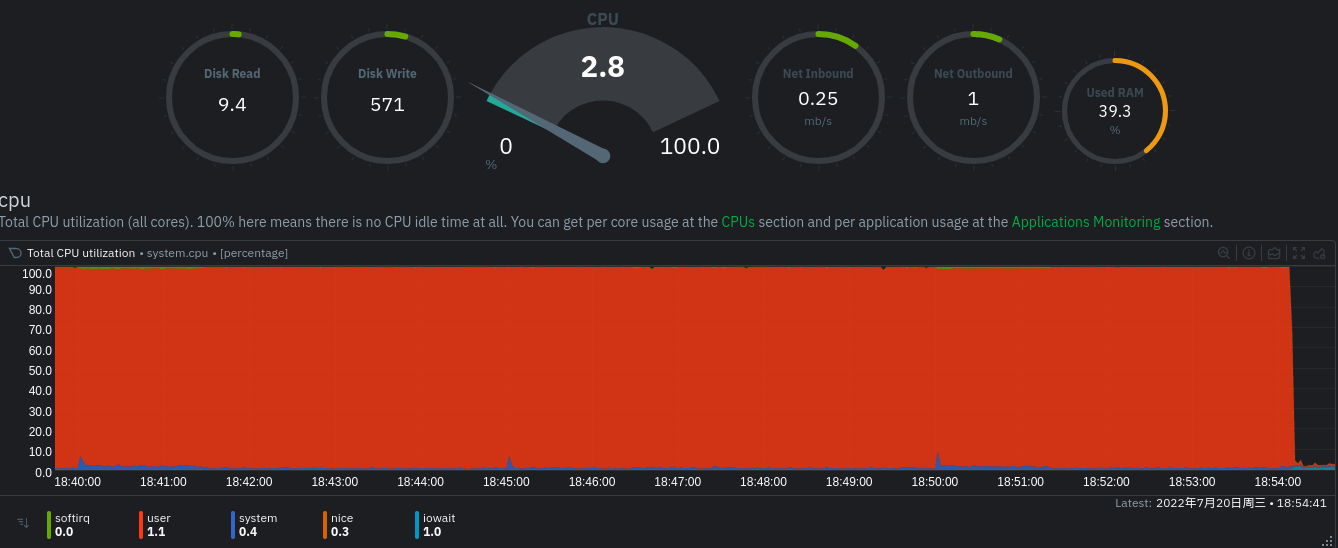
over,如果再遇到瓶颈,估计就只能采用分片大法了。
Recommend
About Joyk
Aggregate valuable and interesting links.
Joyk means Joy of geeK