

In the Power BI whirlpool — understanding circular dependencies
source link: https://towardsdatascience.com/in-the-power-bi-whirlpool-understanding-circular-dependencies-316d7f664d94
Go to the source link to view the article. You can view the picture content, updated content and better typesetting reading experience. If the link is broken, please click the button below to view the snapshot at that time.
In the Power BI whirlpool — understanding circular dependencies
Circular dependency error is one of the most annoying things in Power BI data modeling! Learn why this is happening and how to avoid it
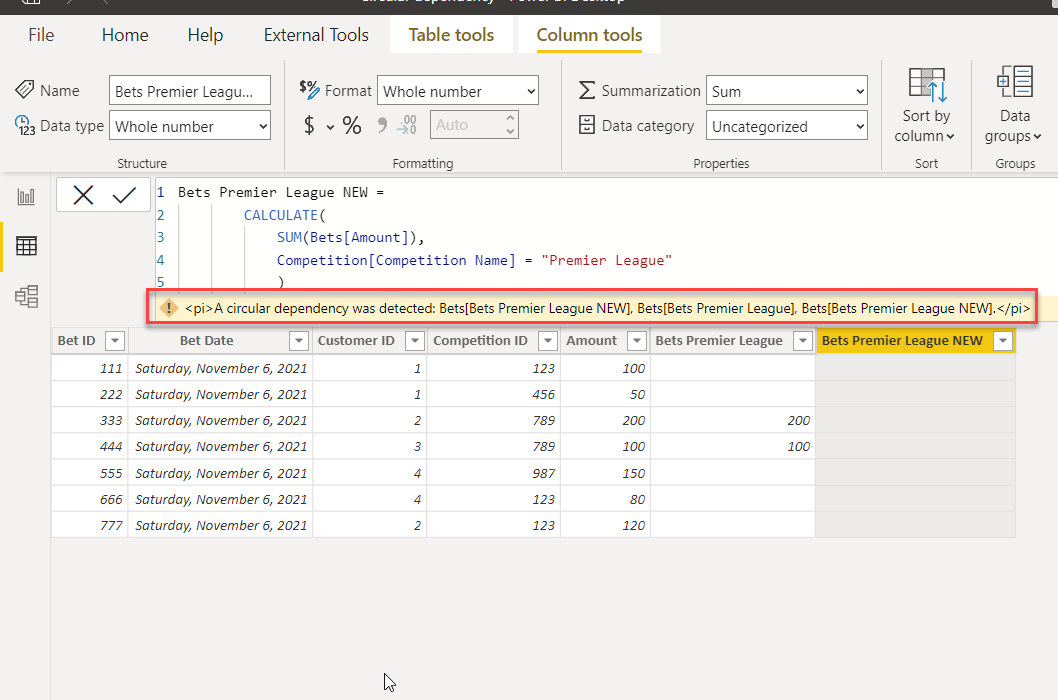
Image by author
As you may have already understood reading my previous articles, creating a Star-schema doesn’t necessarily mean that your data modeling tasks are completed. There are many more aspects to be aware of — and, while you can sneak without fine-tuning each and every detail — some of these “details” are of course more important and require better understanding.
One of the “details” that can easily draw you into the “whirlpool”, is called — circular dependency! I’m quite sure that all of us were at least once (hopefully it was only once) annoyed with the message: “A circular dependency was detected…”
But, before we proceed to explain what is a circular dependency and why you should care about it, let’s first understand…
What is a dependency at all…
Dependency is, as the name suggests, a fact that one thing (or event) depends on the behavior of some other.
I’ll give you a simple example: let’s say that the bus ticket prices depend, among other factors, on the fuel price. This means, that if the fuel price changes, the bus ticket price will also change.
Bus Ticket Price = [Fuel Price] + [Factor A] + [Factor B] + ... [Factor N]
This is a so-called regular dependency, which exists in every programming language (and in everyday life too). However, what happens if the bus ticket price changes? Does that necessarily mean that fuel price will also change? No! Bus ticket price IS dependent on the fuel price, but not the other way round!
Why did I ask that? Because there are certain situations when there CAN be a mutual dependency between two facts or events.
Let’s imagine that you want to reduce the shipping costs for the fuel barrels. One of the potential steps to achieve this would be to reduce the fuel cost (because fuel cost impacts overall shipping costs). So, to be able to reduce the shipping costs, we need to reduce the fuel cost. At the same time, in order to reduce the fuel cost, we need to reduce the shipping costs of that fuel. And, this is what circular dependency is…
If fact A depends on fact B, while at the same time fact B also depends on fact A, we are talking about the circular dependency!
Fine, now that we know what circular dependency is, let’s examine why it occurs in Power BI, and how we can eliminate it. As you may assume, Marco and Alberto have already written an excellent article about the internals of circular dependencies in DAX, so I encourage you to go and read it to get a better understanding of this “feature”.
Let’s run a very basic use case, and create a computed column in our data model with the help of CALCULATE() function.
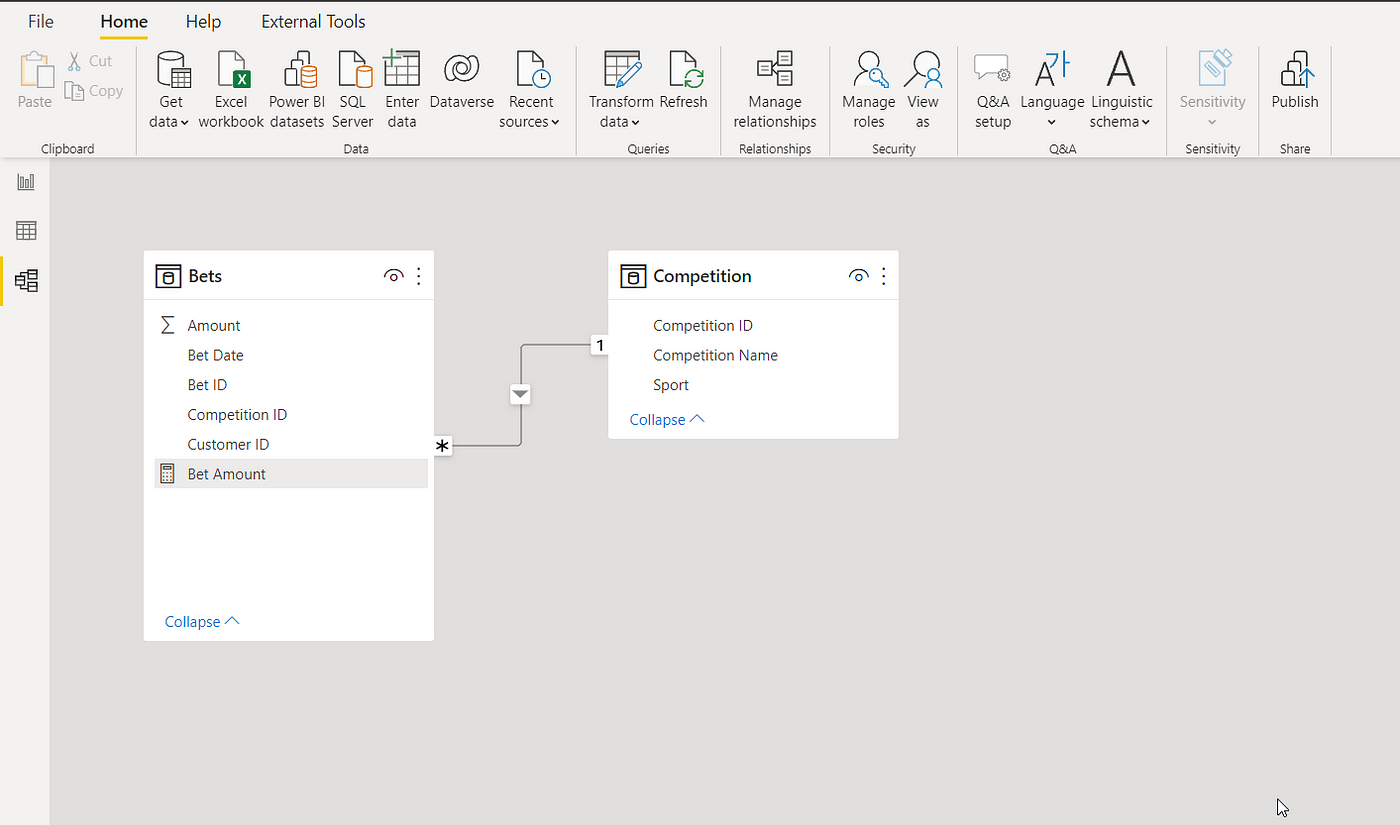
Image by author
As you may see in the illustration above, I have a simple data model, consisting of two tables: fact table Bets, which stores the data about the bets made by our customers; and the Competition dimension table, which holds the attributes of the competition.
Let’s say that I want to enrich my data model with the additional computed column, which will calculate the Bet amount only for the competition Premier League. Easy job!
Bets Premier League =
        CALCULATE(
            SUM(Bets[Amount]),
            Competition[Competition Name] = "Premier League"
        )
And, once applied, here is how my Bets table looks:
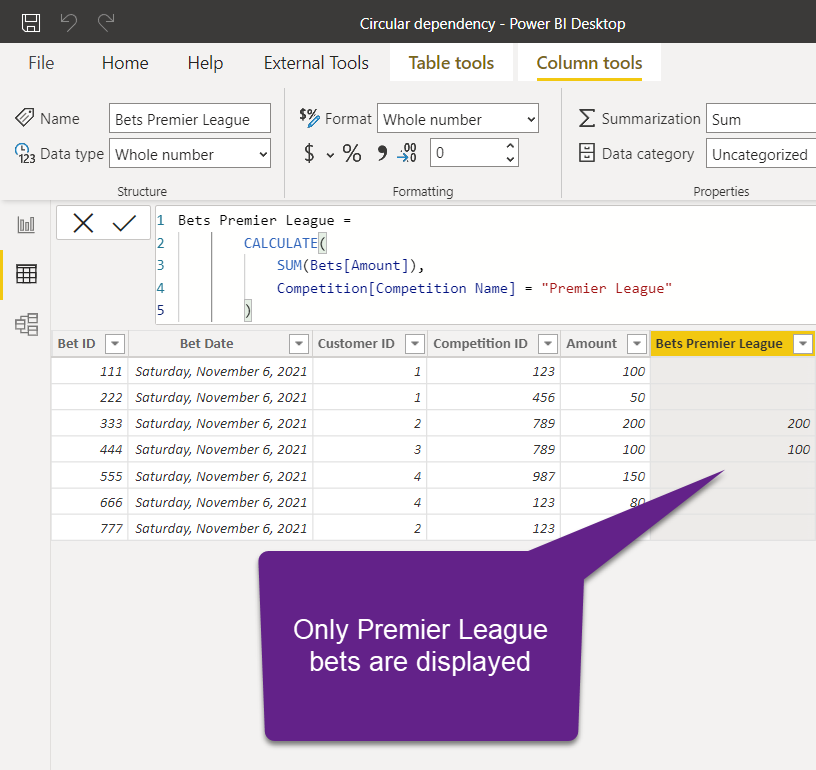
Image by author
That’s cool, right? We are sure that this works, so let’s go and try to create another identical column:
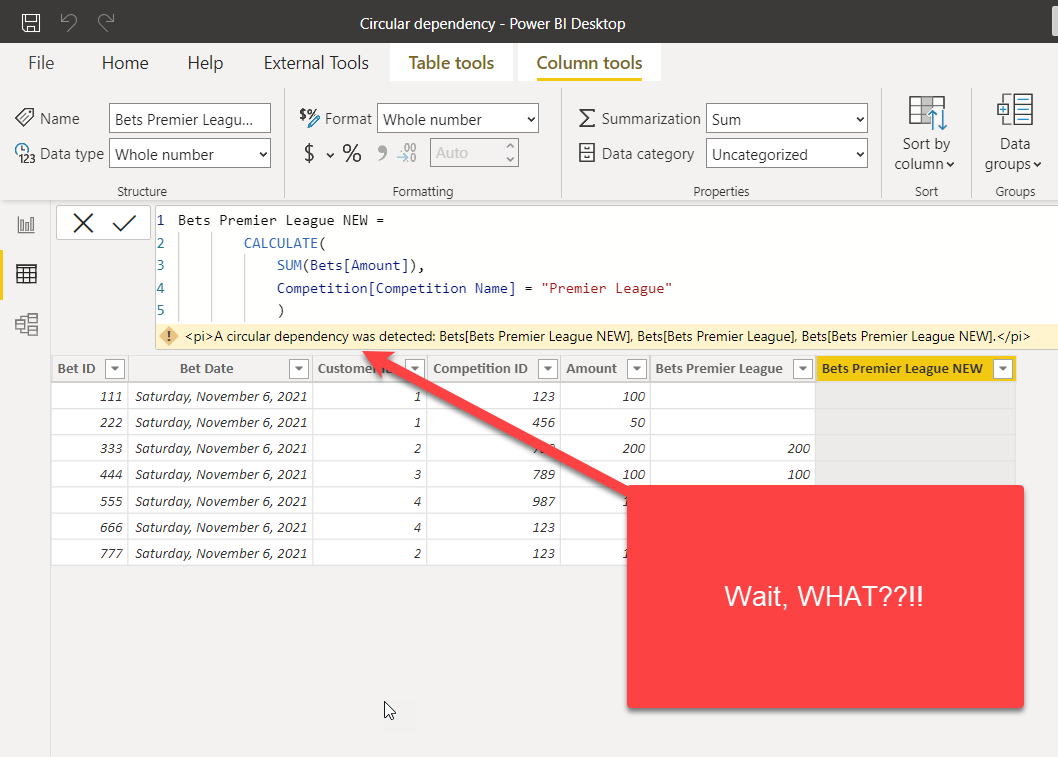
Image by author
Wait, what?! Isn’t that the formula that perfectly worked a minute ago?
Let’s delete both new columns from our data model, switch to DAX Studio, and try to understand the query plan that Formula Engine generated:

Image by author
Just pay attention to the Line 1 of the logical query plan, which informs us that our new column depends on all the existing columns from the Bets table! We would expect that the new column Bets Premier League depends on the CompetitionID, which is the foreign key to our Competition table, where we are applying our filtering. But, that’s not the case. Why is that happening?!
As we are creating a computed column, our expression is being evaluated row by row (row context). When we use CALCULATE inside a row context, the function applies a context transition and therefore we have a filter on all the columns in the scope!
To put it simple, this is a pseudo-code for our calculation:
Calculation: Bet Amount
--Filters
Bets[Bet ID] = 333
Bets[Bet Date] = 2021-11-06
Bets[Customer ID] = 2
Bets[Competition ID] = 789
Bets[Amount] = 200
And, that works fine, as you might have seen. But, what happens when we want to create another column with the same formula:
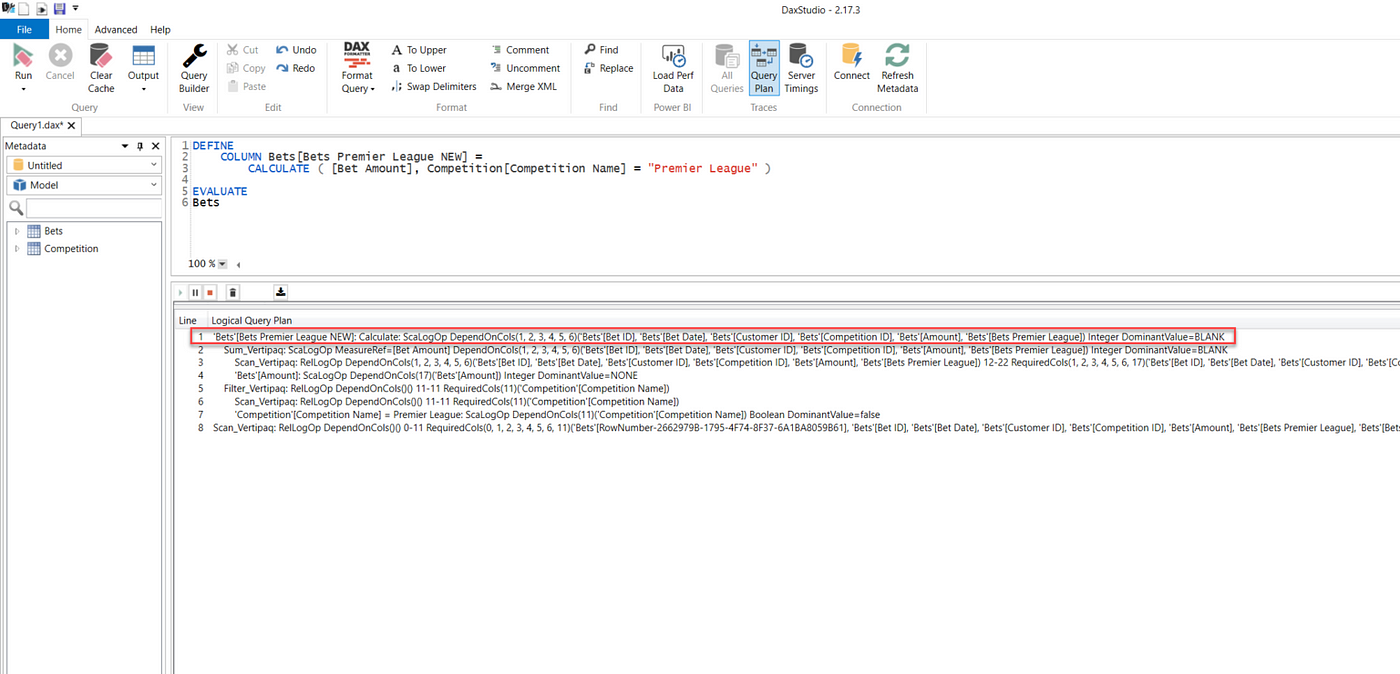
Image by author
As in the previous case, the NEW column depends on all the original columns from the Bets table — however, it additionally depends also on the Bets Premier League column we previously created! As this column is computed at the refresh time, Power BI can’t resolve this dependency and complains about circular dependency.
To put it simple, if you were able to create these two columns in your data model, this is what would happen once you refresh the dataset:
Column Bets Premier League will be dependent on all the source columns + Bets Premier League NEW column. On the other side, the Bets Premier League NEW column will be dependent on all the source columns + the Bets Premier League column. And, this is the reason why Power BI refuses to create a model like this, with circular dependency between the two computed columns.
This problem can be easily solved by extending the original column expression and using REMOVEFILTERS function to remove all the filters applied because of the context transition:
Bets Premier League NEW =
        CALCULATE(
            SUM(Bets[Amount]),
            Competition[Competition Name] = "Premier League",
            REMOVEFILTERS(Bets[Bets Premier League])
            )
Once applied, Power BI doesn’t complain anymore about the circular dependency and NEW column becomes a part of the data model:
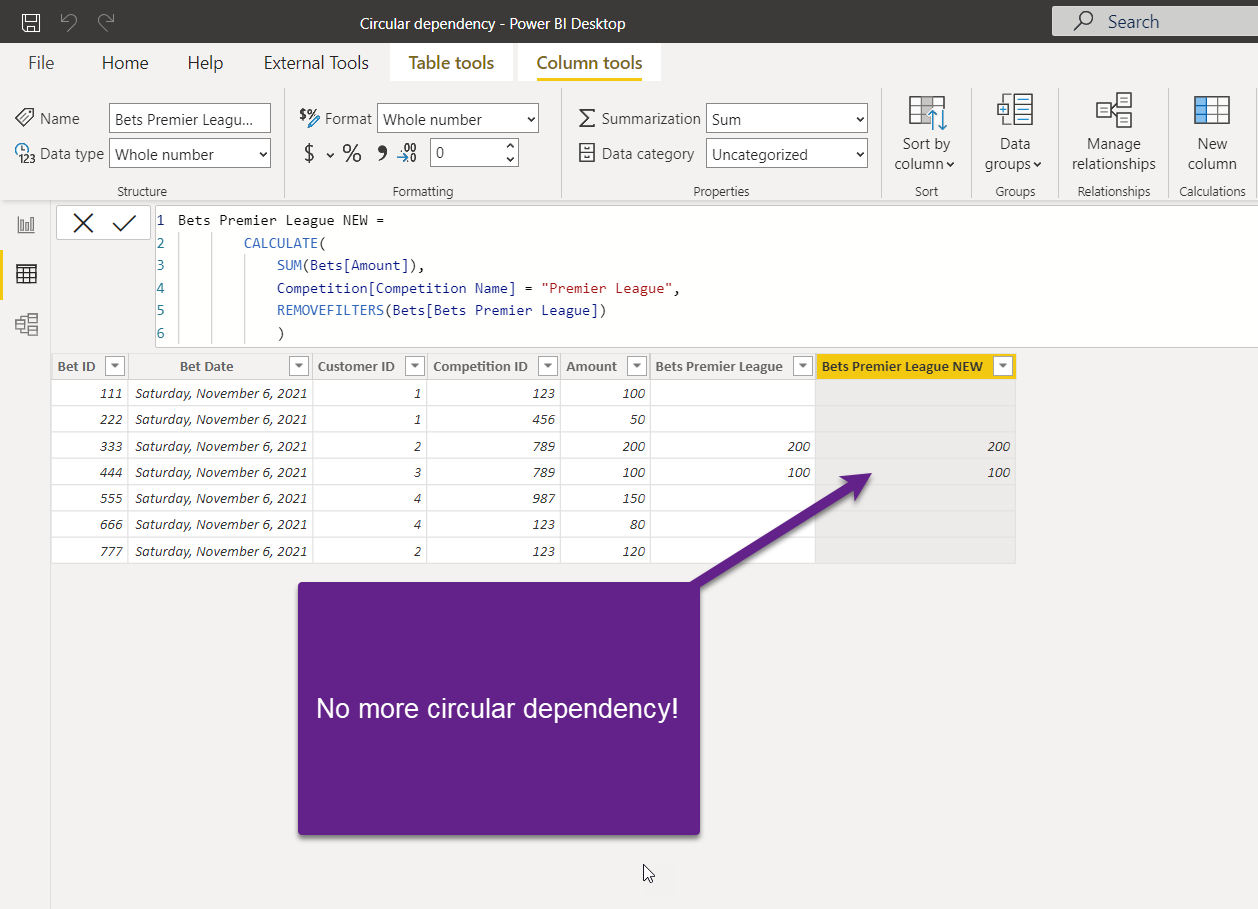
Image by author
Ok, we solved this challenge, but let me show you what would happen if I tried to create a computed column with the same formula in the dimension table, instead of within the fact table.
I’ll go to the Competition table and paste the code for the Bets Premier League computed column:
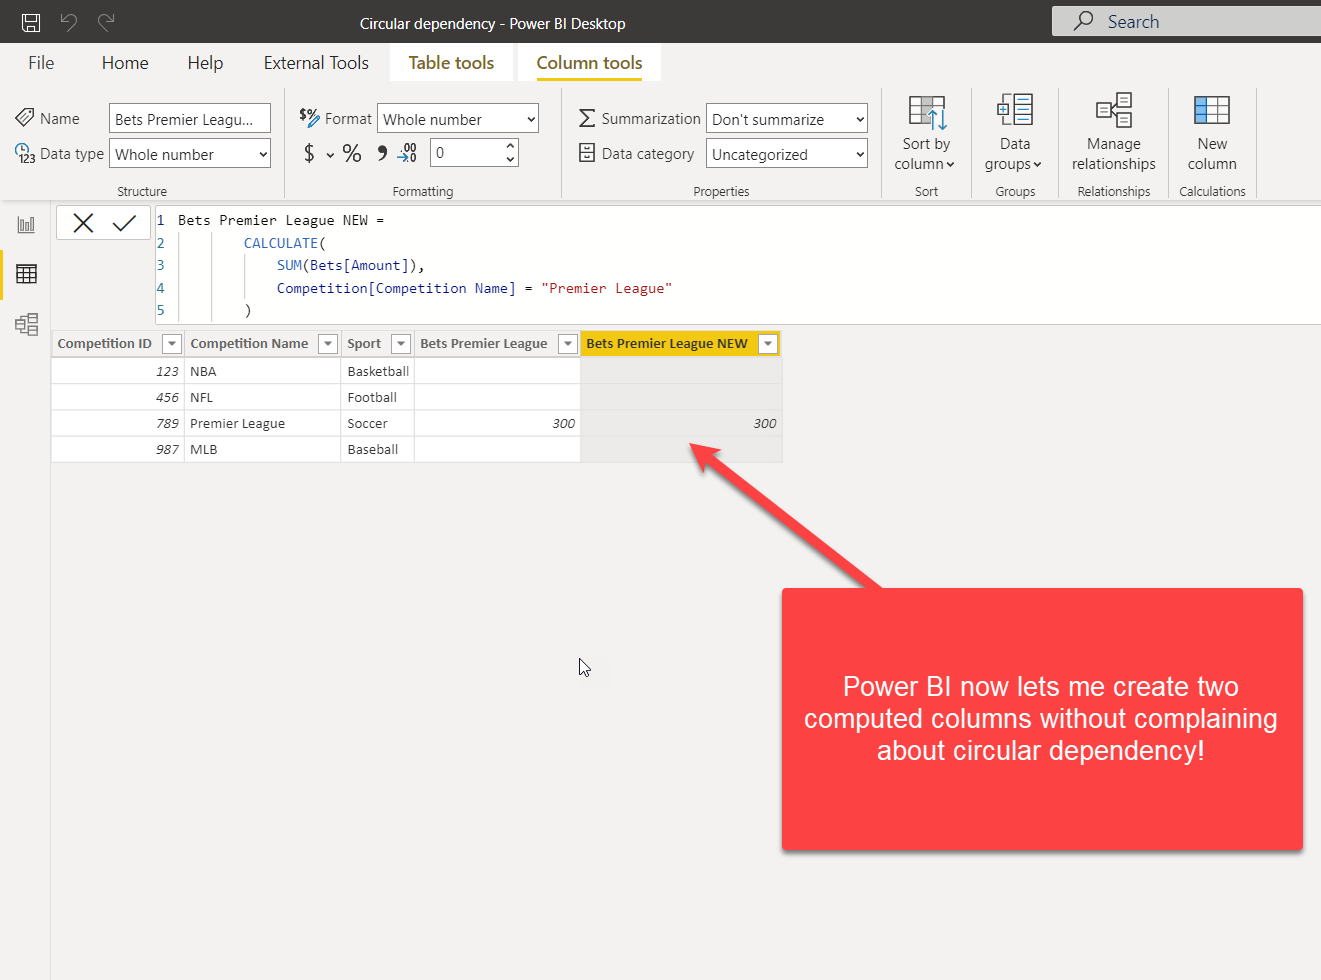
Image by author
What the heck is happening here?! The same code that was previously causing the “circular dependency” error, now works like a charm!
The catch is that when there is a column with unique values in the table (in our case, Competition ID as a primary key of the Competition table), context transition is optimized to avoid filtering all the other columns except the one with unique values. The uniqueness of the column was confirmed by the engine while establishing the 1:M relationship between the Competition table (on the 1 side of the relationship) and the Bets table.
However, as explained in this article from SQL BI, this “technique” of creating computed columns in dimension tables to avoid circular dependency issues is not a recommended practice, and thus should be avoided whenever possible.
Conclusion
Circular dependency is one of the most annoying things in the Power BI data modeling process! Whenever you create two objects that are dependent on each other, you risk running into this issue. Sometimes, determining what is the root cause may be a straightforward task, but in certain scenarios, it is necessary to understand the nuances of the DAX way of doing things.
Thanks for reading!
Recommend
About Joyk
Aggregate valuable and interesting links.
Joyk means Joy of geeK