

How to Manually Symbolicate a Crash Log from a macOS App
source link: https://daveceddia.com/manually-symbolicate-crash-log-macos-app/
Go to the source link to view the article. You can view the picture content, updated content and better typesetting reading experience. If the link is broken, please click the button below to view the snapshot at that time.
How to Manually Symbolicate a Crash Log from a macOS App
June 26, 2021Is one of your Mac apps crashing? If you got a crash report from your users, or an unsymbolicated crash log from Sentry, I’ll walk you through how to decode it into something you can use to debug the crash.
For my own app Recut, I’ve added the Sentry library to capture crash reports. For whatever reason, Sentry does not symbolicate my crash reports. I’ve uploaded the dSYMs and it just seems to ignore them. So: I’ll just symbolicate them myself!
Here’s how to do it manually. I also put together a Ruby script to symbolicate the whole crash report too.
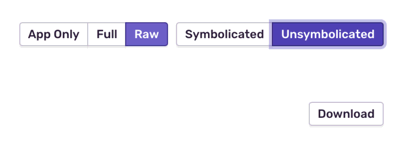
1. Download the unsymbolicated crash report from Sentry.
On the error report, select Raw and Unsymbolicated and click Download. The Download button won’t appear until you select Raw. Don’t leave it as the default Symbolicated or else the downloaded log will have a bunch of <redacted> where the memory addresses should be.
2. Make a new empty folder
Then open a Terminal, and cd to your new folder. We’ll be copying the necessary files here, because they all need to be in one place to symbolicate properly.
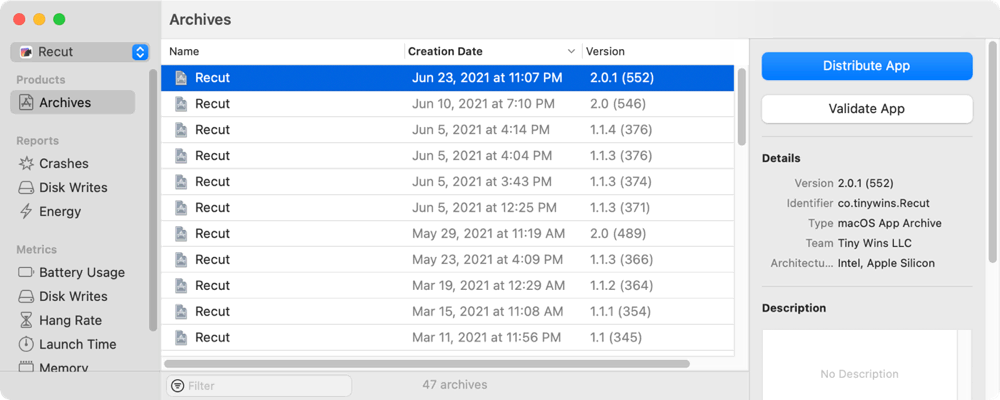
3. Open Xcode and the Organizer
In Xcode, under the Window menu, click Organizer to open it up.
This contains all of the archived builds of your app.
4. Find the correct release
Match up the info from the crash log (or the info in Sentry) with your list of releases in Xcode’s Organizer, and pick the one that matches.
Symbolication won’t work right (or maybe at all?) unless all the versions match up.
In my example I’m using release 2.0.1, build 552.
5. Copy files out of the release
Right-click the release, and choose Show in Finder.
That’ll open a Finder window with a single .xcarchive file in it.
Right-click that xcarchive, and choose Show Package Contents.
You should see a bunch of folders like this:
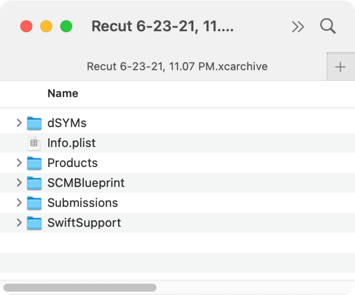
The files we need are in 2 places:
- from
dSYMs: copy everything into the folder you created. - from
Products/Applications: copy your app into the same folder.
Make sure that you copy these files! Do not move them.
This xcarchive is your key to the kingdom… if you lose these files, you won’t be able to symbolicate crash reports anymore. So leave the original files alone, just make copies.
6. Run the symbolicator tool
You should have a preinstalled command line tool called atos. From its man page, its job is to “convert numeric addresses to symbols of binary images or processes”.
Now in your folder you should have at least these 3 things:
- the crash report file (a text file)
- YourApp.app.dSYM
- YourApp.app
You can manually symbolicate a single line by plugging a couple memory addresses into atos. For example, here are the first few lines of a crash in my app:
Thread 0 Crashed:
0   Recut                           0x204302872         0x204296000 + 444530
1   Recut                           0x204308b5c         0x204296000 + 469852
2   Recut                           0x204308afe         0x204296000 + 469758
To look up the function and file where this crash occurred, I’ll take the first 2 memory addresses and run atos;
atos -o Recut.app/Contents/MacOS/Recut -arch x86_64 -l 0x204296000 0x204302872
That prints out the location of the crash and I can go look it up.
closure #1 in WaveDataManager.samplesForResolution(_:) (in Recut) (WaveDataManager.swift:150)
7. Run a script to automatically symbolicate everything
I wrote a Ruby script to run the atos command on every relevant line and symbolicate the whole crash report in one go. It’s in this GitHub gist.
To use:
- Download it
- Make it executable
chmod +x ./symbolicate.rb - Run it on your files:
symbolicate.rb 53c91214f29a42f1a0d19f86b7236e70.crash x86_64 Recut.app Recut.app.dSYM
This will print out the crash report, but with your own app’s calls symbolicated:
Thread 0 Crashed:
0   Recut                           0x204302872         closure #1 in WaveDataManager.samplesForResolution(_:) (in Recut) (WaveDataManager.swift:150)
1   Recut                           0x204308b5c         thunk for @callee_guaranteed () -> () (in Recut) (<compiler-generated>:0)
2   Recut                           0x204308afe         thunk for @escaping @callee_guaranteed () -> () (in Recut) (<compiler-generated>:0)
...
You can pass the -g to colorize the output, to highlight the lines that correspond to your app’s code.
By default it hides threads that don’t include any calls into your app code. It also hides the big list of binaries at the end of the crash report. You can turn those off with flags.
Here’s the full usage info:
Usage: symbolicate -g -b -t [crash_log] [arch] [app_bundle] [dsym]

The crash log, app, and dSYM should all be in the current working directory.

  In Xcode: Window > Organizer
  right-click the release, Show in Finder
  right-click the xcarchive, Show Package Contents
  copy files from `dSYMs` and `Products/Applications` into a new empty folder
  copy the crash log to the same folder

-g          Colorize the output to highlight this app's lines
-b          Show the 'Binary Images' section (by default this is omitted for brevity)
-t          Show all threads, including ones that have no calls to your app
crash_log   text file from Sentry
arch        x86_64 or arm64 (get this from Sentry)
app_bundle  TheApp.app (in current directory)
dsym        TheApp.app.dSYM (in current directory)
Now Go Debug!
I hope this helps you with your own app debugging journey!
Want to get better at React?
I send an article every Wednesday to help you level up as a front-end React developer. Drop your email in the box if you'd like to get on the list.
Learning React can be a struggle — so many libraries and tools!
My advice? Ignore all of them :)
For a step-by-step approach, check out my Pure React workshop.

Learn to think in React
- 90+ screencast lessons
- Full transcripts and closed captions
- All the code from the lessons
- Developer interviews
Dave Ceddia’s Pure React is a work of enormous clarity and depth. Hats off. I'm a React trainer in London and would thoroughly recommend this to all front end devs wanting to upskill or consolidate.

Recommend
About Joyk
Aggregate valuable and interesting links.
Joyk means Joy of geeK