
8

Chromium Blog: Don’t Copy That Surface
source link: https://blog.chromium.org/2021/04/dont-copy-that-surface.html
Go to the source link to view the article. You can view the picture content, updated content and better typesetting reading experience. If the link is broken, please click the button below to view the snapshot at that time.
Don’t Copy That Surface
News and developments from the open source browser project
Don’t Copy That Surface
Monday, April 5, 2021
This post is part of a new series we're bringing you of deeper dives into the careful trade-offs and complex engineering that goes into making Chrome fast and reliable. This debugging adventure by Chrome developer and blogger Bruce Dawson reduced CPU usage by about 3% when using a webcam - a real help for those of us relying on video calls.
Video conferencing took on elevated importance in 2020. I’m not on the Google Meet team but I do work on Chrome, so I fired up my favorite profiler during one of my daily meetings to see if I could find anything useful.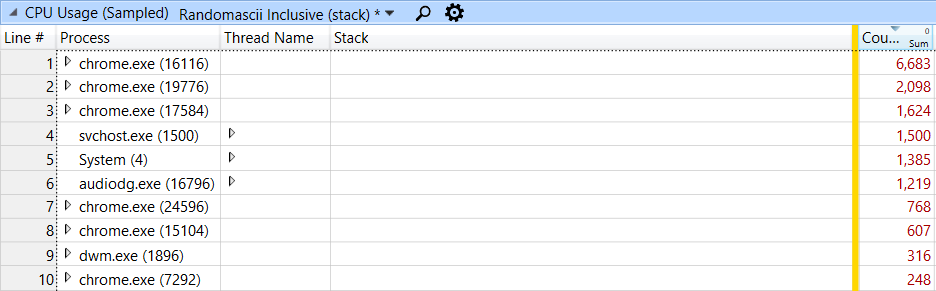 That’s a lot of samples to look through, but the call stacks are collated so that you can drill down on the busiest stacks. I didn’t find anything in the first Chrome process, but in the second one I did:
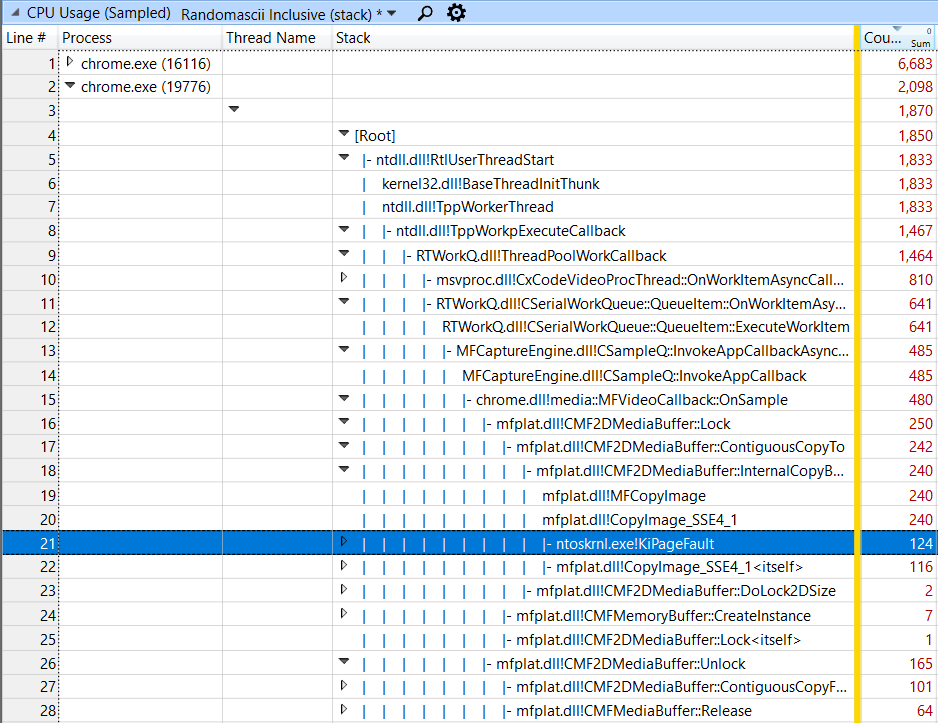 It doesn’t look like much, but I recognized immediately that the 124 samples in KiPageFault were worth investigating. Most of the CPU-intensive work in this trace was important and unavoidable work but I had a hunch that these samples represented avoidable work - something that I could fix. And, even though they represented just 0.75% of the samples I suspected that they indicated a somewhat greater cost.
I recognized their importance immediately because this is something that I have seen before. KiPageFault means that the processor touched some memory that had been allocated, but was not currently in the process. This could mean that the pages had been removed from the process to save memory, but in an active process on a machine with lots of memory, that didn’t make sense. What was more likely was that this represented recently allocated memory.
When a program allocates a small amount of memory, the local memory manager (sometimes called the “heap”) will usually have some available that it can give to the program. But if it doesn’t have an appropriate block of memory then it will ask the operating system (OS) for some. If a program allocates a large amount of memory (greater than a MB or so) then the heap will definitely ask for more memory. This is, in itself, a relatively cheap operation. The heap asks the OS for some memory, the OS says “sure”, then the OS makes note of the fact that it promised this memory, and that’s it. The OS does not, at that time, actually give the program any memory. This is the way of the world on Windows, Linux, Android and it is good but it can be confusing and surprising. If the process never touches the memory then the memory is never added to the process, but if the process does touch the memory then individual pages of zeroed memory are brought into the process. These are called demand-zero page faults because zeroed pages are “faulted” into the process on demand.
In other words, allocating a large block of memory is quite cheap, but doesn’t actually set up the promised memory. Then, when the program tries to use the memory and the CPU discovers that there is no memory at that address it triggers an exception, which wakes up the OS. The OS checks its records and realizes that it did in fact promise to put memory at that address so it then puts some there and restarts the program. This happens so quickly that if you’re not paying attention you will miss it, but it shows up when profiling as samples hitting in KiPageFault.
This bizarre dance happens again for every 4-KiB block in the allocation - 4 KiB is the size of the pages that the CPU and the OS work on.
The cost is small. Across this 10-second period only 124 samples - representing about 124 ms or 0.124 seconds - hit inside of KiPageFault. The total cost of the enclosing CopyImage_SSE4_1 function was about 240 ms, so the page faults accounted for more than half of this function, but barely a quarter of the cost of the OnSample function on line 15.
The total costs of these page faults is modest but they hint at many other costs: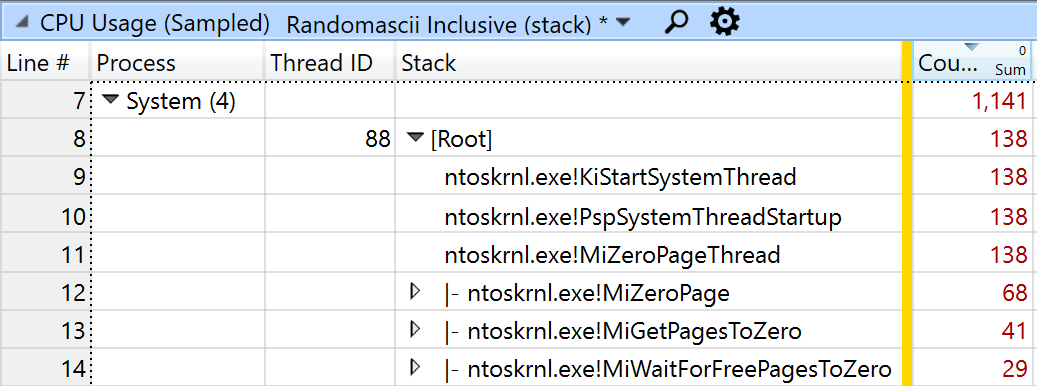 I analyzed these hidden costs of memory allocation in a 2014 blog post. The basic memory architecture of Windows hasn’t changed since then so the hidden costs remain about the same.
In addition to CPU samples my ETW trace contained call stacks for every call to VirtualAlloc. This WPA screenshot shows a 10-second period where the OnSample function does 298 allocations that are each 1.320 MB, roughly 30 per second: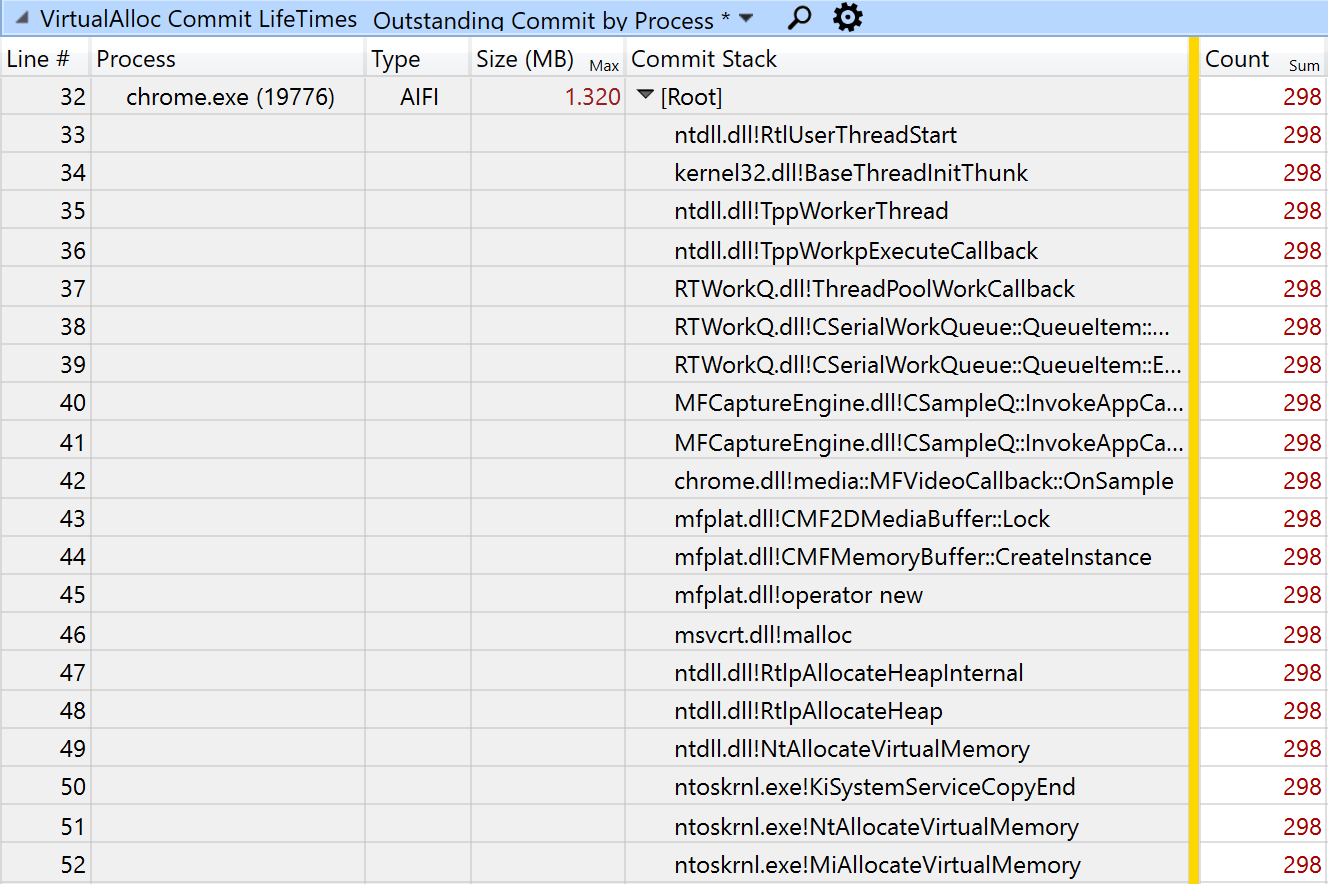 At this point we can estimate that the cost of these repeated allocations is 124 (faulting in) plus 64 (freeing) plus 124 (87% of the zeroing samples) for a total of 312 samples. This gets us up to 1.9% of the total CPU cost of video conferencing. Fixing this is not going to change the world, but this is a change worth doing.
If we can examine this buffer without the alloc/copy/copy/free dance then we can save 312 samples plus 116 samples (the rest of the copying cost) plus 101 samples (the copying-it-back cost) for a total saving of 3.2%. This is getting better all the time.
Note that sampled data is only statistically valid, and the actual percentages vary significantly depending on the computer and the exact workload. But, the point remains - it is a non-dramatic but worthwhile change to investigate.
Despite spending years in the video-game business my knowledge of these graphics-buffer locking and unlocking APIs is weak. I ended up relying on the wisdom of my Twitter followers to come to the conclusion that the copying was entirely avoidable, and to get a rough pattern for how it could be fixed. After filing an overly verbose bug I delegated the task of actually fixing it. The fix landed in M85 and was deemed important enough that it was then backported to M84.
You’d have to be paying very close attention to see the difference - spread across a Chrome process and the system process - but I hope that this helped some computers run a bit cooler and last longer on their batteries. And, while this inefficiency was found by profiling Google Meet, the improvement actually benefits any product that uses the webcam inside Chrome (and other Chromium-based browsers).
CPU time in OnSample:
There is a lot going on during video conferencing, spread across multiple processes. With my usual dozens of tabs open there were 37 Chrome processes, with six of them actively participating in the video conference. In addition there were over 200 other processes running (87 copies of svchost.exe, for instance), with four of those involved in video conferencing. You may well wonder why it takes 10 processes to connect two people, so here is a list of the processes and their roles:
This all makes good sense, but having this many processes involved can make performance-profiling challenging. It can be challenging to look through all of these processes to find areas of potential improvement. It is made more difficult by the fact that I know little about the Meet architecture.
- audiodg.exe - Windows Audio Device Graph Isolation, audio output
- dwm.exe - Windows Desktop Window Manager, showing video
- svchost.exe - Windows Camera Frame Server (webcam capture)
- System - Windows system process, does miscellaneous tasks on behalf of processes
- chrome.exe - browser process, the master control program
- chrome.exe - renderer process, the Meet tab
- chrome.exe - GPU process, in charge of rendering pages
- chrome.exe - NetworkService utility process, talking to the network
- chrome.exe - VideoCaptureService, talking to the Windows Camera Frame Server
- chrome.exe - AudioService, controls audio input and output
This all makes good sense, but having this many processes involved can make performance-profiling challenging. It can be challenging to look through all of these processes to find areas of potential improvement. It is made more difficult by the fact that I know little about the Meet architecture.
Analyzing a profile
Video conferencing is CPU intensive - you have to record, compress, transmit, receive, decompress, and display both audio and video. The data below shows CPU samples recorded by Microsoft’s Event Tracing for Windows (ETW). This sampling profiler works by interrupting every running thread about 1,000 times a second and recording a call stack. I used Windows Performance Analyzer (WPA) to display the results. In the screenshot below I am looking at a 10-second period and over 16,000 samples (representing about 16 seconds of CPU time) were recorded across the 10 processes involved in video conferencing:I recognized their importance immediately because this is something that I have seen before. KiPageFault means that the processor touched some memory that had been allocated, but was not currently in the process. This could mean that the pages had been removed from the process to save memory, but in an active process on a machine with lots of memory, that didn’t make sense. What was more likely was that this represented recently allocated memory.
When a program allocates a small amount of memory, the local memory manager (sometimes called the “heap”) will usually have some available that it can give to the program. But if it doesn’t have an appropriate block of memory then it will ask the operating system (OS) for some. If a program allocates a large amount of memory (greater than a MB or so) then the heap will definitely ask for more memory. This is, in itself, a relatively cheap operation. The heap asks the OS for some memory, the OS says “sure”, then the OS makes note of the fact that it promised this memory, and that’s it. The OS does not, at that time, actually give the program any memory. This is the way of the world on Windows, Linux, Android and it is good but it can be confusing and surprising. If the process never touches the memory then the memory is never added to the process, but if the process does touch the memory then individual pages of zeroed memory are brought into the process. These are called demand-zero page faults because zeroed pages are “faulted” into the process on demand.
In other words, allocating a large block of memory is quite cheap, but doesn’t actually set up the promised memory. Then, when the program tries to use the memory and the CPU discovers that there is no memory at that address it triggers an exception, which wakes up the OS. The OS checks its records and realizes that it did in fact promise to put memory at that address so it then puts some there and restarts the program. This happens so quickly that if you’re not paying attention you will miss it, but it shows up when profiling as samples hitting in KiPageFault.
This bizarre dance happens again for every 4-KiB block in the allocation - 4 KiB is the size of the pages that the CPU and the OS work on.
The cost is small. Across this 10-second period only 124 samples - representing about 124 ms or 0.124 seconds - hit inside of KiPageFault. The total cost of the enclosing CopyImage_SSE4_1 function was about 240 ms, so the page faults accounted for more than half of this function, but barely a quarter of the cost of the OnSample function on line 15.
The total costs of these page faults is modest but they hint at many other costs:
- If this memory is being allocated repeatedly (presumably every frame) then it must also be freed every frame. On line 26 we can see that the Release function which frees the memory uses another 64 samples.
- When the pages are freed the operating system has to zero them (for security reasons) so that they are ready to be reused. This is done in the Windows System process - an almost entirely hidden cost. Sure enough when I looked in the System process I saw 138 samples in the MiZeroPageThread. I found that 87% of the KiPageFault samples in the entire system were in the CopyImage_SSE4_1 call so presumably 87% of the 138 samples in the MiZeroPageThread were due to this pattern.
In addition to CPU samples my ETW trace contained call stacks for every call to VirtualAlloc. This WPA screenshot shows a 10-second period where the OnSample function does 298 allocations that are each 1.320 MB, roughly 30 per second:
But wait, there’s more!
We are locking this buffer so that we can look at the contents, but it turns out we don’t actually want the lock call to copy the buffer at all. We just want the lock call to describe the buffer to us so that we can look at it in place. Therefore the entire cost of the MFCopyImage call is waste! That’s another 116 samples. In addition, in the CMF2DMediaBuffer::Unlock call on line 26 there is another call to CMF2DMediaBuffer::ContiguousCopyFrom. That’s because the Unlock call assumes that we might have modified the copy of the buffer, so it copies it back. So the 101 samples there are all waste as well!If we can examine this buffer without the alloc/copy/copy/free dance then we can save 312 samples plus 116 samples (the rest of the copying cost) plus 101 samples (the copying-it-back cost) for a total saving of 3.2%. This is getting better all the time.
Note that sampled data is only statistically valid, and the actual percentages vary significantly depending on the computer and the exact workload. But, the point remains - it is a non-dramatic but worthwhile change to investigate.
Despite spending years in the video-game business my knowledge of these graphics-buffer locking and unlocking APIs is weak. I ended up relying on the wisdom of my Twitter followers to come to the conclusion that the copying was entirely avoidable, and to get a rough pattern for how it could be fixed. After filing an overly verbose bug I delegated the task of actually fixing it. The fix landed in M85 and was deemed important enough that it was then backported to M84.
You’d have to be paying very close attention to see the difference - spread across a Chrome process and the system process - but I hope that this helped some computers run a bit cooler and last longer on their batteries. And, while this inefficiency was found by profiling Google Meet, the improvement actually benefits any product that uses the webcam inside Chrome (and other Chromium-based browsers).
Verification
After the fix landed I compared two 10-second ETW traces from Chrome Canary before and after the change, each taken with no other programs running except a single Chrome tab running the Google Meet pre-meeting page. In both cases I looked at a 10-second period of time in the profiler. This showed:CPU time in OnSample:
Before: 458 ms (432 ms of which were in Lock/Unlock/KiPageFault)After: 27 ms
Allocations:
Before: 30 allocations per second of 1.32 MB (one per frame, running at 30 fps - a higher framerate would mean more allocations), totalling 396 MB over 10 secondsAfter: 0 allocations
CPU time in the System process's MiZeroPageThread:
Before: 36 msAfter: 0 ms
These measurements showed - in three different ways - that the performance problem was fixed. The memory copying in OnSample was gone, the repeated allocations were gone, and the system process was doing less work. Mission accomplished, bug closed.
Recommend
About Joyk
Aggregate valuable and interesting links.
Joyk means Joy of geeK