

Troubleshooting Spring Data JPA Specification and Criteria queries impact on Hib...
source link: https://tech.asimio.net/2021/01/27/Troubleshooting-Spring-Data-JPA-Specification-and-Criteria-queries-impact-on-Hibernate-QueryPlanCache.html
Go to the source link to view the article. You can view the picture content, updated content and better typesetting reading experience. If the link is broken, please click the button below to view the snapshot at that time.
This post has been featured on https://www.baeldung.com/java-weekly-371.
1. INTRODUCTION
Now that you know how to write dynamic SQL queries using Spring Data JPA Specification and the Criteria API, let’s evaluate the impact they might have in the performance of your Spring Boot applications.
As a Java developer, you have the responsibility to understand what SQL statements Hibernate generates and executes. It helps you to prevent the N+1 SELECT query problem, for instance.
Another common problem Hibernate developers experience is performance and memory problems as a result of writing queries with a variable number of values in the IN predicates.
This blog post helps you to identify heap and garbage collection problems you might experience when using Spring Data JPA Specification with Criteria queries.
2. TOOLSET AND SETUP
- spring-data-jpa-specification-dynamic-queries is the target Spring Boot RESTful, stateless application.
- db_dvdrental Postgres DB Docker image. A containerized relational database [1] connects to.
- JMeter to run a load test.
- VisualVM or your Application Monitoring (APM) Tool of preference to look at the JVM heap and garbage collection.
- Eclipse Memory Analyzer (MAT) to analyze a heapdump.
Let’s connect VisualVM to the target application after starting a db_dvdrental database Docker container and the target application itself.
A VisualVM screenshot looks like:
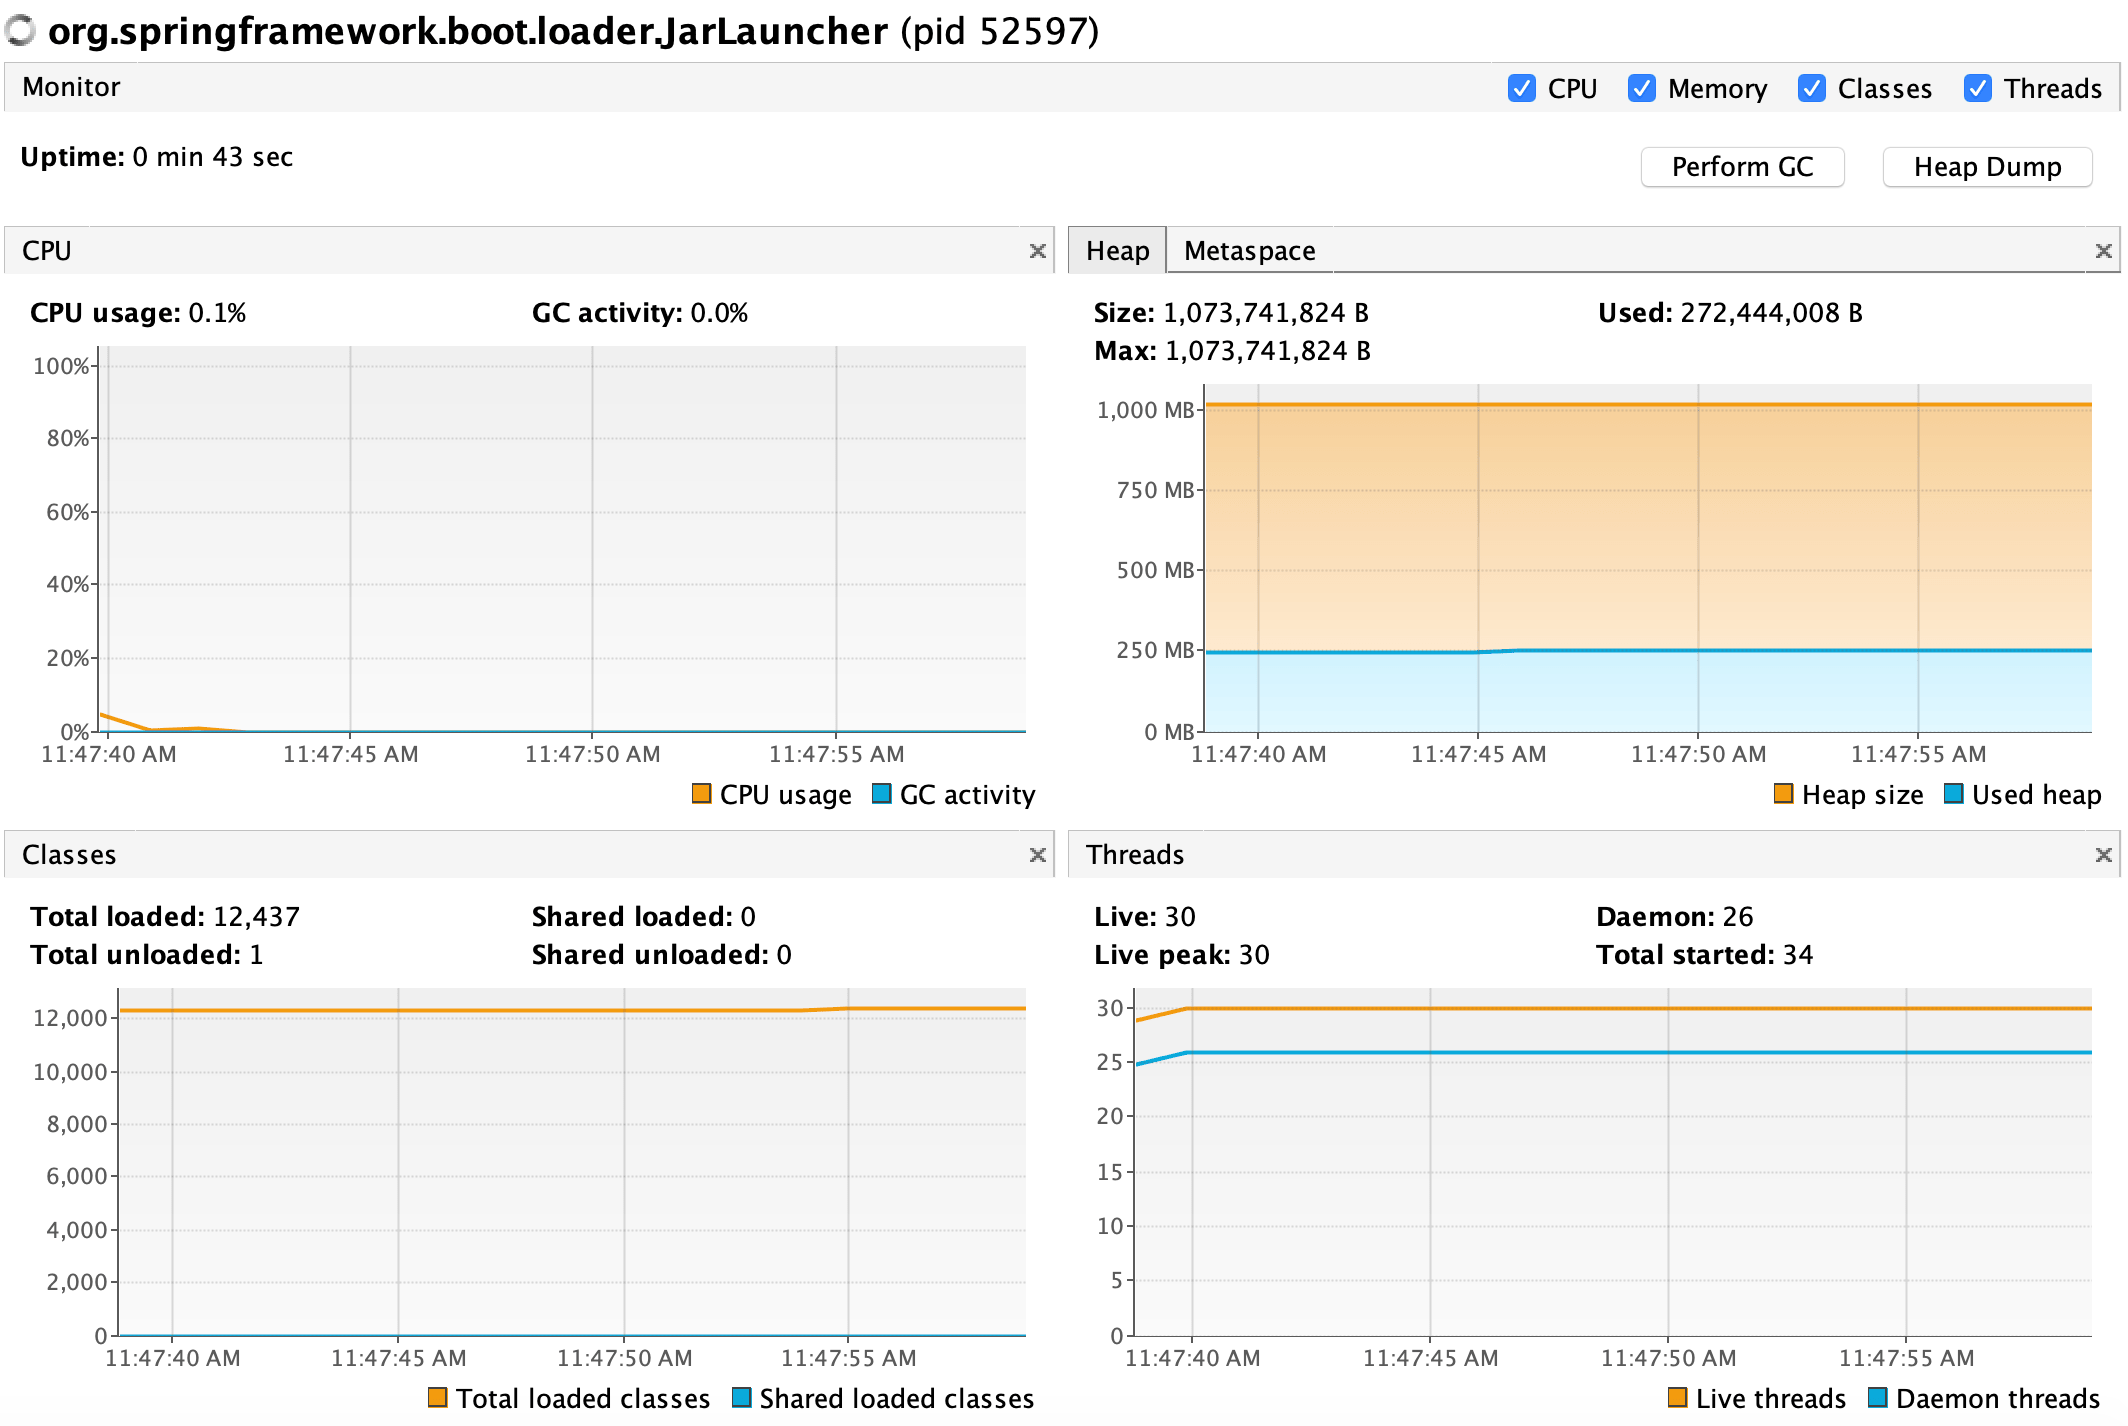
Nothing out of the ordinary. The target application started under a minute ago and the load test hasn’t started yet.
3. JMETER LOAD TEST PLAN
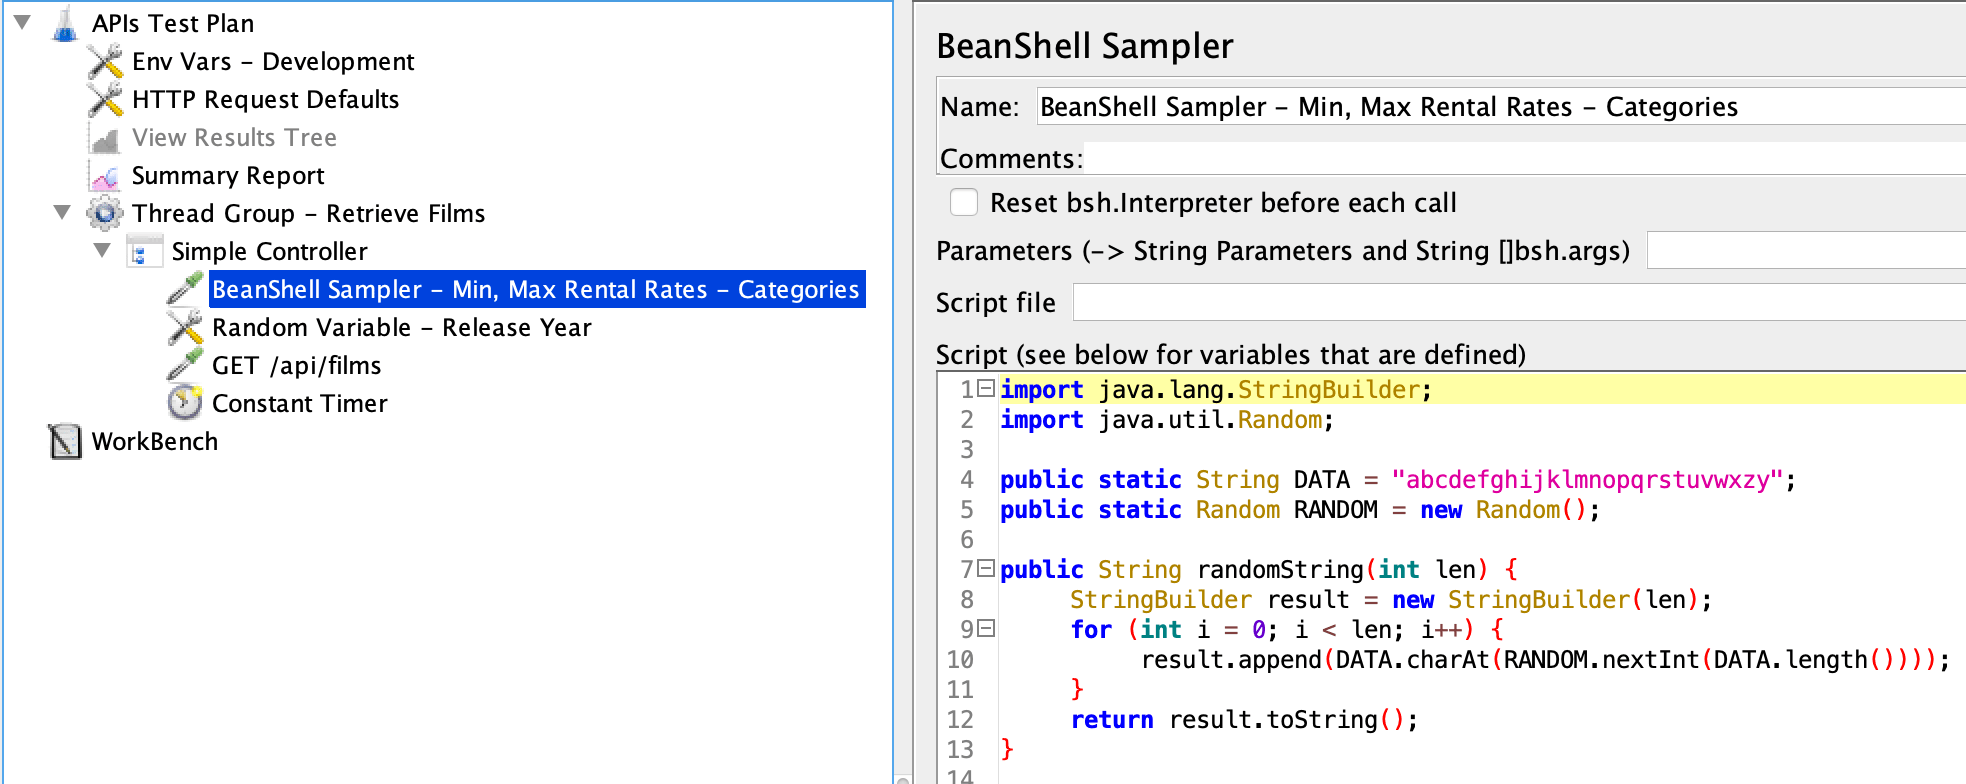
The load test exercise consists of sending GET /api/films requests. It’ll include random values for minRentalRate, maxRentalRate, releaseYear and a variable number of category request parameters. For instance:
/api/films?minRentalRate=0.99&maxRentalRate=4.99&releaseYear=2005&category=blah
/api/films?minRentalRate=0.10&maxRentalRate=3.50&releaseYear=1986&category=blah&category=meh
This is a extreme test plan where a high percentage of the values will be different.
Let’s start a load test and see how this stateless RESTful application behaves.
4. INSPECT THE HEAP AND GARABAGE COLLECTION
The load test ramp-up period is one minute. It then is at full capacity after eight minutes.
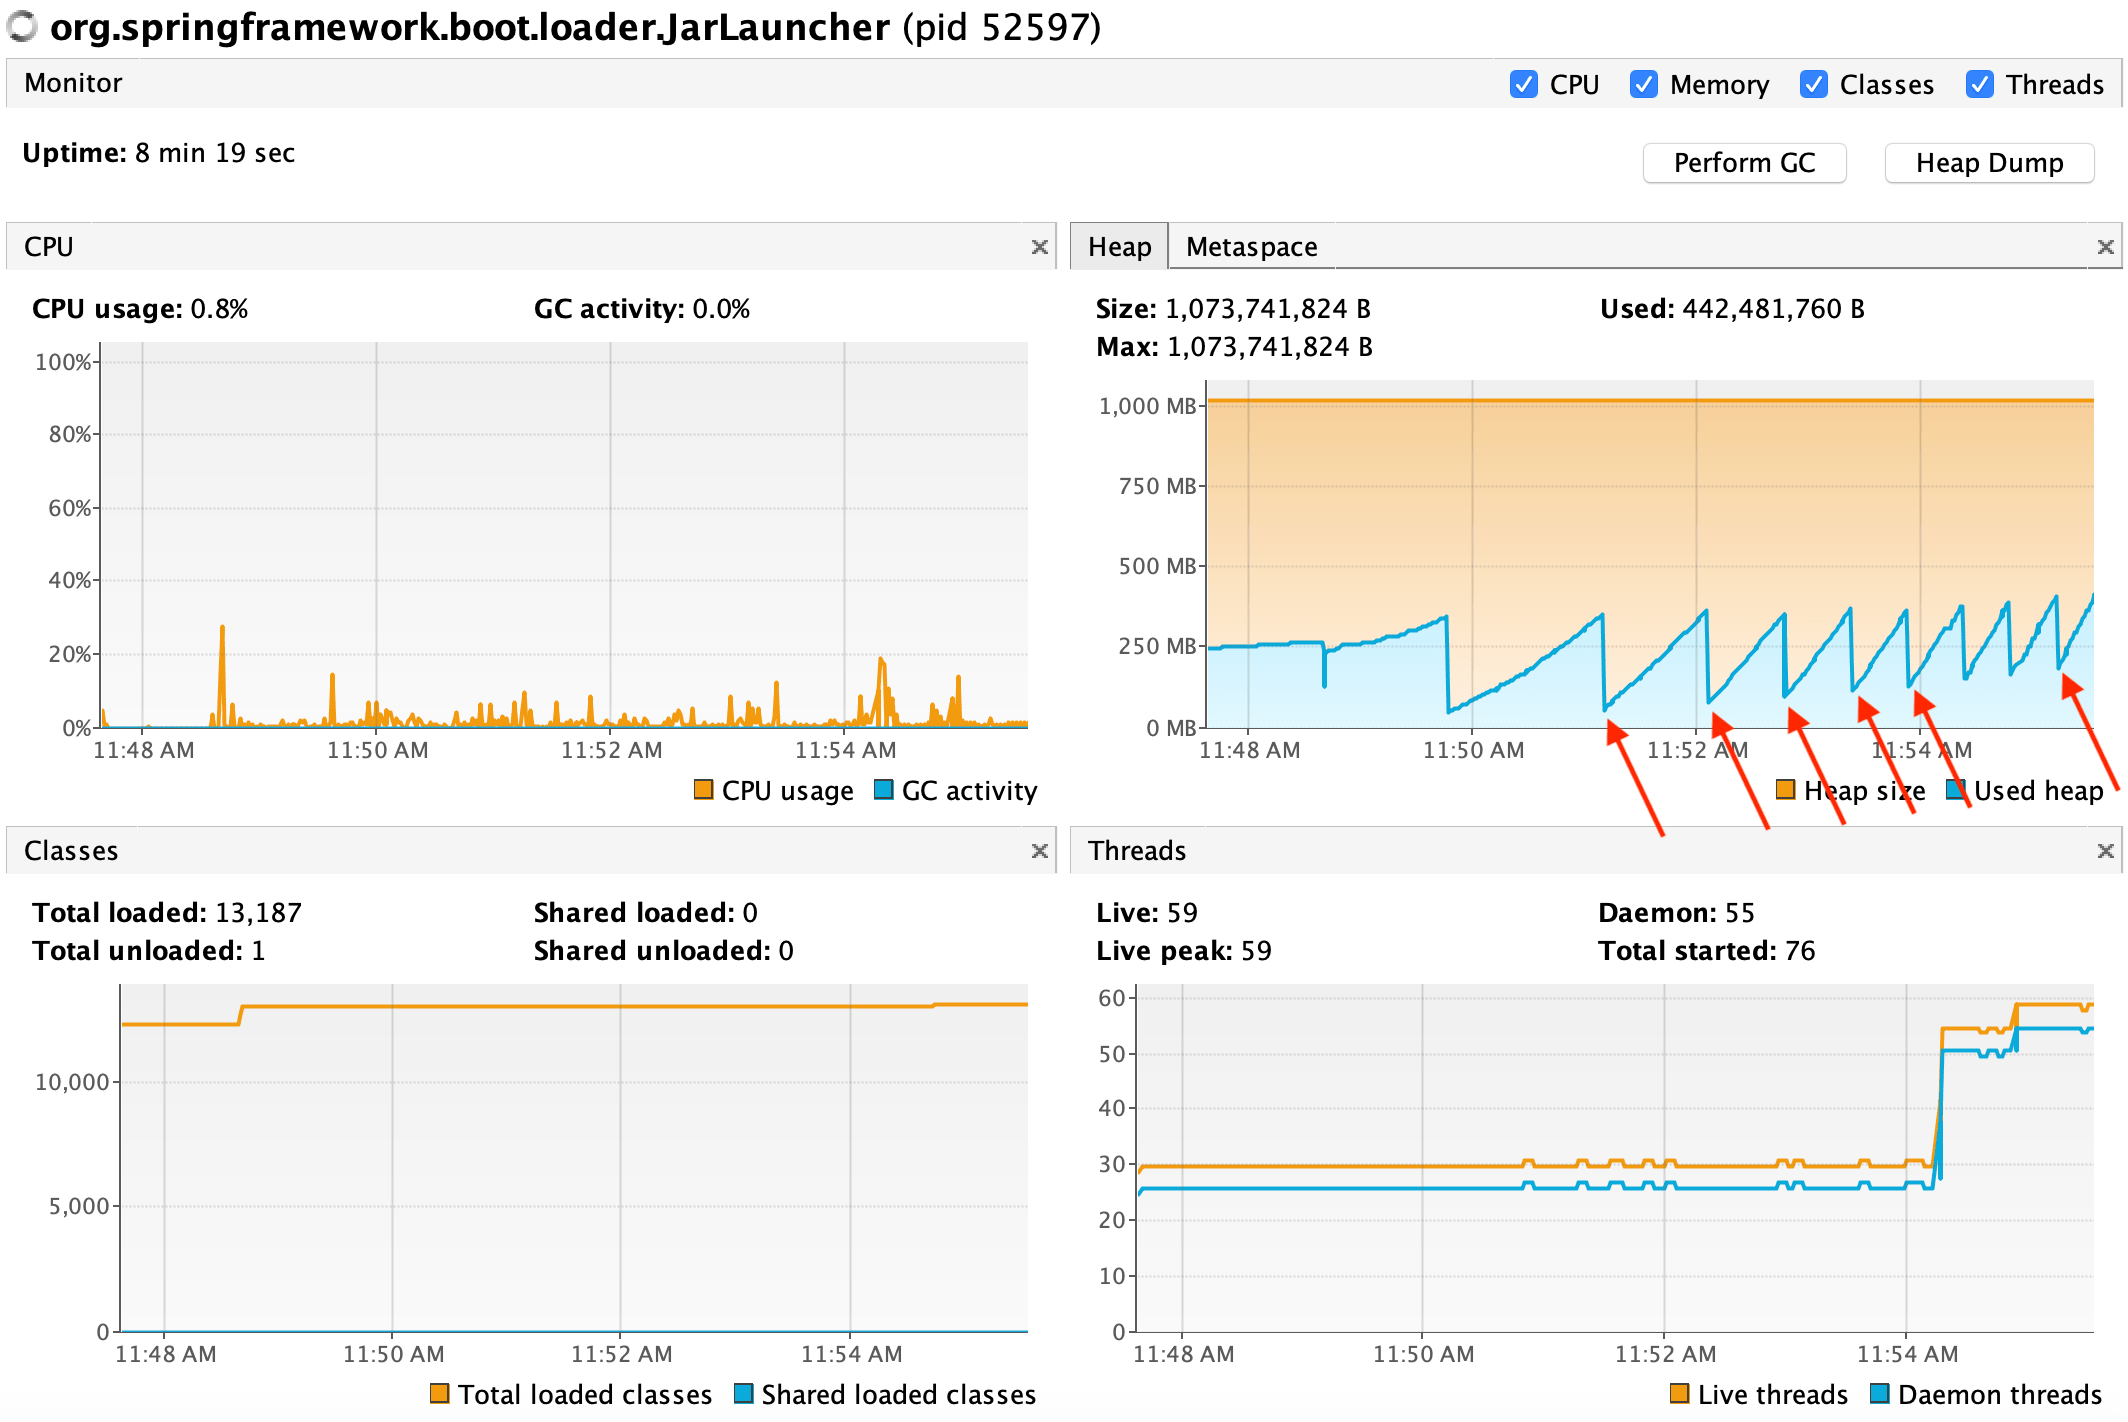
Notice how after each GC cycle, the GC releases less objects from the heap.
And the pattern continues fourteen minutues into the load.
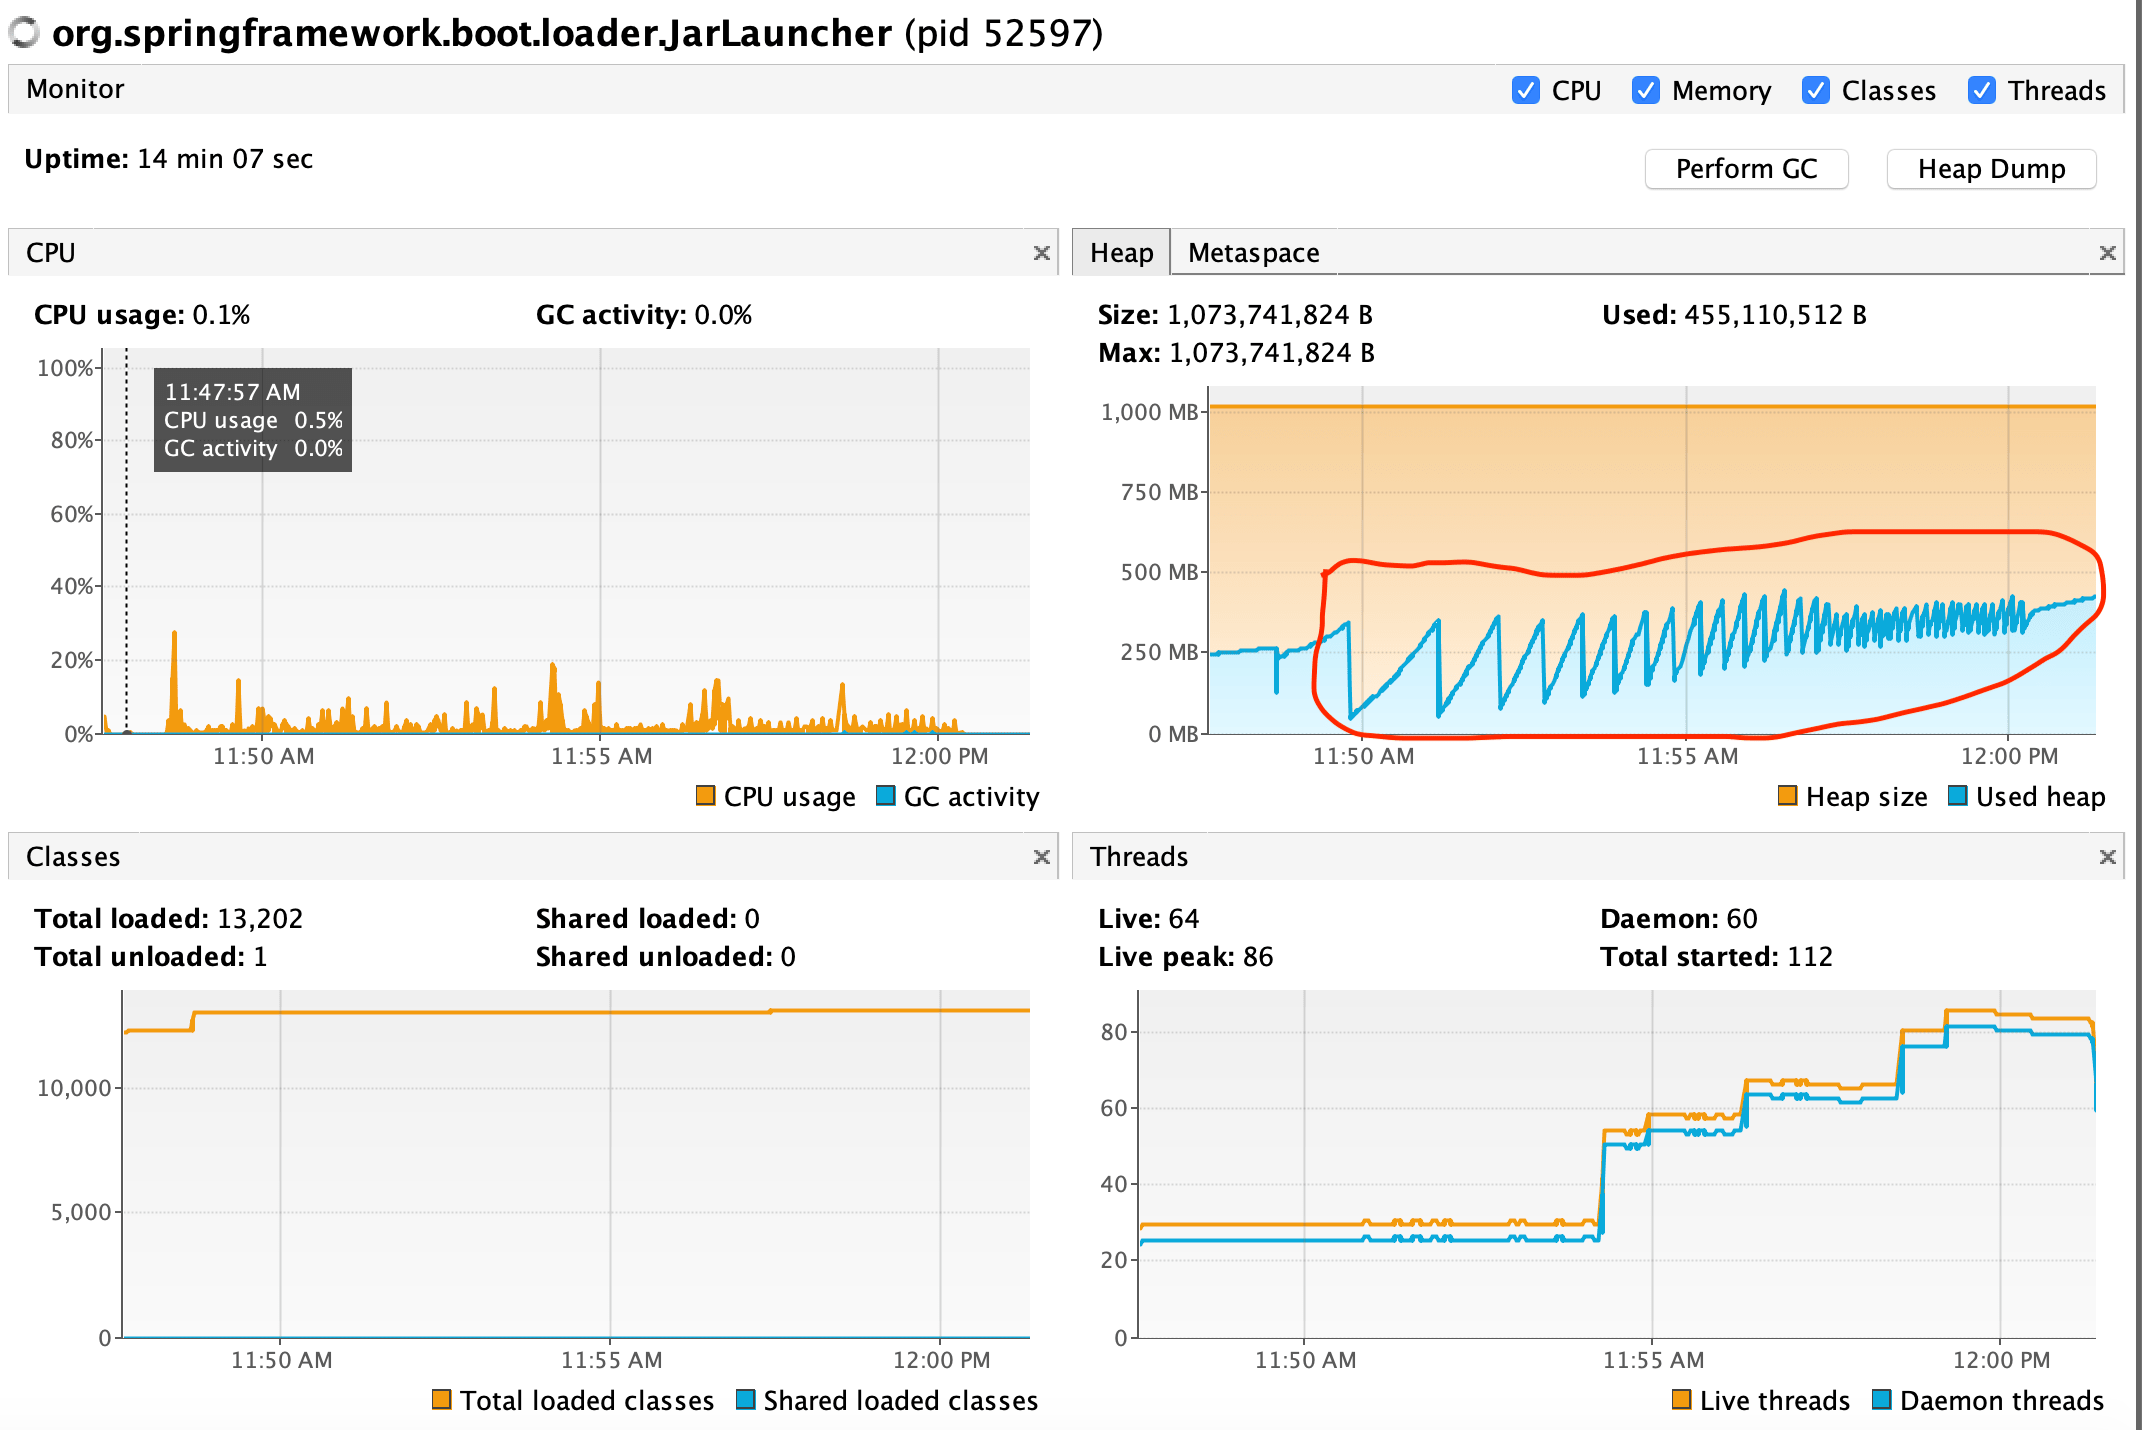
You are seeing frequent GC cycles not able to reclaim heap space. You might eventually get an OutOfMemoryError exception.
This is a stateless RESTful application. Would it be a memory leak? It’s a stateless application but it also uses a number of open source libraries underneath.
It’s now time to capture and analyze a heapdump.
5. ANALYZE A HEAPDUMP
There are different ways to take a heapdump. Some of them are: jmap command, VisualVM, JConsole, Spring Boot heapdump actuator endpoint, and Eclipse Memory Analizer.
I’ll use the later to acquire and analyze a Java application heapdump.
- Using Eclipse Memory Analyzer, you can capture a Java application heapdump via File -> Acquire Heap Dump … menu option.
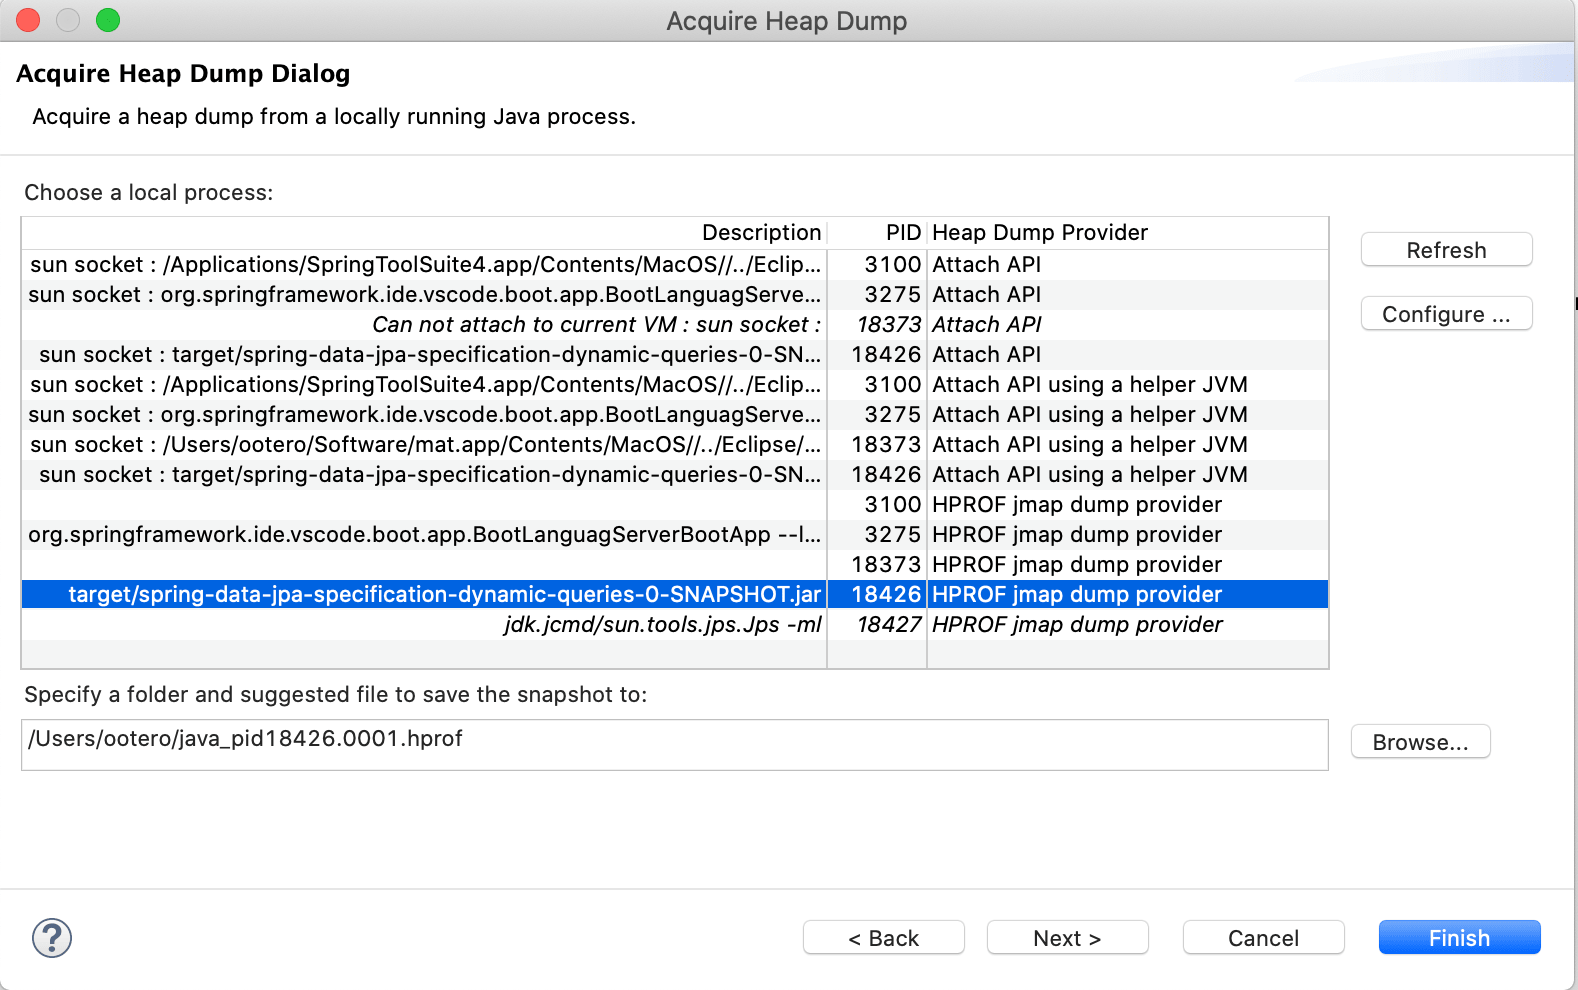 Acquire Heap Dump using Eclipse Memory Analyzer
- Eclipse Memory Analyzer then opens the heapdump and pops a dialog. Select Leak Suspects Report.
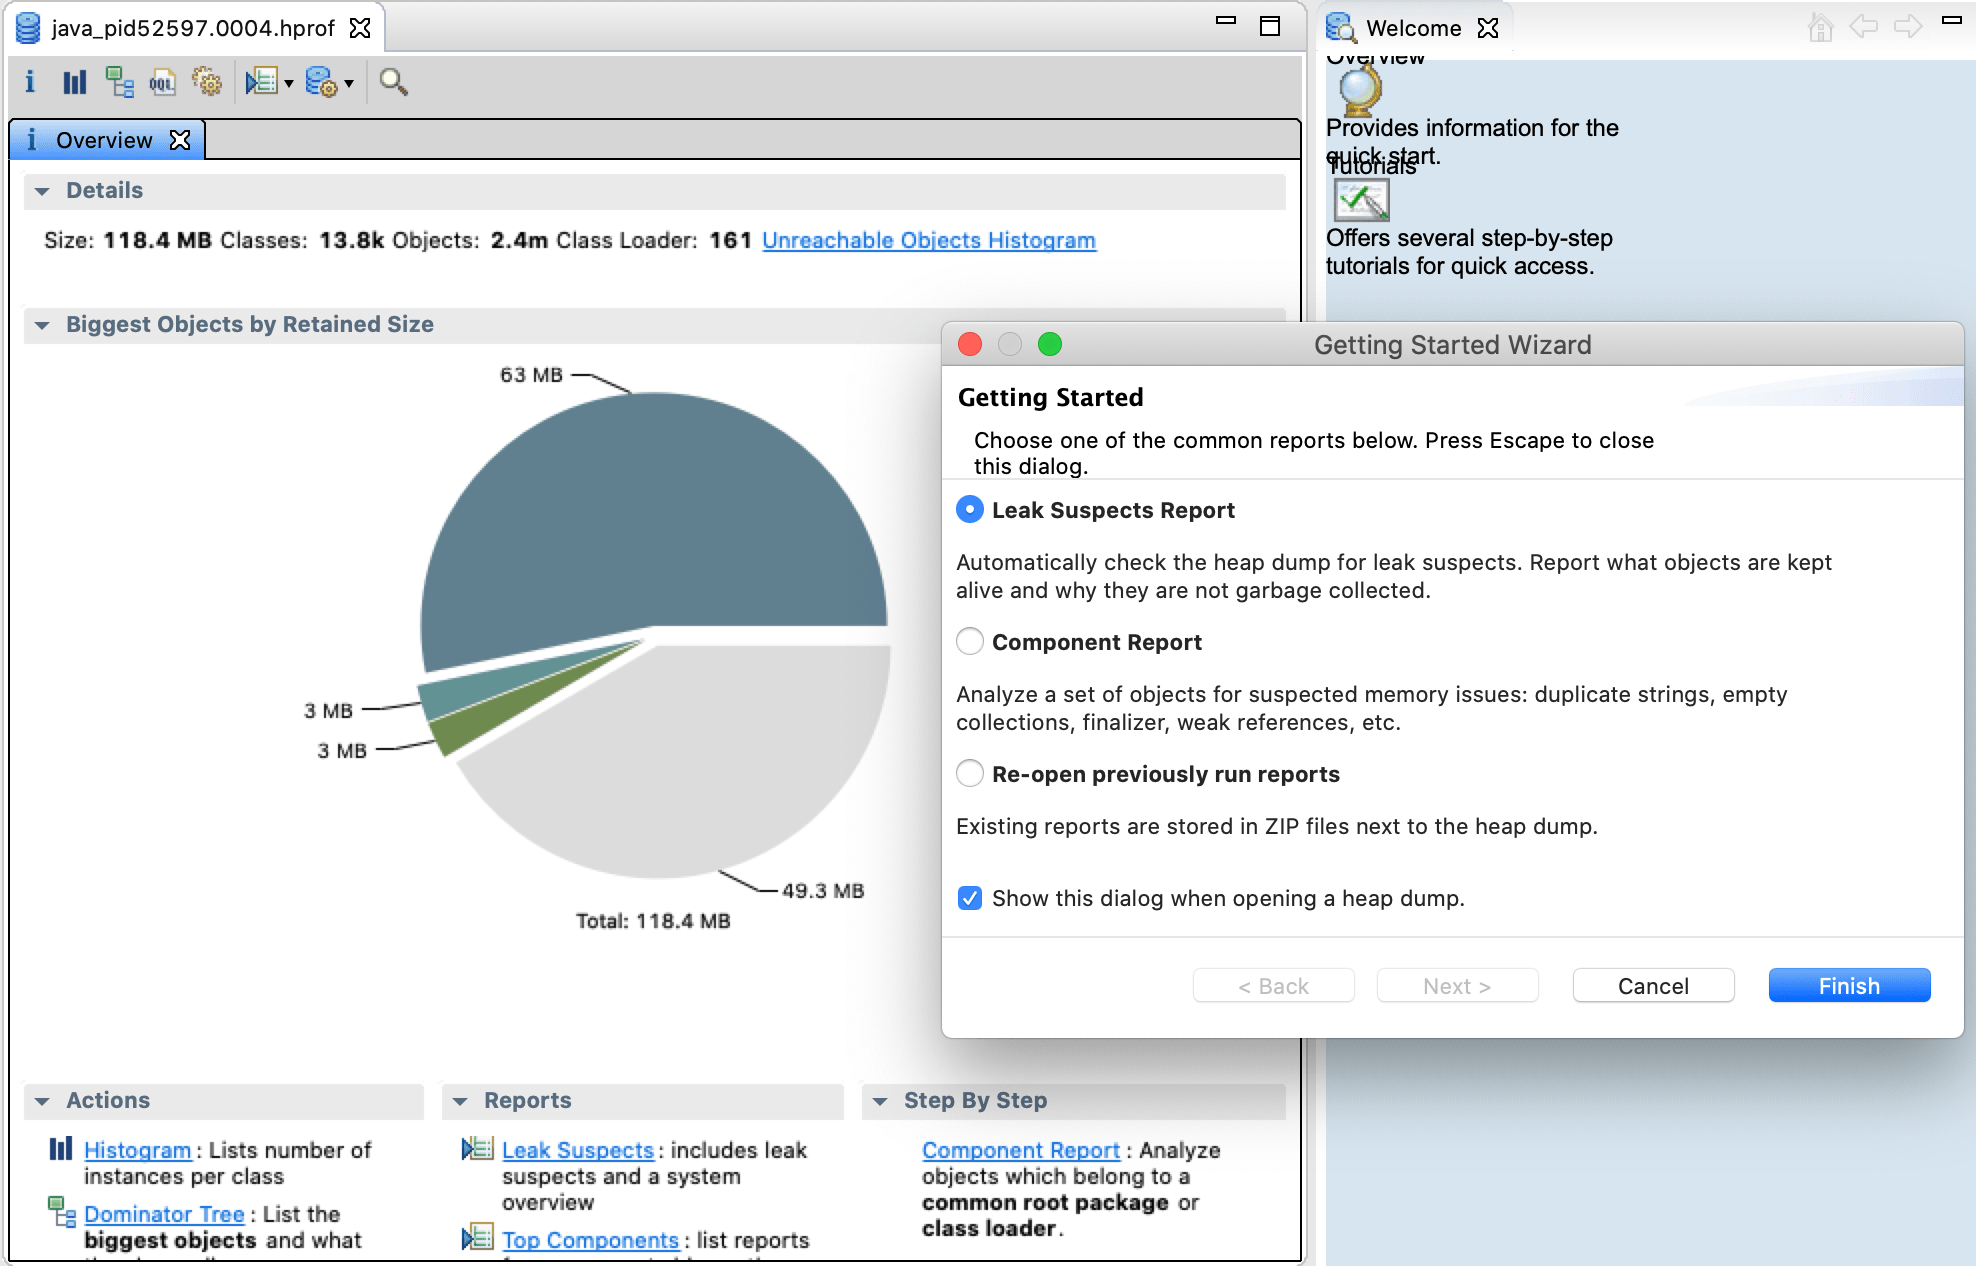 Eclipse Memory Analyzer Leak Suspects Report
- After confirming the Leak Suspects, go back to the Overview tab, click on the main leak suspect.
Interesting, it now shows a hint of what might be at fault. org.hibernate.internal.SessionFactoryImpl.
Now click List objects -> with outgoing references menu option.
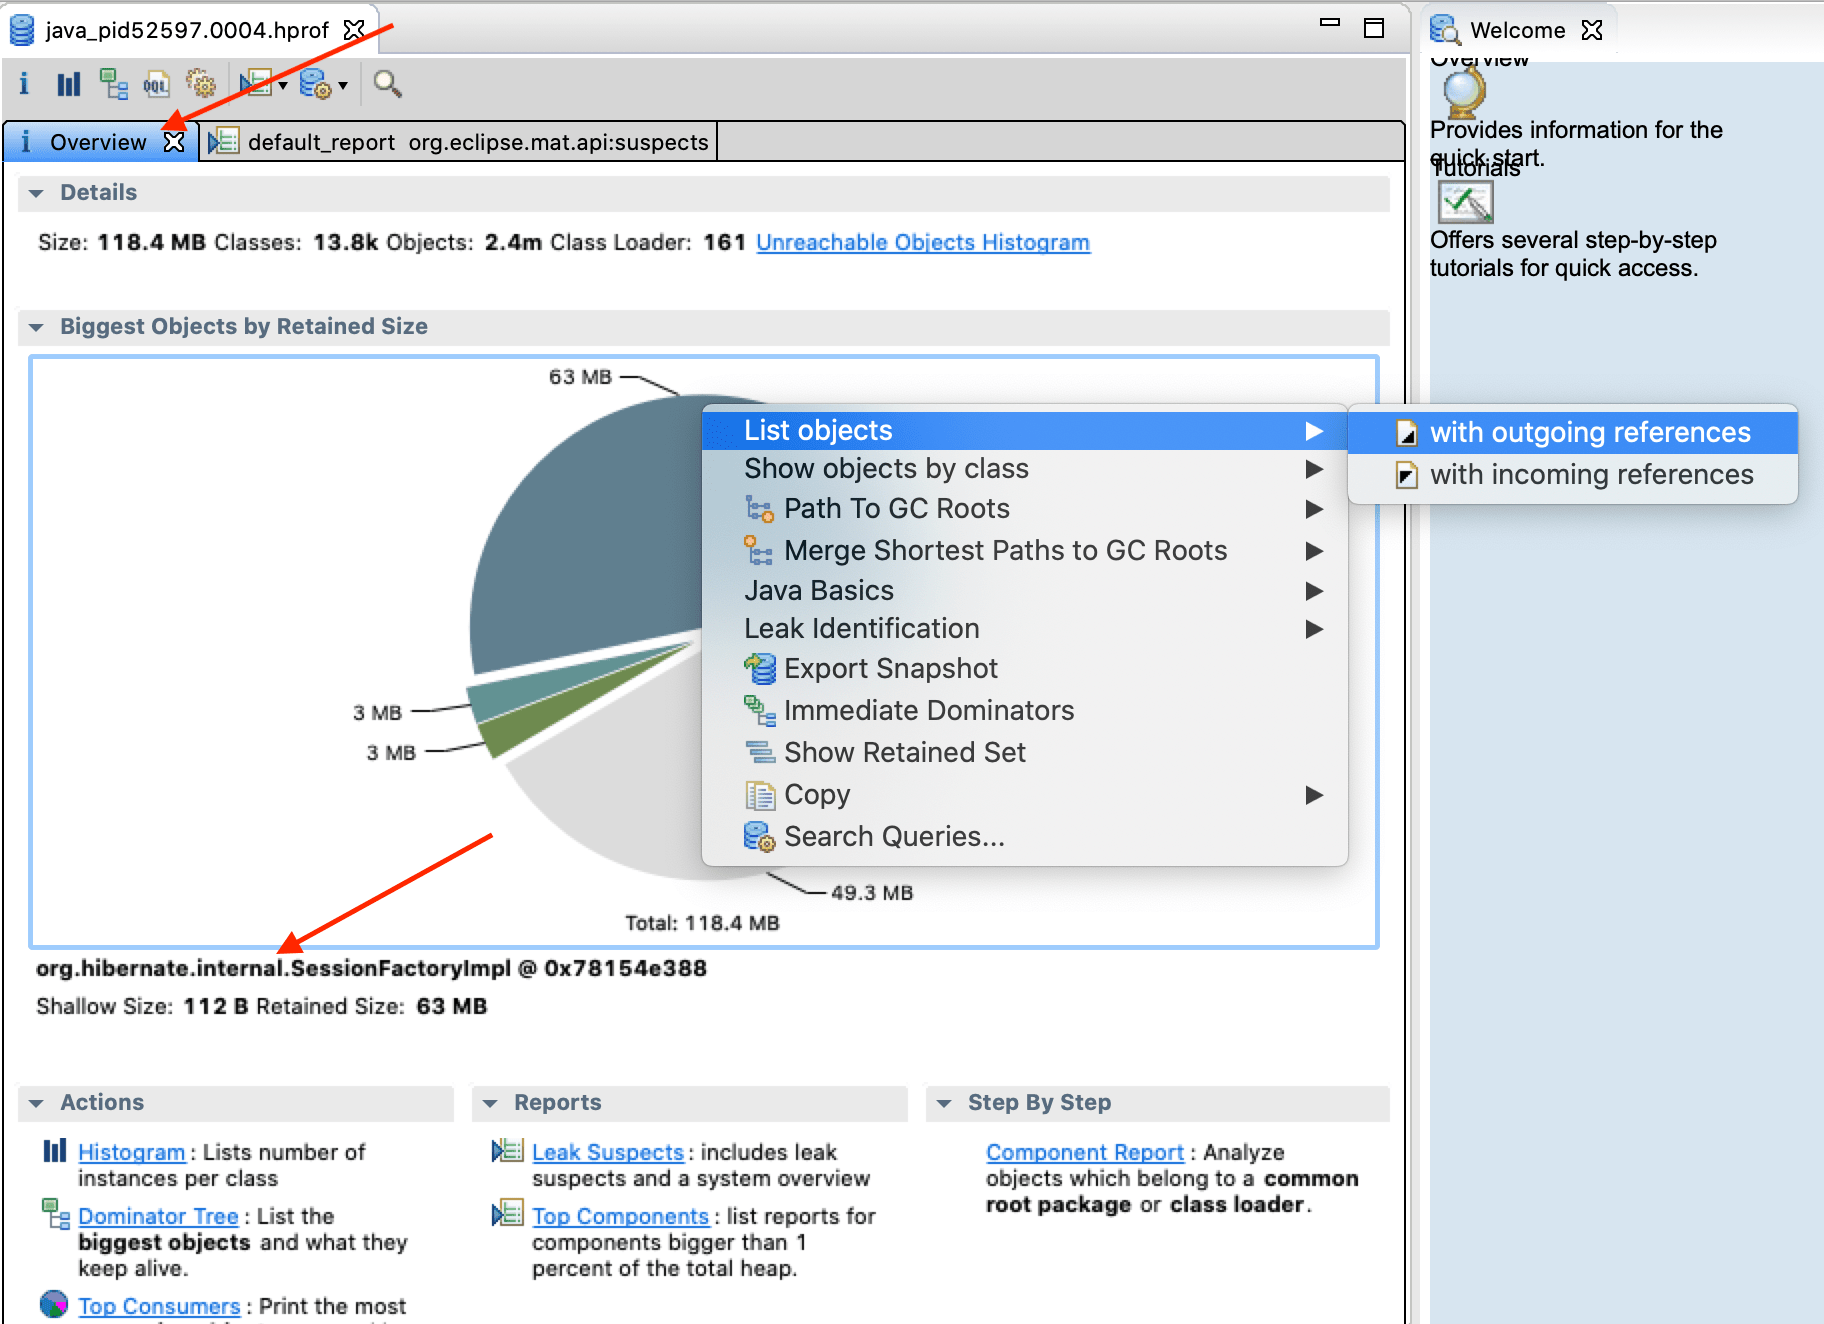 Eclipse Memory Analyzer main leak suspect’s objects with outgoing references
Eclipse Memory Analyzer now shows org.hibernate.internal.SessionFactoryImpl class instance with references to objects garbage collection cycles aren’t able to reclaim.
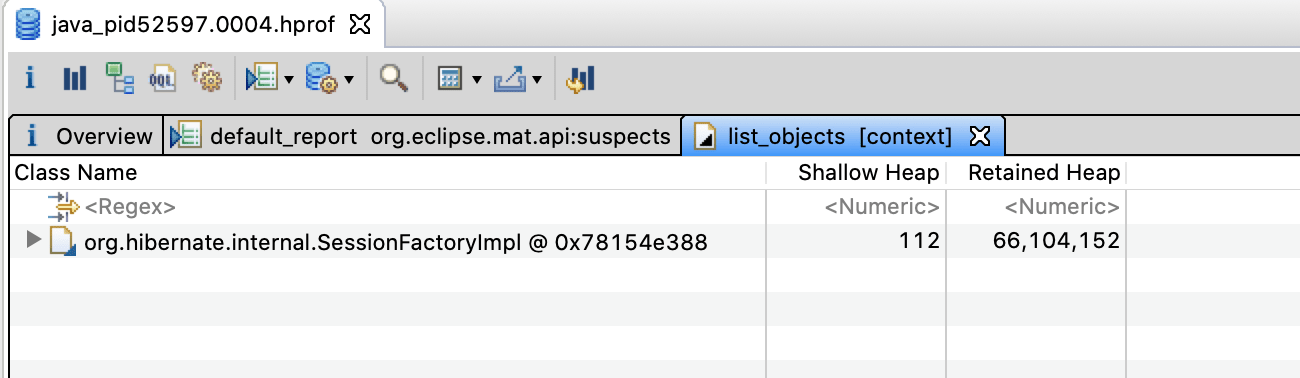 org.hibernate.internal.SessionFactoryImpl retained heap
- Let’s keep expanding the classes instances with higher Retained Heap size.
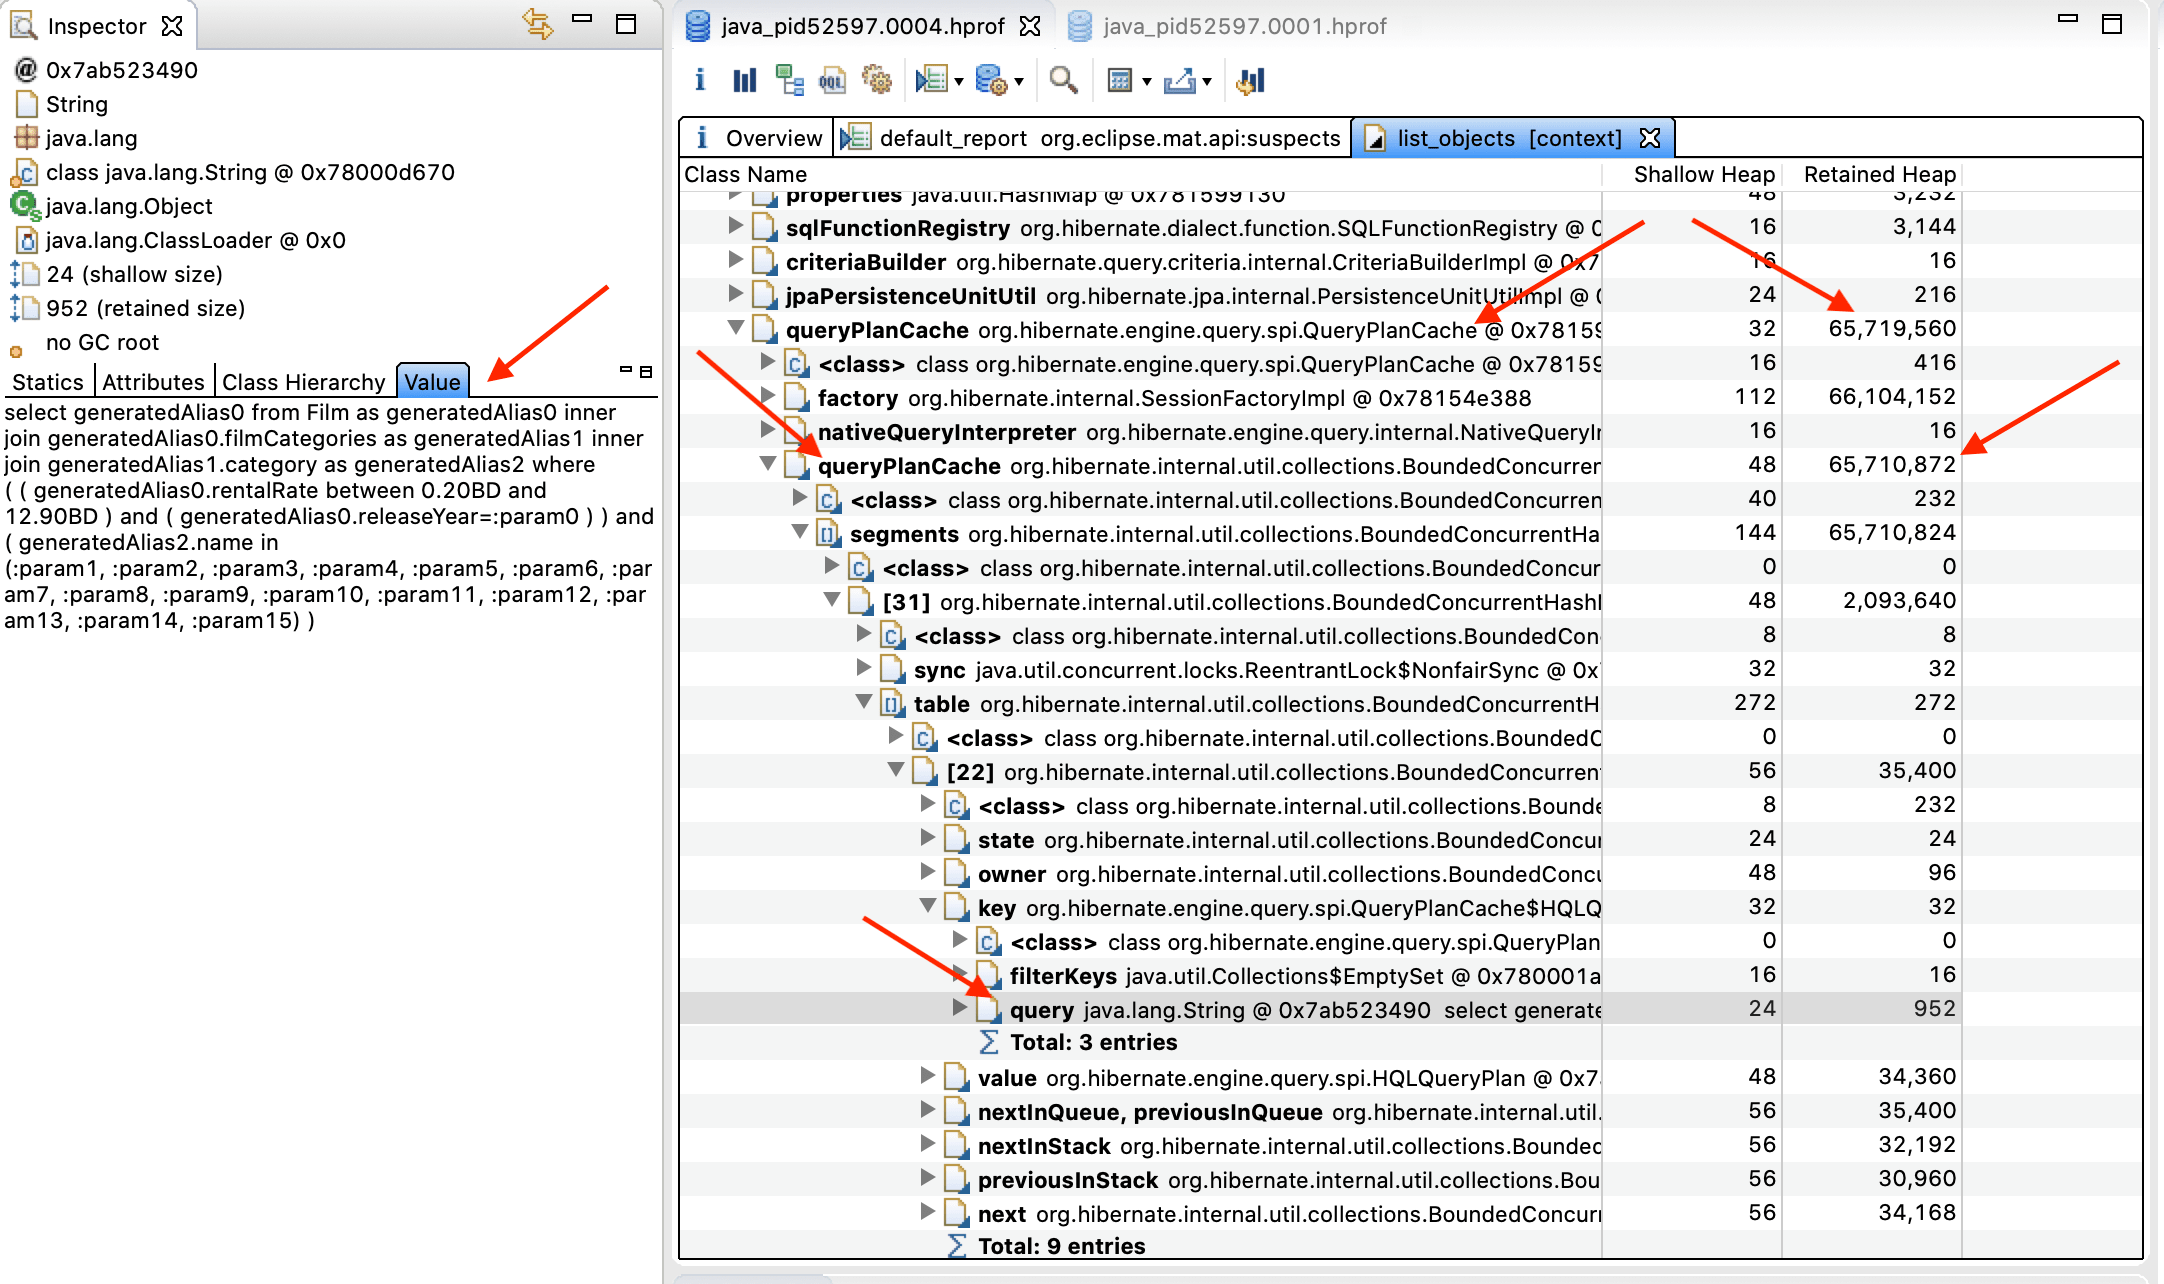
org.hibernate.engine.query.spi.QueryPlanCache retained heap
Look at QueryPlanCache.queryPlanCache Map attribute’s retained heap size. Objects seem to be piling up in this Map.
5.1. What’s Hibernate’s QueryPlanCache?
The QueryPlanCache is a cache that stores compiled query plans (in the queryPlanCache Map) and query-parameter metadata (in the parameterMetadataCache Map).
Whether you use JPQL (HQL) queries or Criteria queries, Hibernate parses each into an Abstract Syntax Tree (AST).
Parsing a String and compiling an AST might affect the performance of Java applications under a certain load. To prevent performance problems, Hibernate caches it so that it could be reused.
5.2. How does the QueryPlanCache affect the heap?
First, let’s see what this application does.
JMeter sends random requests like: /api/films?minRentalRate=<min rental rate>&maxRentalRate=<max rental rate>&releaseYear=<year>&category=<category 1>&category=<category 2>
with a random number of category request parameters.
The target application builds dynamic SQL queries using Spring Data JPA Specification and Criteria API. Meaning, if there is no query plan in the cache, Hibernate compiles a new one and caches it.
Let’s then take a look at a couple of String queries used as part of the QueryPlanCache keys:
select generatedAlias0 from Film as generatedAlias0 inner join generatedAlias0.filmCategories as generatedAlias1 inner join generatedAlias1.category as generatedAlias2 where ( ( generatedAlias0.rentalRate between 0.20BD and 12.90BD ) and ( generatedAlias0.releaseYear=:param0 ) ) and ( generatedAlias2.name in (:param1, :param2, :param3, :param4, :param5, :param6, :param7, :param8, :param9, :param10, :param11, :param12, :param13, :param14, :param15) ) select generatedAlias0 from Film as generatedAlias0 inner join generatedAlias0.filmCategories as generatedAlias1 inner join generatedAlias1.category as generatedAlias2 where ( ( generatedAlias0.rentalRate between 0.00BD and 5.10BD ) and ( generatedAlias0.releaseYear=:param0 ) ) and ( generatedAlias2.name in (:param1, :param2, :param3, :param4, :param5, :param6, :param7, :param8, :param9, :param10) )
Even though these queries are similar, we ended up having two entries in the cache.
Hibernate parametrized generatedAlias0.releaseYear=:param0 to prevent SQL injection because releaseYear is a String.
But generatedAlias0.rentalRate in the BETWEEN operator is not parametrized. It’s using literal values.
Also, generatedAlias2.name in the IN predicate includes a variable number of parameters. They are parametrized because Category.name is a String. Otherwise, you would be seeing literal values such as:
… generatedAlias2.<attribute> in (1, 2, 3, 4) … generatedAlias2.<attribute> in (4, 6, 8, 9, 10, 16)
There are a couple of issues with the BETWEEN operator and the IN predicate:
- Even discarding the
INpredicate, using literals in theBETWEENoperator causes a lot of cache misses. Unless/api/filmsendpoint client provides a dropdown to choose a rate range from, you will have a high rate of cache misses. - A variable or number of parameters in a
INpredicate causes the String used as part of the query plan cache keys:
to be different.
A high rate of cache misses means Hibernate compiling and caching ASTs and other information. Once the QueryPlanCache reaches its capacity, you now also run into another overhead and possible a performance penalty, cache eviction before adding new cache entries.
How do you fix these issues?
6. OPTIMIZE the QueryPlanCache
hibernate.query.plan_cache_max_size (defaults to 2048) and
hibernate.query.plan_parameter_metadata_max_size (defaults to 128)
Beware if you plan to set these values to other than their default.
If you set them too low, you might run into the overhead of evicting cache entries to make room for new ones.
If set it too high, you might run into memory contention.
How do you fix the literal values in the query keys problem?
You can reduce the number of cache misses by replacing literal values with binding parameters with this property: hibernate.criteria.literal_handling_mode=BIND
The query plan cache entry keys will now look like:
… ( generatedAlias0.rentalRate between :param0 and :param1 ) …
It wouldn’t matter if the next time the rental rate range is different. This part of the cache key renders the same.
This part of the query value would render like:
    where
        (
            film0_.rental_rate between ? and ?
        )
...
2021-01-23 17:01:57.994 TRACE 32994 --- [nio-8080-exec-2] o.h.type.descriptor.sql.BasicBinder      : binding parameter [1] as [NUMERIC] - [0.99]
2021-01-23 17:01:57.995 TRACE 32994 --- [nio-8080-exec-2] o.h.type.descriptor.sql.BasicBinder      : binding parameter [2] as [NUMERIC] - [4.99]
How do you mitigate the variable number of parameters in the IN predicate problem?
You can reduce the number of cache misses by padding the IN predicate parameters with this property: hibernate.query.in_clause_parameter_padding=true
The query plan cache entry keys should look like:
Partial cache key
Number of values Hibernate renders in the IN predicate
… ( generatedAlias2.name in (:param3) )
1
… ( generatedAlias2.name in (:param3, :param4) )
2
… ( generatedAlias2.name in (:param3, :param4, :param5, :param6) )
3, 4
… ( generatedAlias2.name in (:param3, :param4, :param5, :param6, :param7, :param8, :param9, :param10) )
5 through 8
Hibernate should now pad the query parameters until the next power of 2 number.
If the JPQL or Criteria query you wrote looks like: ... IN (?, ?, ?), Hibernate should update it to ... IN (?, ?, ?, ?) duplicating the 3rd value in the 4th parameter.
And I said should, because this is the purpose of the in_clause_parameter_padding property. Unfortunately enabling in_clause_parameter_padding doesn’t work when using Spring Data JPA Specification.
The good news is that I found extending JpaSpecificationExecutor can get in_clause_parameter_padding and Spring Data JPA Specification to work together. Stay tuned if you would like to be notified when I publish a follow-up post.
7. CONCLUSION
This tutorial covered running a JMeter load test to identify memory and garbage collection problems you might have in your Spring Boot applications.
Whether you use Criteria or JPQL queries, Hibernate compiles and caches an AST for each query that wasn’t found in the QueryPlanCache. This might lead to a high rate of cache misses affecting your Spring Boot application performance. Worst, you might experience OutOfMemoryError exceptions.
It also helped you with Hibernate configuration to improve the QueryPlanCache cache hits. Specifically, replacing literal values with binding parameters and padding the IN predicates.
Unfortunately, combining Spring Data JPA Specification IN predicates with in_clause_parameter_padding didn’t work as expected. But I’ll address it in a follow-up post.
Thanks for reading and as always, feedback is very much appreciated. If you found this post helpful and would like to receive updates when content like this gets published, sign up to the newsletter.
8. SOURCE CODE
Accompanying source code for this blog post can be found at:
9. REFERENCES
Recommend
About Joyk
Aggregate valuable and interesting links.
Joyk means Joy of geeK