

Statistics and Research
source link: https://ourworldindata.org/mortality-risk-covid
Go to the source link to view the article. You can view the picture content, updated content and better typesetting reading experience. If the link is broken, please click the button below to view the snapshot at that time.
What does the data on deaths and cases tell us about the mortality risk of COVID-19?
To understand the risks and respond appropriately we would also want to know the mortality risk of COVID-19 – the likelihood that someone who catches the disease will die from it.
We look into this question in more detail here and explain that this requires us to know – or estimate – the number of total cases and the final number of deaths for a given infected population. Because these are not known, we discuss what the current data can and can not tell us about the risk of death (here).
How did confirmed deaths and cases change over time?
So far we focused first on confirmed deaths and then on confirmed cases.
This chart shows both metrics.
How you can interact with this chart
By now you know that in these charts it is always possible to switch to any other country in the world by choosing Change Country in the bottom left corner.You can sort the table by any of the columns by clicking on the column header.
The case fatality rate
Related chart:
The case fatality rate is simply the ratio of the two metrics shown in the chart above.
The case fatality rate is the number of confirmed deaths divided by the number of confirmed cases.
This chart here plots the CFR calculated in just that way.
During an outbreak – and especially when the total number of cases is not known – one has to be very careful in interpreting the CFR. We wrote a detailed explainer on what can and can not be said based on current CFR figures.
There is a straightforward question that most people would like answered. If someone is infected with COVID-19, how likely is that person to die?
This question is simple, but surprisingly hard to answer.
Here we explain why that is. We’ll discuss the “case fatality rate”, the “crude mortality rate”, and the “infection fatality rate”, and why they’re all different.
The key point is that the “case fatality rate”, the most commonly discussed measure of the risk of dying, is not the answer to the question, for two reasons. One, it relies on the number of confirmed cases, and many cases are not confirmed; and two, it relies on the total number of deaths, and with COVID-19, some people who are sick and will die soon have not yet died. These two facts mean that it is extremely difficult to make accurate estimates of the true risk of death.
The case fatality rate (CFR)
In the media, it is often the “case fatality rate” that is talked about when the risk of death from COVID-19 is discussed.1 This measure is sometimes called case fatality risk or case fatality ratio, or CFR.
But this is not the same as the risk of death for an infected person – even though, unfortunately, journalists often suggest that it is. It is relevant and important, but far from the whole story.
The CFR is very easy to calculate. You take the number of people who have died, and you divide it by the total number of people diagnosed with the disease. So if 10 people have died, and 100 people have been diagnosed with the disease, the CFR is [10 / 100], or 10%.
But it’s important to note that it is the ratio between the number of confirmed deaths from the disease and the number of confirmed cases, not total cases. That means that it is not the same as – and, in fast-moving situations like COVID-19, probably not even very close to – the true risk for an infected person.
Another important metric, which should not be confused with the CFR, is the crude mortality rate.
The crude mortality rate
The “crude mortality rate” is another very simple measure, which like the CFR gives something that might sound like the answer to the question that we asked earlier: if someone is infected, how likely are they to die?
But, just as with CFR, it is actually very different.
The crude mortality rate – sometimes called the crude death rate – measures the probability that any individual in the population will die from the disease; not just those who are infected, or are confirmed as being infected. It’s calculated by dividing the number of deaths from the disease by the total population. For instance, if there were 10 deaths in a population of 1,000, the crude mortality rate would be [10 / 1,000], or 1%, even if only 100 people had been diagnosed with the disease.
This difference is important: unfortunately, people sometimes confuse case fatality rates with crude death rates. A common example is the Spanish flu pandemic in 1918. One estimate, by Johnson and Mueller (2002), is that that pandemic killed 50 million people.2 That would have been 2.7% of the world population at the time. This means the crude mortality rate was 2.7%.
But 2.7% is often misreported as the case fatality rate – which is wrong, because not everyone in the world was infected with Spanish flu. If the crude mortality rate really was 2.7%, then the case fatality rate was much higher – it would be the percentage of people who died after being diagnosed with the disease. [We look at the global death count of this pandemic and others here.]
What we want to know isn’t the case fatality rate: it’s the infection fatality rate
Before we look at what the CFR does tell us about the mortality risk, it is helpful to see what it doesn’t.
Remember the question we asked at the beginning: if someone is infected with COVID-19, how likely is it that they will die? The answer to that question is captured by the infection fatality rate, or IFR.
The IFR is the number of deaths from a disease divided by the total number of cases. If 10 people die of the disease, and 500 actually have it, then the IFR is [10 / 500], or 2%.3,4,5,6,7
To work out the IFR, we need two numbers: the total number of cases and the total number of deaths.
However, as we explain here, the total number of cases of COVID-19 is not known. That’s partly because not everyone with COVID-19 is tested.8,9
We may be able to estimate the total number of cases and use it to calculate the IFR – and researchers do this. But the total number of cases is not known, so the IFR cannot be accurately calculated. And, despite what some media reports imply, the CFR is not the same as – or, probably, even similar to – the IFR. Next, we’ll discuss why.
Interpreting the case fatality rate
In order to understand what the case fatality rate can and cannot tell us about a disease outbreak such as COVID-19, it’s important to understand why it is difficult to measure and interpret the numbers.
The case fatality rate isn’t constant: it changes with the context
Sometimes commentators talk about the CFR as if it’s a single, steady number, an unchanging fact about the disease.
But it’s not a biological constant; instead, it reflects the severity of the disease in a particular context, at a particular time, in a particular population.
The probability that someone dies from a disease doesn’t just depend on the disease itself, but also on the treatment they receive, and on the patient’s own ability to recover from it.
This means that the CFR can decrease or increase over time, as responses change; and that it can vary by location and by the characteristics of the infected population, such as age, or sex. For instance, older populations would expect to see a higher CFR from COVID-19 than younger ones.
The CFR of COVID-19 differs by location, and has changed during the early period of the outbreak
The case fatality rate of COVID-19 is not constant. You can see that in the chart below, first published in the Report of the WHO-China Joint Mission on Coronavirus Disease 2019 (COVID-19), in February 2020.10
It shows the CFR values for COVID-19 in several locations in China during the early stages of the outbreak, from the beginning of January to 20th February 2020.
You can see that in the earliest stages of the outbreak the CFR was much higher: 17.3% across China as a whole (in yellow) and greater than 20% in the centre of the outbreak, in Wuhan (in blue).
But in the weeks that followed, the CFR declined, reaching as low as 0.7% for patients who first showed symptoms after February 1st. The WHO says that that is because “the standard of care has evolved over the course of the outbreak”.
You can also see that the CFR was different in different places. By 1st February, the CFR in Wuhan was still 5.8% while it was 0.7% across the rest of China.
This shows that what we said about the CFR generally – that it changes from time to time and place to place – is true for the CFR of COVID-19 specifically. When we talk about the CFR of a disease, we need to talk about it in a specific time and place – the CFR in Wuhan on 23rd February, or in Italy on 4th March – rather than as a single unchanging value.

There are two reasons why the case fatality rate does not reflect the risk of death
If the case fatality rate does not tell us the risk of death for someone infected with the disease, what does it tell us? And how does the CFR compare with the actual (unknown) probability?
There are two reasons why we would expect the CFR not to represent the real risk. One of them would tend to make the CFR an overestimate – the other would tend to make it an underestimate.
When there are people who have the disease but are not diagnosed, the CFR will overestimate the true risk of death. With COVID-19, we think there are many undiagnosed people.
As we saw above, in our discussion on the difference between total and confirmed cases (here), we do not know the number of total cases. Not everyone is tested for COVID-19, so the total number of cases is higher than the number of confirmed cases.
And whenever there are cases of the disease that are not counted, then the probability of dying from the disease is lower than the reported case fatality rate. Remember our imaginary scenario with 10 deaths and 100 cases. The CFR in that example is 10% – but if there are 500 real cases, then the real risk (the IFR) is just 2%.
Or in one sentence. If the number of total cases is higher than the number of confirmed cases, then the ratio between deaths and total cases is smaller than the ratio between deaths and confirmed cases. This of course assumes that there is not also significant undercounting in the number of deaths; it’s plausible that some deaths are missed or go unreported, but we’d expect the magnitude of undercounting to be less than for cases.
Importantly, this means that the number of tests carried out affects the CFR – you can only confirm a case by testing a patient. So when we compare the CFR between different countries, the differences do not only reflect rates of mortality, but also differences in the scale of testing efforts.
When some people are currently sick and will die of the disease, but have not died yet, the CFR will underestimate the true risk of death. With COVID-19, there are many who are currently sick and will die, but have not yet died. Or, they may die from the disease but be listed as having died from something else.
In ongoing outbreaks, people who are currently sick will eventually die from the disease. This means that they are currently counted as a case, but will eventually be counted as a death too. This means the CFR right now is an underestimate of what it will be when the disease has run its course.
With the COVID-19 outbreak, it can take between two to eight weeks for people to go from first symptoms to death, according to data from early cases (we discuss this here).12
This is not a problem once an outbreak has finished. Afterwards, the total number of deaths will be known, and we can use it to calculate the CFR. But during an outbreak, we need to be careful with how to interpret the CFR because the outcome (recovery or death) of a large number of cases is still unknown.
This is a common source for misinterpretation of a rising CFR in the earlier stages of an outbreak.13
This is what happened during the SARS-CoV outbreak in 2003: the CFR was initially reported to be 3-5% during the early stages of the outbreak, but had risen to around 10% by the end.14,15
This is not just a problem for statisticians: it had real negative consequences for our understanding of the outbreak. The low numbers that were published initially resulted in an underestimate of the severity of the outbreak. And the rise of the CFR over time gave the wrong impression that SARS was becoming more deadly over time. These errors made it harder to come up with the right response.
The current case fatality rate of COVID-19
We should stress again that there is no single figure of CFR for any particular disease. The CFR varies by location, and is typically changing over time.
As this paper shows16, CFRs vary widely between countries, from 0.2% in Germany to 7.7% in Italy. But it says that this is not necessarily an accurate comparison of the true likelihood that someone with COVID-19 will die of it.
We do not know how many cases are asymptomatic versus symptomatic, or whether the same criteria for testing are being applied between countries. Without better and more standardised criteria for testing and for the recording of deaths, the real mortality rate is unknown. As thepaper says, to understand the differences in CFR and how they should guide decision-making, we need better data.
But if we’re careful to acknowledge its limitations, CFR can help us to better understand the severity of the disease and what we should do about it.
This chart shows how these early CFR values compare. You can see the total number of confirmed cases of COVID-19 (on the x-axis, going across) versus the total number of deaths (on the y-axis, going up).
The grey lines show a range of CFR values – from 0.25% to 10%.
Where each country lies indicates its CFR – for instance, if a country lies along the 2% line, its current confirmed cases and death figures indicate it has a CFR of 2%.
The second chart shows how the CFR has changed over time in countries that have had over 100 confirmed cases.
We have excluded countries which still have a relatively small number of confirmed cases, because CFR is a particularly poor metric to understand mortality risk with a small sample size.
We see this if we look at the trajectory of cases and deaths in Iran: on February 24th it had 2 confirmed cases and 2 deaths, an implausible CFR of 100%. With time its CFR begins to fall, as the number of confirmed cases increases. By the time it has seen hundreds of cases, the CFR drops to around the level seen in other countries.
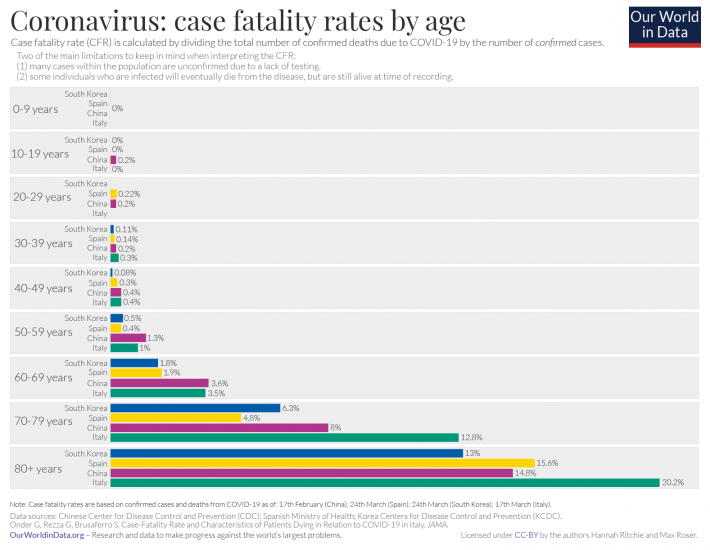
Case fatality rate of COVID-19 by age
Current data across countries suggests that the elderly are most at risk
It’s helpful to estimate the risk of death across a population – the average IFR, the chance of death if a random person in the country were to catch the disease, which we discussed above. It helps us know the severity of an outbreak.
But during an outbreak, it’s also crucial to know which groups within a population are most at risk. If we know which sections of society are most likely to die, or suffer other serious consequences, then that allows us to direct our resources towards the most vulnerable, who need them the most.
In the chart below, we see a breakdown of the CFR by age group across various countries who have made demographic data on confirmed cases and deaths available. It shows very large differences of the CFR by age.
This data is based on the number of confirmed cases and deaths in each age group as reported by national agencies. The figures come from the Chinese Center for Disease Control and Prevention (CDC) as of 17th February; Spanish Ministry of Health as of 24th March; Korea Centers for Disease Control and Prevention (KCDC) as of 24th March; and the Italian National Institute of Health, as presented in the paper by Onder et al. (2020) as of 17th March.17,18
Again it’s important to stress that the CFR simply represents the number of deaths divided by the number of confirmed cases. It does not tell us the true risk of death, which (as we say above) is much harder to estimate. The CFR changes over time, and differences between countries do not necessarily reflect real differences in the risk of dying from COVID-19. Instead, they may reflect differences in the extent of testing, or the stage a country is in its trajectory through the outbreak.
For many infectious diseases young children are most at risk. For instance, in the case of malaria, the majority of deaths (57% globally) are in children under five. The same was true for the largest pandemic in recorded history: During the ‘Spanish flu’ in 1918, children and young adults were at the greatest risk from the pandemic (we write more about this in the article here).
For COVID-19 cases the opposite seems to be true. The elderly are at the greatest risk of dying, if infected with this virus.
It may not simply be that the older you get, the more at risk you are, though. As we show in the next section, the CFR for people with underlying health conditions – such as cardiovascular diseases, respiratory diseases or diabetes – is higher than for those without. Elderly people are more likely to have those conditions, which is likely to be part of the reason why the elderly are most at risk from COVID-19.
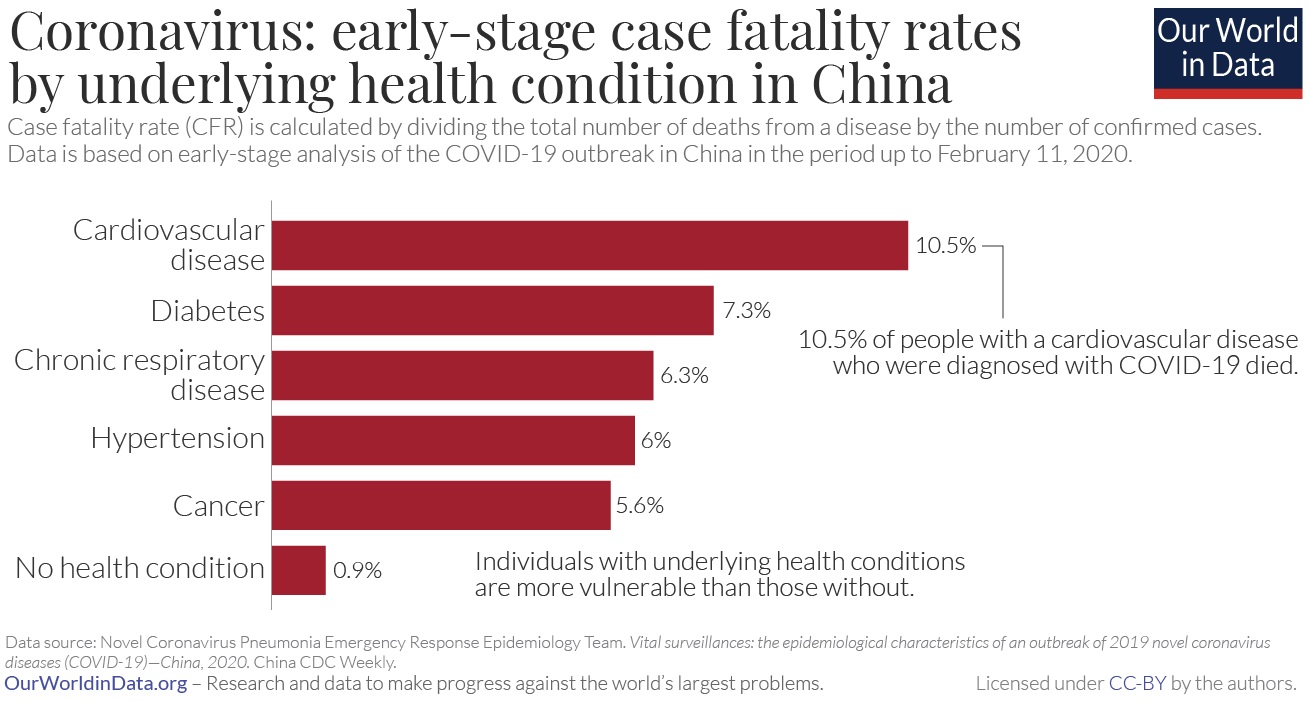
Case fatality rate of COVID-19 by preexisting health conditions
Early data from China suggests that those with underlying health conditions are at a higher risk
The chart here shows the case fatality rate for populations within China based on their health status or underlying health condition.
This is based on the same data from the Center for Disease Control and Prevention as we discussed in the section on age.21 This analysis was based on recorded deaths and cases in China in the period up to February 11th 2020.
The researchers found that the CFR for those with an underlying health condition is much higher than for those without. For instance, more than 10% of people with a cardiovascular disease, and who were diagnosed with COVID-19, died. Diabetes, chronic respiratory diseases, hypertension, and cancer were all risk factors as well, as we see in the chart.
By comparison, the CFR was 0.9% – more than ten times lower – for those without a preexisting health condition.
Above we saw that the elderly are most at risk of dying from COVID-19. As we said there, that might be partly explained by the fact that they are also most likely to have underlying health conditions such as cardiovascular disease, respiratory disease and diabetes; these health conditions make it more difficult to recover from the COVID-19 infection.
Case fatality rate of COVID-19 compared to other diseases
How does the case fatality rate (CFR) of COVID-19 compare to other virus outbreaks and diseases?
Once again, we should stress what we discussed above. One has to understand the measurement challenges and the definitions to interpret estimates of the CFR for COVID-19, particularly those relating to an ongoing outbreak.
As comparisons, the table shows the case fatality rates for other disease outbreaks. The CFR of SARS-CoV and MERS-CoV were high: 10% and 34%, respectively.22
The US seasonal flu has a case fatality rate of approximately 0.1% to 0.2% – lower than the current CFR for COVID-19.23
Sources of data shown in the table:
SARS-CoV: Venkatesh, S. & Memish, Z.A. (2004). SARS: the new challenge to international health and travel medicine. EMHJ – Eastern Mediterranean Health Journal, 10 (4-5), 655-662, 2004.
SARS-CoV and MERS-CoV: Munster, V. J., Koopmans, M., van Doremalen, N., van Riel, D., & de Wit, E. (2020). A novel coronavirus emerging in China—key questions for impact assessment. New England Journal of Medicine, 382(8), 692-694.
Seasonal flu: US Centers for Disease Control and Prevention (CDC). Influenza Burden, 2018-19.
Ebola: Shultz, J. M., Espinel, Z., Espinola, M., & Rechkemmer, A. (2016). Distinguishing epidemiological features of the 2013–2016 West Africa Ebola virus disease outbreak. Disaster Health, 3(3), 78-88.
Ebola: World Health Organization (2020). Ebola virus disease: Factsheet.
Venkatesh and Memish (2004)
Munster et al. (2020)MERS-CoV34%
Munster et al. (2020)Seasonal flu (US)0.1 to 0.2%
US CDCEbola50%
40% in the 2013-16 outbreak
WHO (2020)
Shultz et al. (2016)
Recommend
About Joyk
Aggregate valuable and interesting links.
Joyk means Joy of geeK