

Troubleshooting Application Insights Daily Cap problems and using Adaptive Sampl...
source link: https://www.irisclasson.com/2019/11/10/troubleshooting-application-insights-daily-cap-problems-and-using-adaptive-sampling/
Go to the source link to view the article. You can view the picture content, updated content and better typesetting reading experience. If the link is broken, please click the button below to view the snapshot at that time.
Troubleshooting Application Insights Daily Cap problems and using Adaptive Sampling
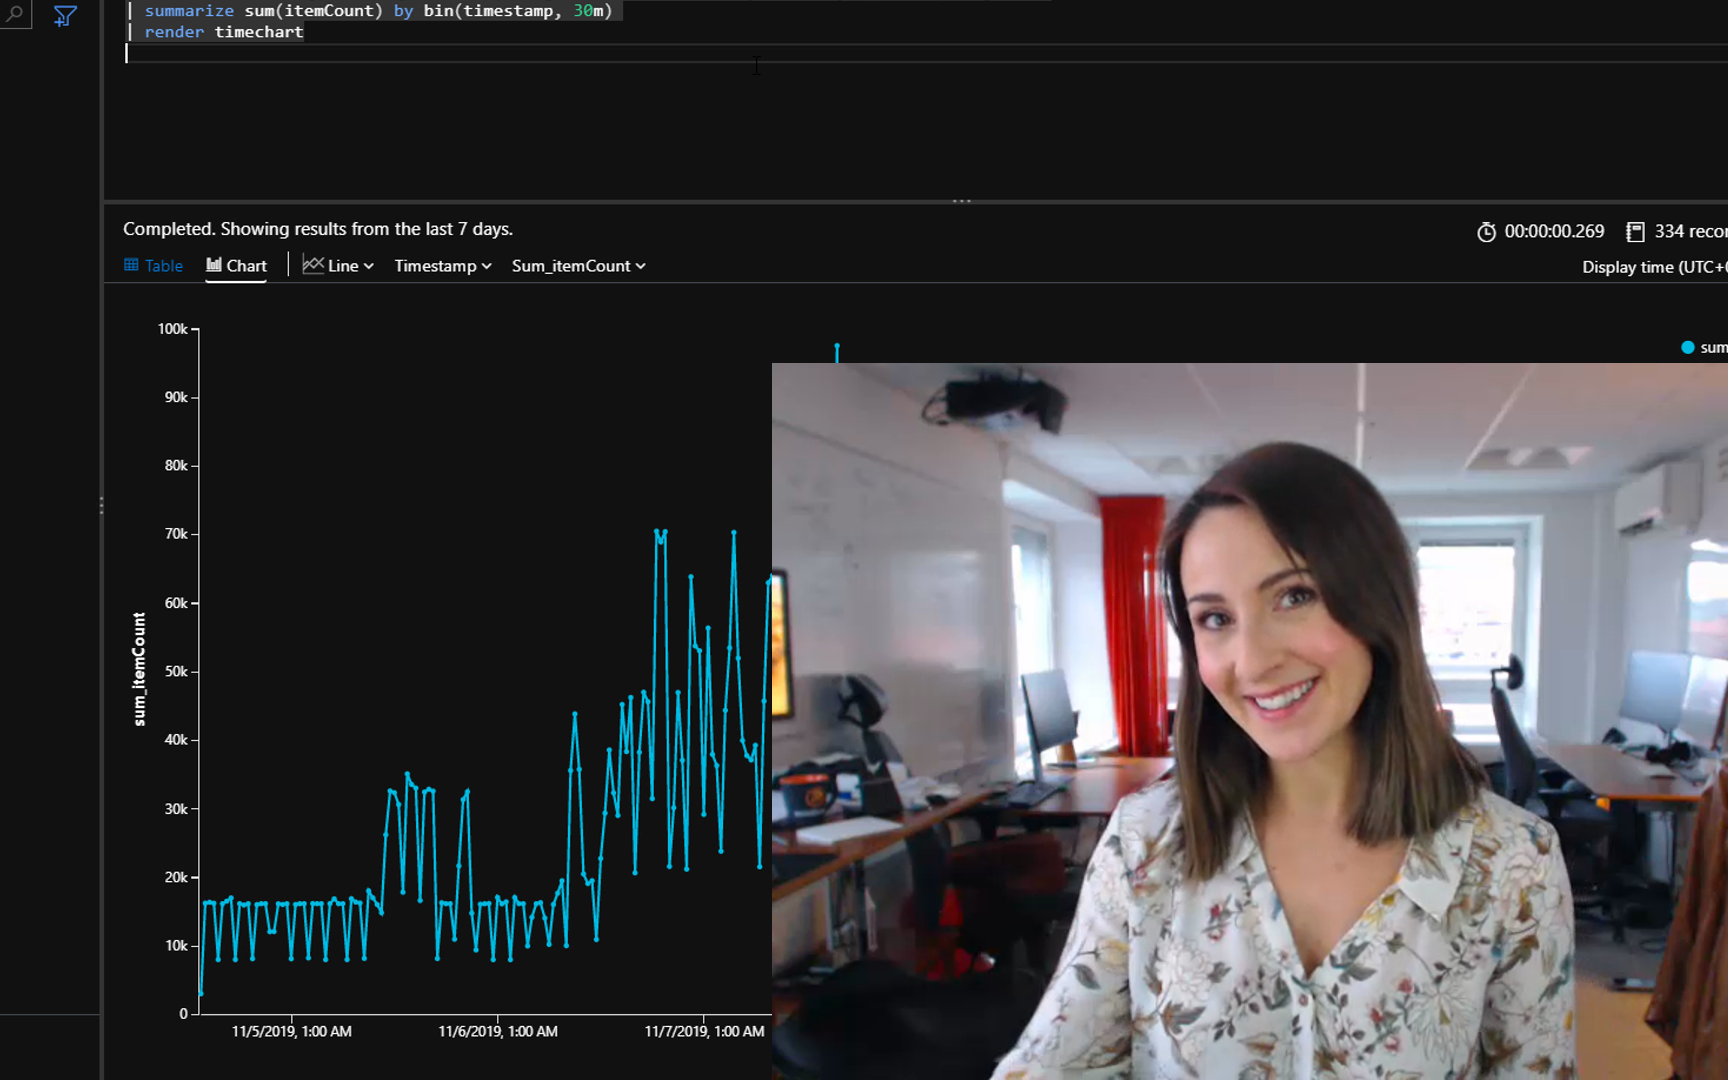
Last Friday we received a notification from Azure that one of our Application Insights resources had hit its daily cap of 1GB (with our current plan). As I’m documenting various aspects of our system before I change job in February, I decided to record a video showing how to do a simple troubleshooting with Logs Analytics and the query language Kusto.
For details watch the video :)
The short version goes like this:
Use ‘search *’ to search all telemetry items, and pipe to count if you expect many items and are only interested in the count
Query:
Search * | count
Expand the filter panel on the left side and select a filter that helps you narrow down your search- for example telemetry type. Apply and Run
Use the filter panel again to apply additional filters
When you don’t have any useful filter suggestions remove the count, limit the timespan and find reoccurring items. Right click on the dotted line for an item to include or exclude to the current query to narrow down the search even more.
I noticed that the problem was our Hangfire service was logging every single dependency call that checks every second if there are jobs available to process, in addition to frequent sp_getapplock calls. This can be fixed with either filtering of telemetry logging, or by using sampling.
Filtering
Is done by writing a filter that is applied at startup. Generally, we want to avoid too many filters as they are hard to discover, and might result in a performance impact.
(Adaptive) Sampling
This our the preferred method. Adaptive sampling lets us sample log items instead of logging every entry and can be configured in different ways. The easiest setup is configuring telemetry items per second for a specific telemetry type or types. This is done in the application insights XML config file. Use IncludedTypes to set which types the sampling should apply to (separated by semicolon) OR use ExcludedTypes which will apply the sampling to all types except the ones listed. In neither is set the sampling will apply to all. You can read more about sampling here
  <Add Type="Microsoft.ApplicationInsights.WindowsServer.TelemetryChannel.AdaptiveSamplingTelemetryProcessor, Microsoft.AI.ServerTelemetryChannel">
<MaxTelemetryItemsPerSecond>5</MaxTelemetryItemsPerSecond>
<IncludedTypes>Dependency</IncludedTypes>
</Add>
Sampling doesn’t have to be adaptive, there are two other ways:
Ingestion sampling and Fixed-rate sampling.
Ingestion sampling is configured from the portal, and instead of setting sampling server side, all items are sent to the portal and they are instead filtered there. If you need to change the sampling often, and want to avoid redeploying the service, then this can be a good option. I recommend that, if possible, we stick to one or two ways and configurations for sampling, so we know what is sampled and how so we can predict load and know which data is omitted from our stats and searches.
Comments
Leave a comment (via email)Last modified on 2019-11-10
Recommend
About Joyk
Aggregate valuable and interesting links.
Joyk means Joy of geeK