

Monitoring and Observability at Picnic - Picnic Engineering
source link: https://blog.picnic.nl/monitoring-and-observability-at-picnic-684cefd845c4?gi=de6b608fae37
Go to the source link to view the article. You can view the picture content, updated content and better typesetting reading experience. If the link is broken, please click the button below to view the snapshot at that time.
Monitoring and Observability at Picnic

What does a typical 24 hours look like at Picnic? Customer demand is predicted, tens of thousands of trading units are ordered from suppliers, and delivered Just In Time to our warehouses. Then hundreds of thousands of products are processed, shelved and picked into customer totes by Shoppers and shipped in dozens of trucks to dozens of distribution hubs. Runners then off-load them into a fleet of hundreds of electric powered vehicles and deliver them on optimally preplanned routes through towns and cities to deliver them right to your front doorstep. The journey that the humble banana takes in that time is quite entertaining to think about. And we are simply covering the last, albeit critical stretch of the marathon if you pan out to include the producer and supplier journey that the banana takes.
At some point in this short timeframe, you, as a customer, place an order for that very banana. It finally has a home!
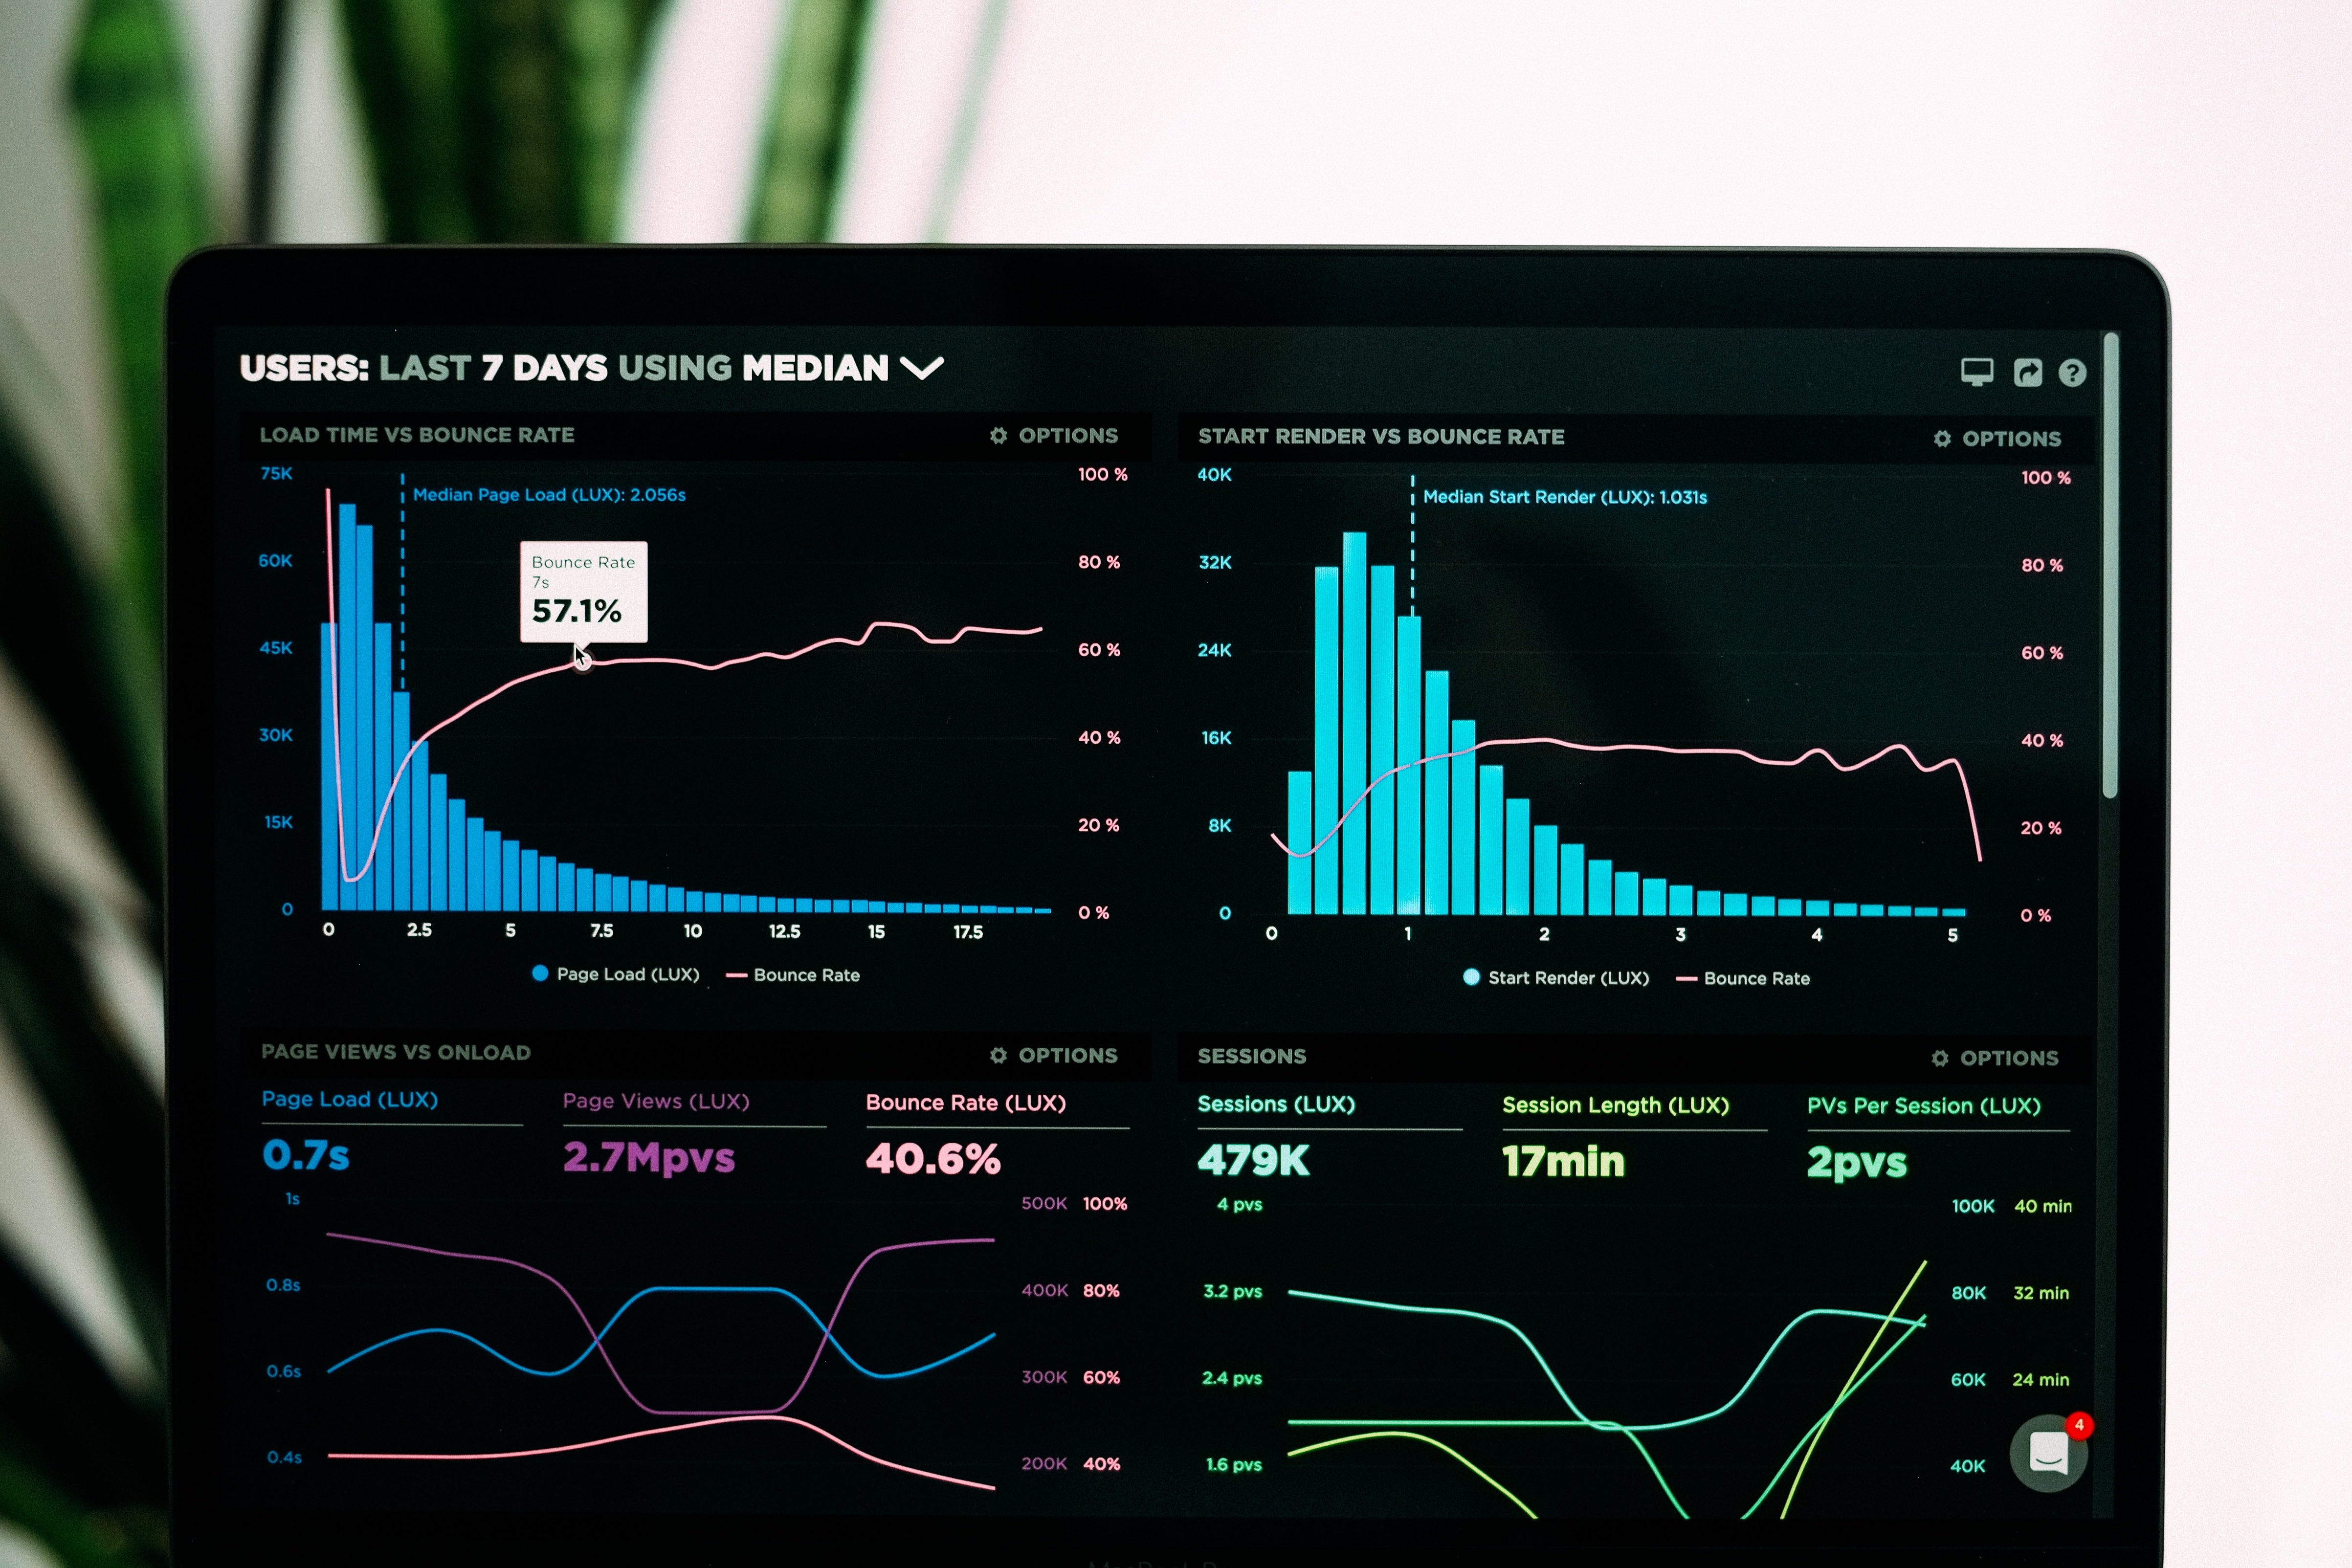
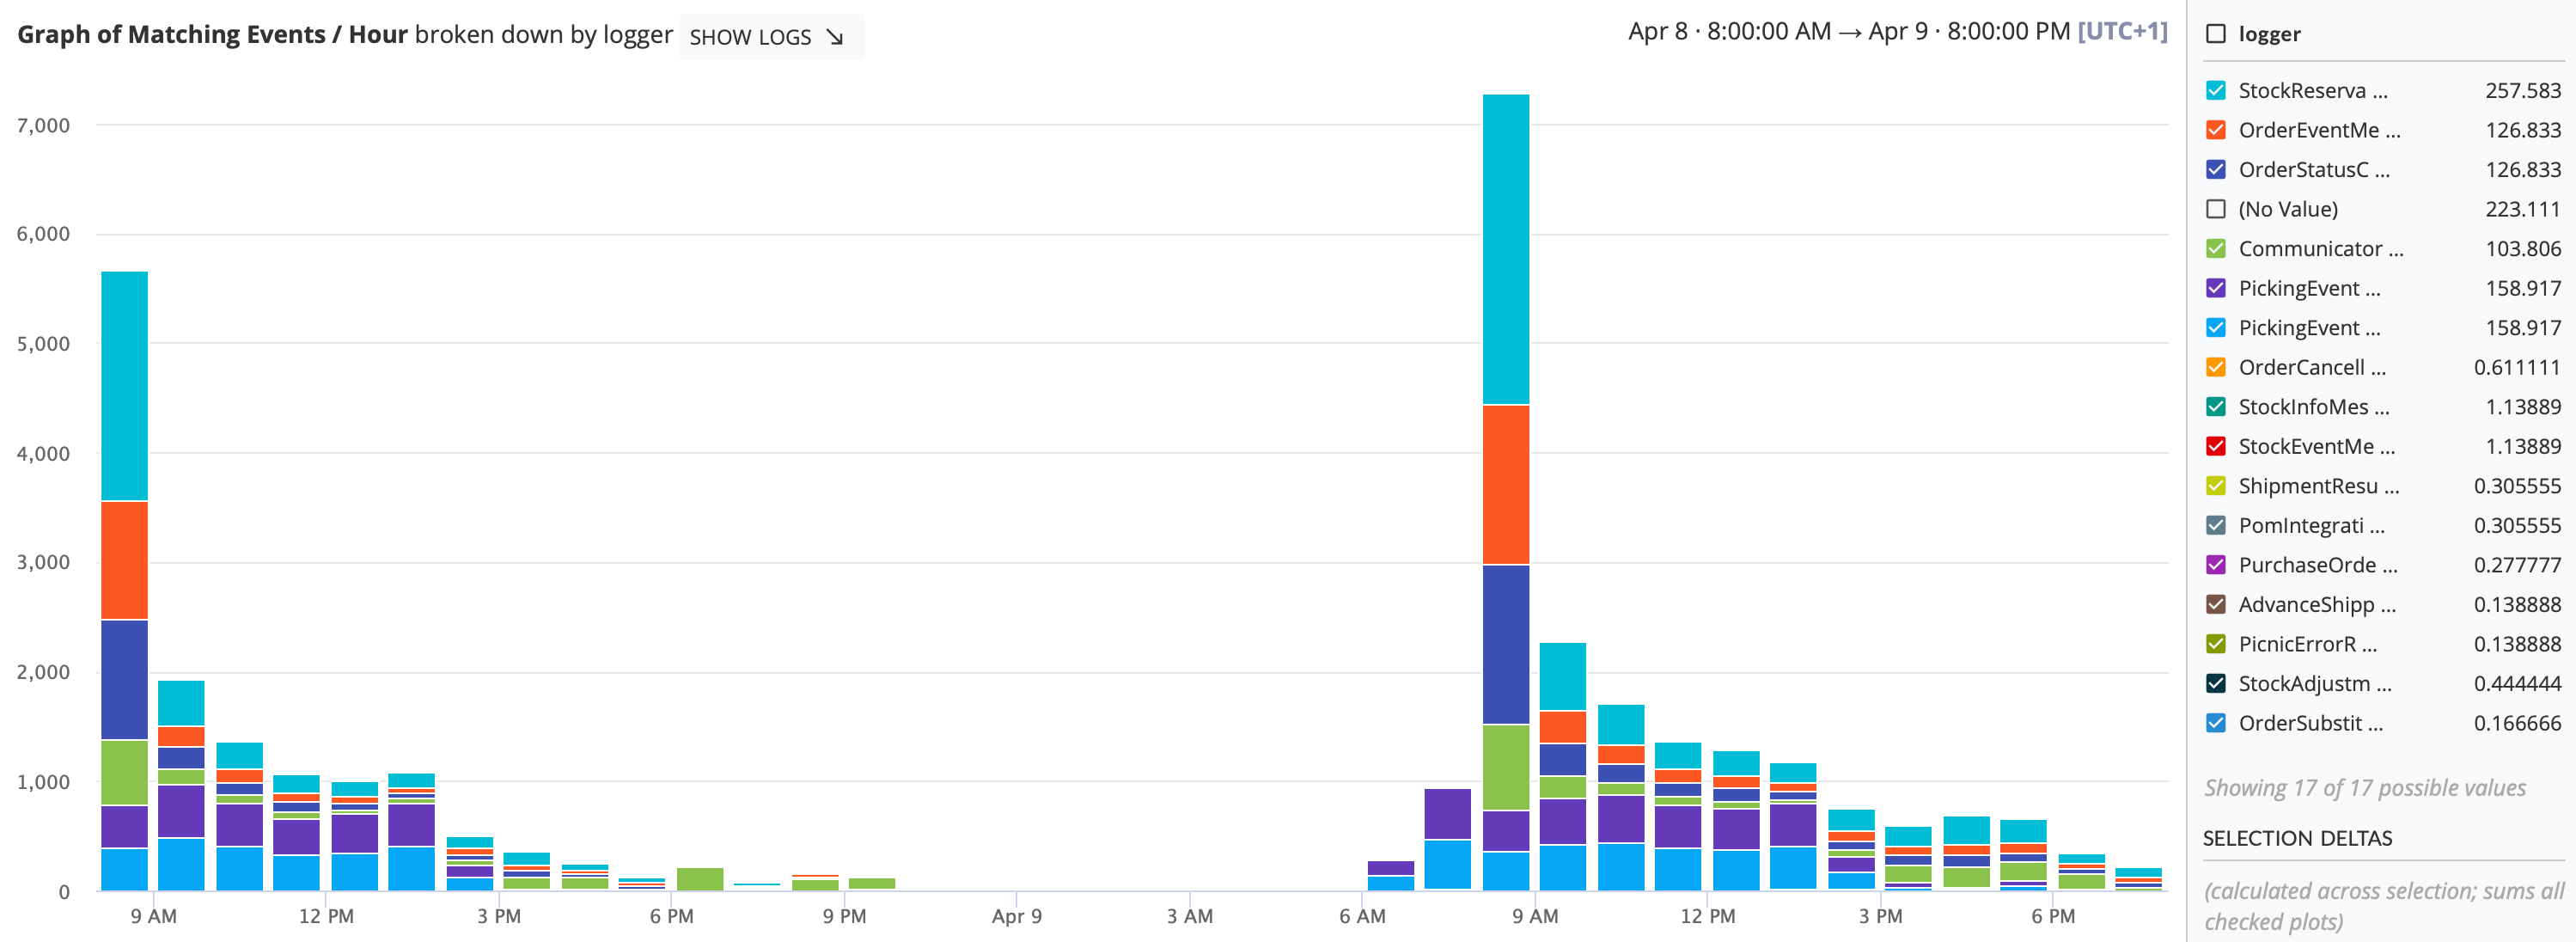
You can probably imagine yourself how many events there are occurring on a daily basis, simply on behalf of this banana 🍌. But if you can’t then just take a look for yourself!

At every link in this customer supply chain there is a Picnic system, working behind the scenes, to deliver that article as safely, optimally and as swiftly as possible. How do we make sure that this is happening, and that all systems are doing their job correctly? Two angles: monitoring and observability.
Monitoring and Observability
Let’s clear the air. Monitoring and observability. What’s the difference?
In one line: Monitoring is the instrument and observability is the measure of insights which applying that instrument gives you into the observed system.
Think of it like this: a microscope can be a great monitoring instrument. You can monitor the state of a chemical reaction or biological interaction through the lens of a microscope. The degree of insight into which a microscope gives you depends on focal length, magnification and perhaps most importantly, what you are looking for. If you are looking for a cell and you can only see molecular structures, then even with this great monitoring tool you have little or no observability.
In terms of technology and software engineering we have great monitoring tools, but often we don’t have a great degree of observability. How often have you been in the following situation? There is an issue with your application, you hear about it though a nonconventional alerting channel, for example an end user over Slack. The first thing you do is jump onto your dashboards and they are all green. You have no option other than to trawl through logs and traces or throw the ball back into the users court and try and get more information out of what issue they saw. You have a blindspot in your application’s observability.
Observability is comprised of three pillars: logs, metrics and traces. Most modern Observability platforms, such as New Relic, DataDog, StackDriver and Dynatrace offer all three. At Picnic our observability stack looks like this:

The slightly off-putting thing about it all is that ironically there is no metric for observability. Unlike a code coverage metric, which is a controversial measure in and of its own, there is no way to statically analyse how observable your code is. The best metric we have is based on empirical evidence. Measuring how well your application can externalise its state is only half of the metric. Given all three pillars at your disposal, can you solve issues quickly from these insights?
Black Box Services
We all know what a black box is. It’s an algorithm, circuit board, function, equation or application where you put data in, magic things happen and sensible results come out. And above all else, you are unable to explain how it came to that conclusion. Great, as long as it keeps providing sensible results then what is there to worry about? For example, the majority of car owners treat their automobile like a black box. All they have to do is: put fuel/electrons/hydrogen in, press on the accelerator and the engine does the rest of the magic. The result is getting from A to B. They are happy to be blissfully ignorant of what goes on under the hood just a meter in front of them. That is until they are sat on the embankment of a motorway looking down at their stationary steaming chariot, scratching their heads, awaiting the arrival of the recovery service.

As software developers we shouldn’t treat our applications in the same way. Sure, we probably implemented part of this proverbial engine, so we can probably reason about problems fairly well. But the actual internal state of an application can only be inferred if we can gather real insights from its outputs and externalised state. That is where we need to increase observability.
Our Observability Tools
Ok, so we are software engineers, we solve this using technology and the tooling which we have at our disposal. Our stack is complex, and there are therefore many degrees of abstraction into which we can focus our observability lens. Of the thee pillars of observability where can we find the lowest hanging fruit to increase insights? Let’s start with our Java Virtual Machine metrics. Our backend stack is implemented predominantly in Java, but there are ever more projects utilising Python. For Java purposes we have JVM metrics:

That is any metric about the Java Virtual Machine, exposed over JMX or recordable via Java Flight Recorder. These are great for gaining insight into the internal workings of application code and how it utilises the resources given to it. Shining this light onto our application we start to uncover a segment of the picture:

At a level of abstraction higher we have APM (Application Performance Monitoring) metrics, which give us further information about the edges of applications, be it service levels or response times. Our APM vendor provides us with an agent which instruments our application.

We now have a silhouette image of our service.

At one level higher we have service maps, which offer a command tower like overview of your application infrastructure:

It gives your insights into the health of your entire landscape and can be very useful in identifying bottlenecks or components in an alerting state. It is like observing a solar system of eclipsing planets.

There is one thing lacking with all of these resources, and that is domain specific metrics.
The Observability Gap
At Picnic we had a problem, and it’s not a novel one. Our analytical data warehouse is a great resource for our analysts and business users at Picnic to gain insights into application events and entities. It being a data warehouse, it is built periodically due to the strong relational property of our domain data. The Data Engineering team is working hard on increasing the rate at which this is built, to give analysts up to date views of supply chain operations and customer interactions throughout the day. As a developer, it isn’t feasible to rely on this resource as a means of alerting and real time analytics, even if the view is updated every 15 minutes.
We needed a consistent real time source of application domain metrics.
There are a number of solutions and architectures which fulfil this need for real time application events. There is event sourcing, where all actions interactions are event based, such that as a side effect you can pipe the same events into your monitoring solution and achieve real time application analytics. But this requires a rethink of application and data base architecture. So if your organisation, like Picnic, is not already invested in event sourcing then this is not a modest investment.
There is also the route of creating your own in house dashboard platform that pulls from production data sources and listens to application events. This is however also quite an investment as this route comes with a high development and maintainability cost. Especially when compared with what great free-to-use charting frontend systems like Grafana are capable of.
The other route is logging. After all, hand written logs tell us domain specific information about the internals of our applications. Logs are extremely useful for tracking the occurrence of an event in free text, and at Picnic we produce around one billion of them a day. What a great resource for increasing observability, right?
Logs are disorganised metrics. They change over time, they aren’t consistently tagged and they don’t have unique identifiers, meaning that contracts between logs and frontend dashboards and alerts are weak.
They are a great means of enriching a trace through your application with domain information. But aggregation of these logs into metrics by means of a chart or alert should be naturally proceeded by means of standardised measurement. All aggregated logs should evolve into formalised metrics.
It was clear to us that we needed a means of formalising these service domain metrics. The option which we chose was instrumentation, and our tool was Micrometer. As the co-founder of Fastly, Sam Wistow puts it:
The best way to guarantee observability is to build it into your code as you write it.
It is a mental switch, and a matter of changing the “definition of done” once again. As the guys at Splunk put it in their Beginners Guide to Observability:
Your code isn’t “done” until you’ve built analytics to support it.
Enough high level talk. How do we make this happen in Picnic? Check back into the Picnic Engineering Blog next week for the next instalment where we dive into Micrometer.
Recommend
About Joyk
Aggregate valuable and interesting links.
Joyk means Joy of geeK