

Introducing Glot the plotting library for Golang – Arafat Khan – Medium
source link: https://medium.com/@Arafat./introducing-glot-the-plotting-library-for-golang-3133399948a1
Go to the source link to view the article. You can view the picture content, updated content and better typesetting reading experience. If the link is broken, please click the button below to view the snapshot at that time.
Introducing Glot the plotting library for Golang
Go is an open source programming language that makes it easy to build simple, reliable, and efficient software. It provides an expressive syntax with its lightweight type system and comes with concurrency as a built-in feature at the language level. With all these features its not a surprise that Golang is really hot these days and tons of developers are shifting towards it.
While playing with Golang Packages. I was surprised to find out that it needs a simple plotting library for scientific computation purposes and so I decided to hack it together with Gnuplot and built a rather simple yet powerful plotting library that can easily be used by any average Joe.
Let’s start with something simple shall we?
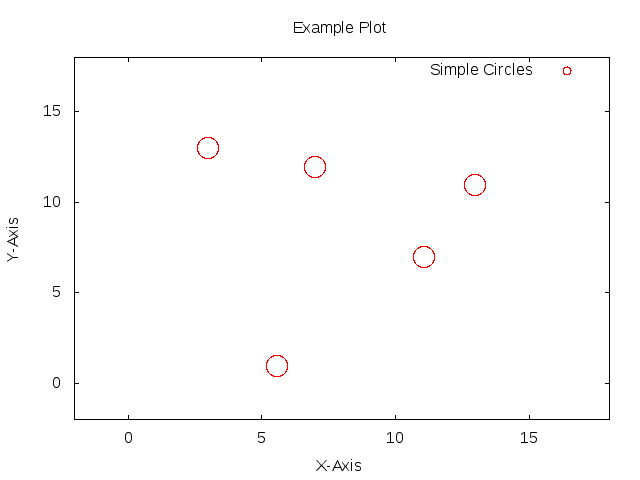
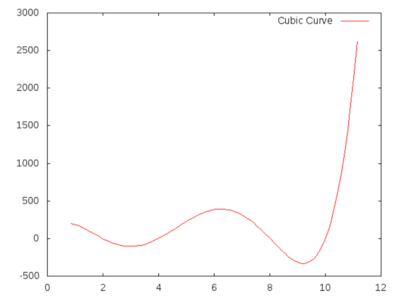
Let’s look at a simple A 2-d plot that draws over a plane to mark points.
The commented code above is self-explanatory and plain. Notice how, the many customisation options available make it easier to work with your plots.
That’s just an intro. The real takeaway is that the plot type is very dynamic and supports easy adding and removing of different types of point groups to the same plot. So now I am gonna add a simple line curve to this plot.
Just by adding 4 lines to the previous code, I have added another line curve in this plot.
pointGroupName = “Simple Lines”
style = “lines”
points = [][]float64{{7, 3, 3, 5.6, 5.6, 7, 7, 9, 13, 13, 9, 9}, {10, 10, 4, 4, 5.4, 5.4, 4, 4, 4, 10, 10, 4}} plot.AddPointGroup(pointGroupName, style, points)
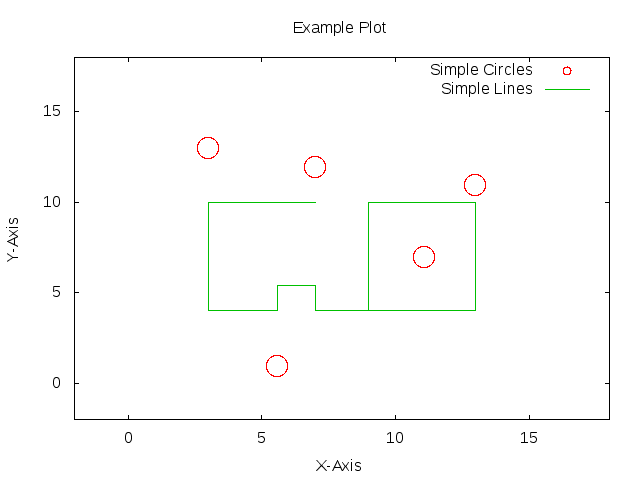
The Plot generated by the modified code
See what I did there ^^.
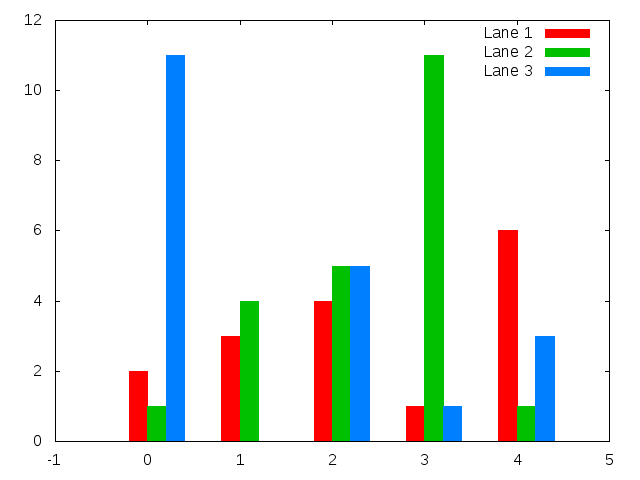
You can also easily remove curves too and save different variants of the same plot with different styles. Currently Glot supports many styles like lines, points, linepoints, impulses, dots, bar, steps, histogram, circle, errorbars, boxerrorbars and I plan on adding more.
Is that all?
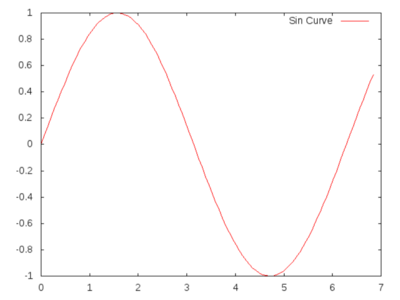
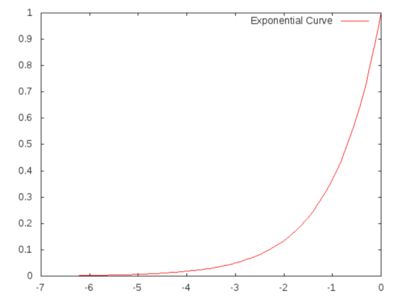
No Way… The package supports all of 1,2 and 3 dimensional curves. And even supports functions of the form
Y = Function(X) or Z = Function(X,Y)
Lets take a look
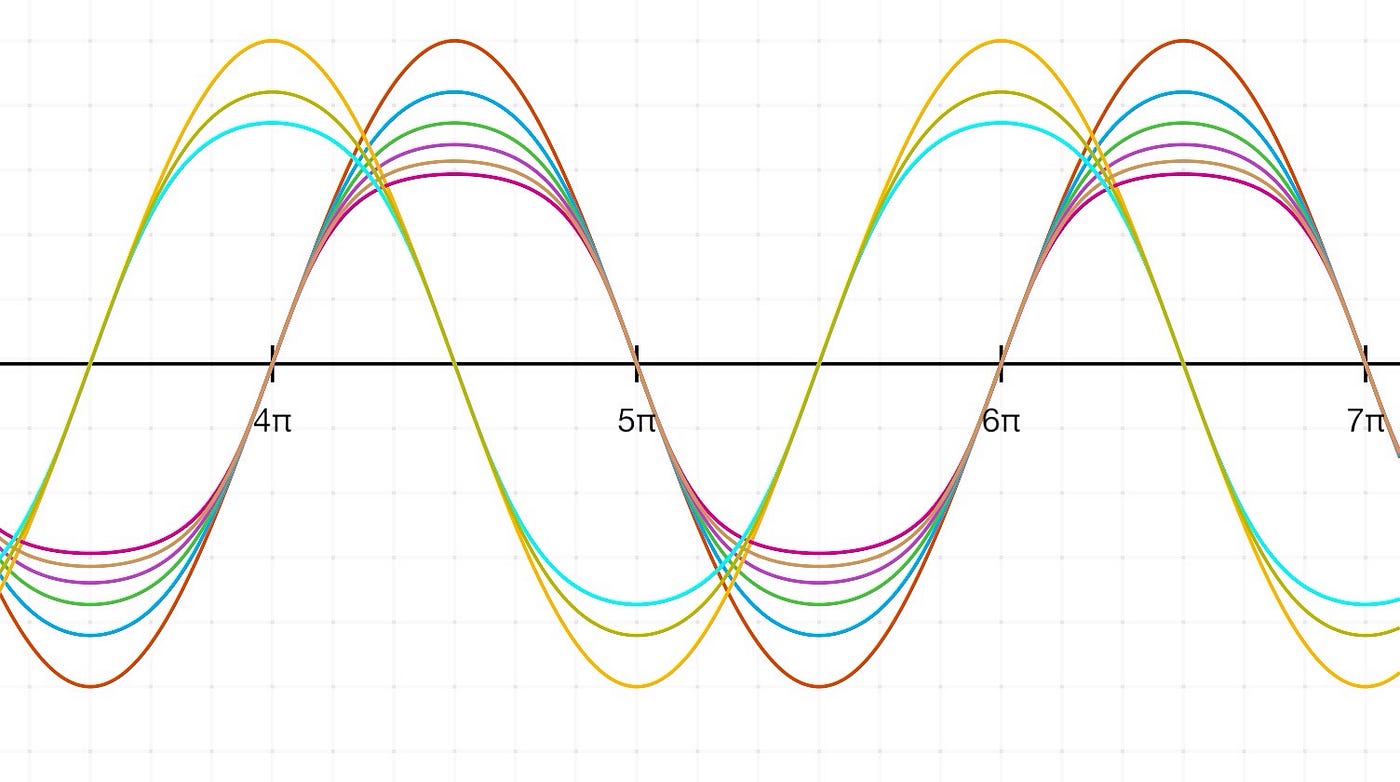
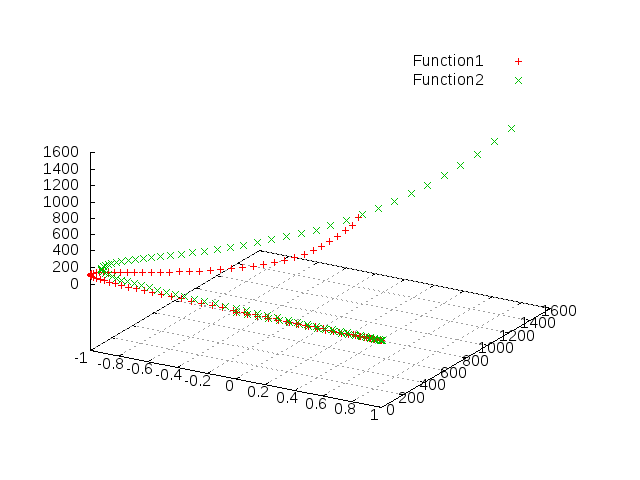
Glot also supports 3-d plots
Acknowledgements
Thanks to my friends who helped with the drafts. I am especially thankful to Sebastian Binet for his contribution to Go plotting libraries and other gonum libraries.
Feature requests
My ultimate goal is to make Glot similar to a matplotlib equivalent for Golang with tons of really amazing customisation features. I hope you find this interesting and useful. Feel free to try glot from github. Any suggestions and recommendations are welcome.
Have a great day!!!
Recommend
About Joyk
Aggregate valuable and interesting links.
Joyk means Joy of geeK