

Using VS Code to Debug Java Applications
source link: https://code.visualstudio.com/blogs/2017/09/28/java-debug
Go to the source link to view the article. You can view the picture content, updated content and better typesetting reading experience. If the link is broken, please click the button below to view the snapshot at that time.
Using VS Code to Debug Java Applications
September 28, 2017 Xiaokai He
For Java developers on Visual Studio Code, the Language Support for Java(TM) by Red Hat extension has been great for providing language features such as IntelliSense and project support. At the same time, we've also heard feedback that users would also like Java debugging. Today, we're excited to announce our ongoing collaboration with Red Hat and enabling Java developers to debug Java applications with a new lightweight Java Debugger for Visual Studio Code based on Java Debug Server.
Note: Both the Java Debugger for Visual Studio Code and Java Debug Server will be open sourced shortly after the initial release.
To help Java developers to get started with VS Code quickly, we also created a Java Extension Pack which includes both the Language Support for Java(TM) by Red Hat and Java Debugger for Visual Studio Code extensions so you won't need to search for them individually. This is just the start to creating a modern workflow for Java and we'll be adding more features and extensions to the Java Extension Pack in the future.

Getting started#
To get started:
- In Visual Studio Code, open the Extensions view (Ctrl+Shift+X).
- Type "java" to filter the list.
- Find and install the Java Extension Pack or standalone Java Debugger for Visual Studio Code extension if you already have Language Support for Java(TM) by Red Hat installed.
You also install the Java Extension Pack directly from this blog post:
Install the Java Extension Pack
After reloading VS Code, open a folder that contains a Java project and follow below steps:
- Prepare the project. Open a
.javafile, and the Java extensions will be activated. Maven, Gradle and Eclipse projects are supported. Project build is automatically handled by the extensions, no need to be triggered manually. - Start debugging. Switch to Run view (Ctrl+Shift+D) and open
launch.jsonto add a debug configuration for Java. - Fill in the
mainClassforLaunchsetting orhostNameandportforAttach. - Set your breakpoint and hit
F5to start debugging.
Supported features#
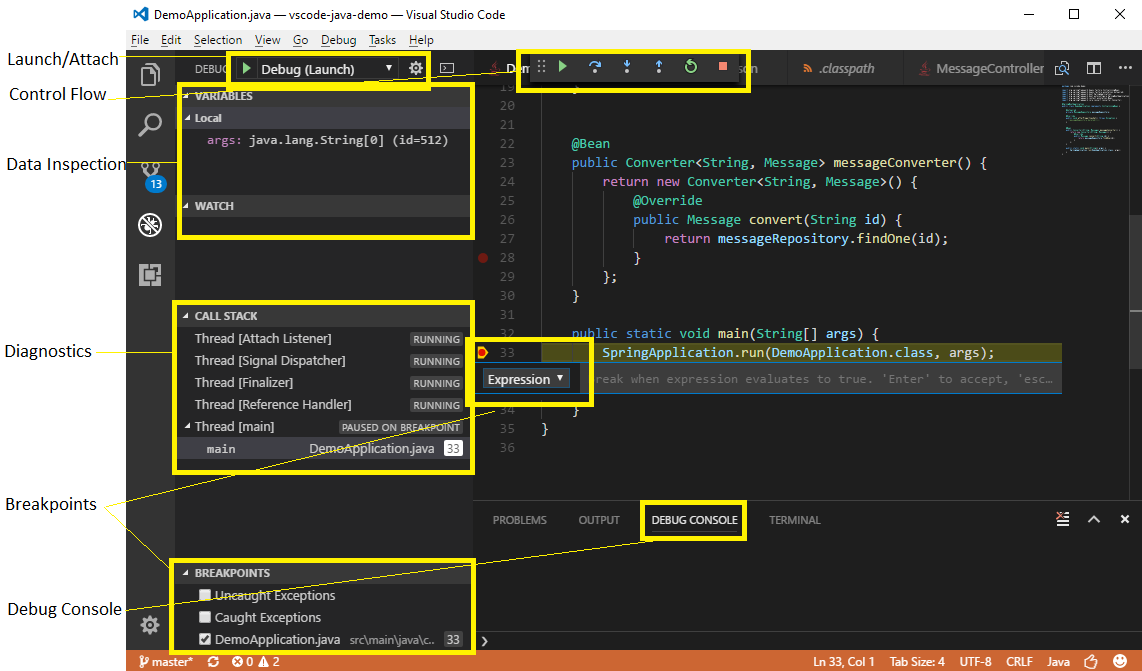
In this release, we support the following features:
- Launch/Attach - You can either launch the Java project within VS Code or attach to any running JVM process in debug mode, locally or remotely.
- Breakpoints - Conditional breakpoints by Hit Count is supported and can easily be set using the inline breakpoint settings window. This allows you to conveniently add conditional breakpoints to your code, directly in the source viewer, without requiring a modal window. Break on exceptions is also supported.
- Control flow - Including Pause, Continue
F5, Step overF10, Step intoF11, Step outShift+F11 - Data inspection - When you're stopped at a breakpoint, the debugger has access to the variable names and values that are currently stored in memory. Inspect/Watch/Set Variables are supported.
- Diagnostics - The CALL STACK panel shows the call stack of your program and allows you to navigate through the call path of each captured allocation. Multi-threaded debugging is supported by parallel stacks.
- Debug Console - The Debug Console lets you see information from both stdout and stderr.
Future releases will include expression evaluation and hot code replacement.
Next Steps#
- Checkout more about Java on VS Code
Feedback#
Please share your feedback and ask questions to help us improve. You can contact us on Gitter.
Xiaokai He, @JavaOnAzure
Recommend
About Joyk
Aggregate valuable and interesting links.
Joyk means Joy of geeK