

Improving the Vert.x Micrometer Metrics performance
source link: https://vertx.io/blog/micrometer-metrics-performance/
Go to the source link to view the article. You can view the picture content, updated content and better typesetting reading experience. If the link is broken, please click the button below to view the snapshot at that time.
Improving the Vert.x Micrometer Metrics performance
Vert.x 5 is coming with many great new features and enhancements.
In this article, you’ll learn about the Vert.x Micrometer Metrics performance improvements.
Introduction
With Vert.x 4, a few users reported issues regarding the impact of monitoring with Vert.x Micrometer Metrics. In practice, they observed the problem by measuring the throughput of their application. With monitoring enabled, the throughput decreased, sometimes to a significant degree.
Such problems can’t be analyzed and addressed without:
- a good reproducer, and
- a proper benchmarking environment.
Fortunately, we have both. The Vert.x team has been working for a long time on performance improvements using the TechEmpower Web Framework Benchmarks.
Curious about Vert.x and TechEmpower Framework Benchmarks?
Checkout the recording of Real world HTTP performance benchmarking, lessons learned.
Benchmarks
Description
For the analysis, we chose two benchmarks:
The plaintext benchmark consists in replying to an HTTP request with a very small, fixed-size text body.
Sample plaintext request:
GET /plaintext HTTP/1.1
Host: server
User-Agent: Mozilla/5.0 (X11; Linux x86_64) Gecko/20130501 Firefox/30.0 AppleWebKit/600.00 Chrome/30.0.0000.0 Trident/10.0 Safari/600.00
Cookie: uid=12345678901234567890; __utma=1.1234567890.1234567890.1234567890.1234567890.12; wd=2560x1600
Accept: text/html,application/xhtml+xml,application/xml;q=0.9,*/*;q=0.8
Accept-Language: en-US,en;q=0.5
Connection: keep-alive
Sample plaintext response:
HTTP/1.1 200 OK
Content-Length: 15
Content-Type: text/plain; charset=UTF-8
Server: Example
Date: Wed, 17 Apr 2013 12:00:00 GMT

Hello, World!
It is so simple that it will accentuate the impact of monitoring.
The fortunes benchmark, in contrast, involves a relational database and HTML templating.
Sample fortunes request:
GET /fortunes HTTP/1.1
Host: server
User-Agent: Mozilla/5.0 (X11; Linux x86_64) Gecko/20130501 Firefox/30.0 AppleWebKit/600.00 Chrome/30.0.0000.0 Trident/10.0 Safari/600.00
Cookie: uid=12345678901234567890; __utma=1.1234567890.1234567890.1234567890.1234567890.12; wd=2560x1600
Accept: text/html,application/xhtml+xml,application/xml;q=0.9,*/*;q=0.8
Accept-Language: en-US,en;q=0.5
Connection: keep-alive
Sample fortunes response:
HTTP/1.1 200 OK
Content-Length: 1196
Content-Type: text/html; charset=UTF-8
Server: Example
Date: Wed, 17 Apr 2013 12:00:00 GMT

<!DOCTYPE html><html><head><title>Fortunes</title></head><body><table><tr><th>id</th><th>message</th></tr><tr><td>11</td><td><script>alert("This should not be displayed in a browser alert box.");</script></td></tr><tr><td>4</td><td>A bad random number generator: 1, 1, 1, 1, 1, 4.33e+67, 1, 1, 1</td></tr><tr><td>5</td><td>A computer program does what you tell it to do, not what you want it to do.</td></tr><tr><td>2</td><td>A computer scientist is someone who fixes things that aren't broken.</td></tr><tr><td>8</td><td>A list is only as strong as its weakest link. — Donald Knuth</td></tr><tr><td>0</td><td>Additional fortune added at request time.</td></tr><tr><td>3</td><td>After enough decimal places, nobody gives a damn.</td></tr><tr><td>7</td><td>Any program that runs right is obsolete.</td></tr><tr><td>10</td><td>Computers make very fast, very accurate mistakes.</td></tr><tr><td>6</td><td>Emacs is a nice operating system, but I prefer UNIX. — Tom Christaensen</td></tr><tr><td>9</td><td>Feature: A bug with seniority.</td></tr><tr><td>1</td><td>fortune: No such file or directory</td></tr><tr><td>12</td><td>??????????????</td></tr></table></body></html>
It’s more representative of real-world applications.
Measurements
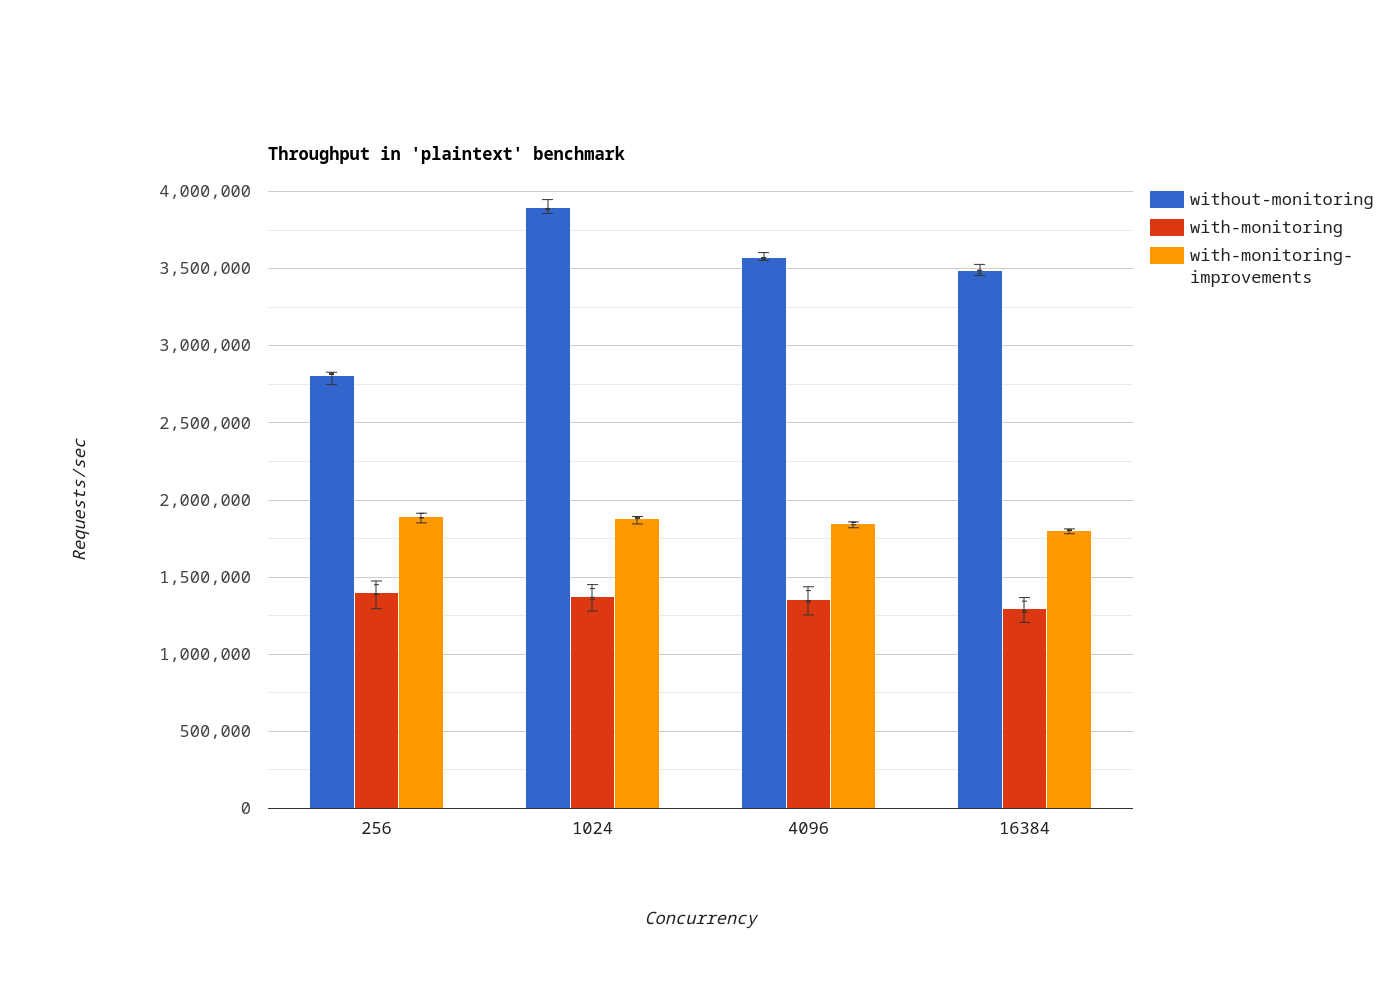
We’ve measured throughput at different concurrency levels. The blue/red bars indicate the number of requests per second when monitoring is disabled/enabled.
Plaintext
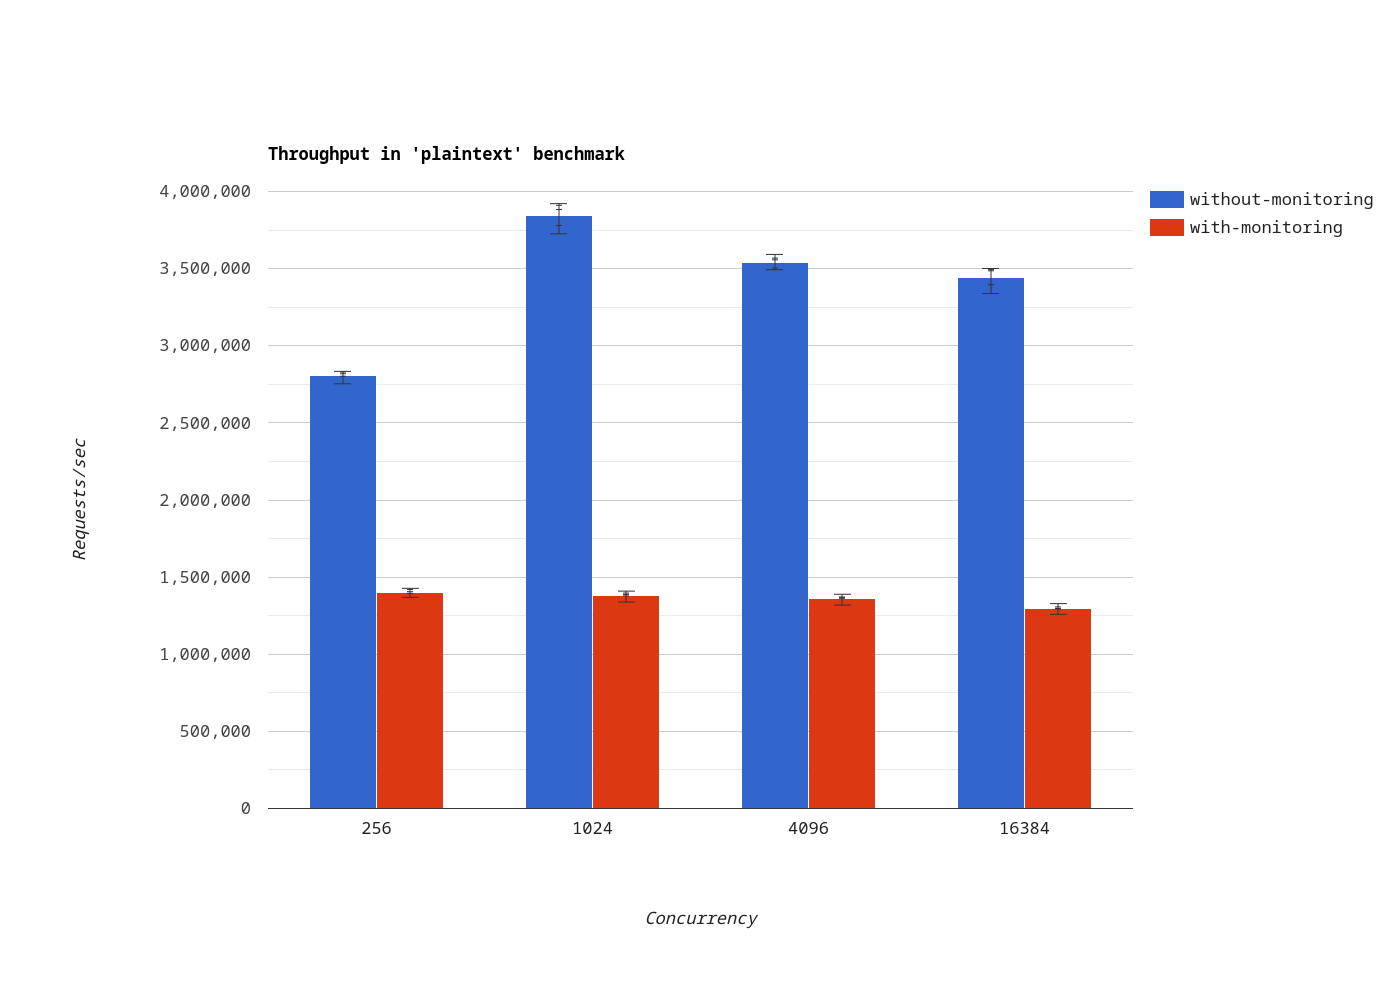
In the plaintext benchmark, monitoring has such an impact that the throughput doesn’t increase with the concurrency level. When monitoring is enabled, the throughput decreased by 59.90% on average.
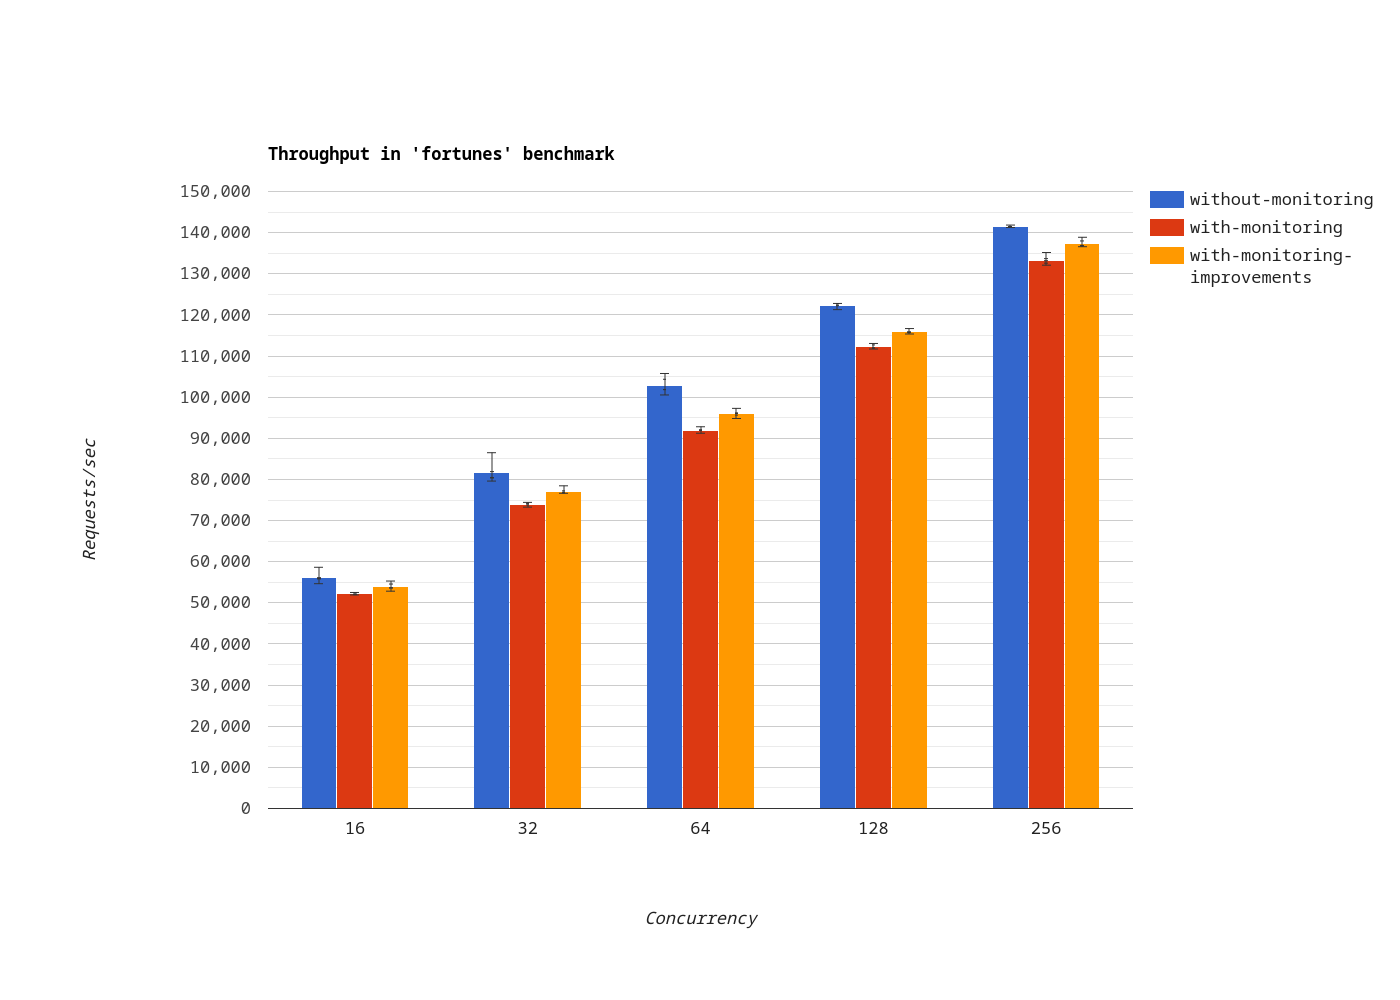
Fortunes
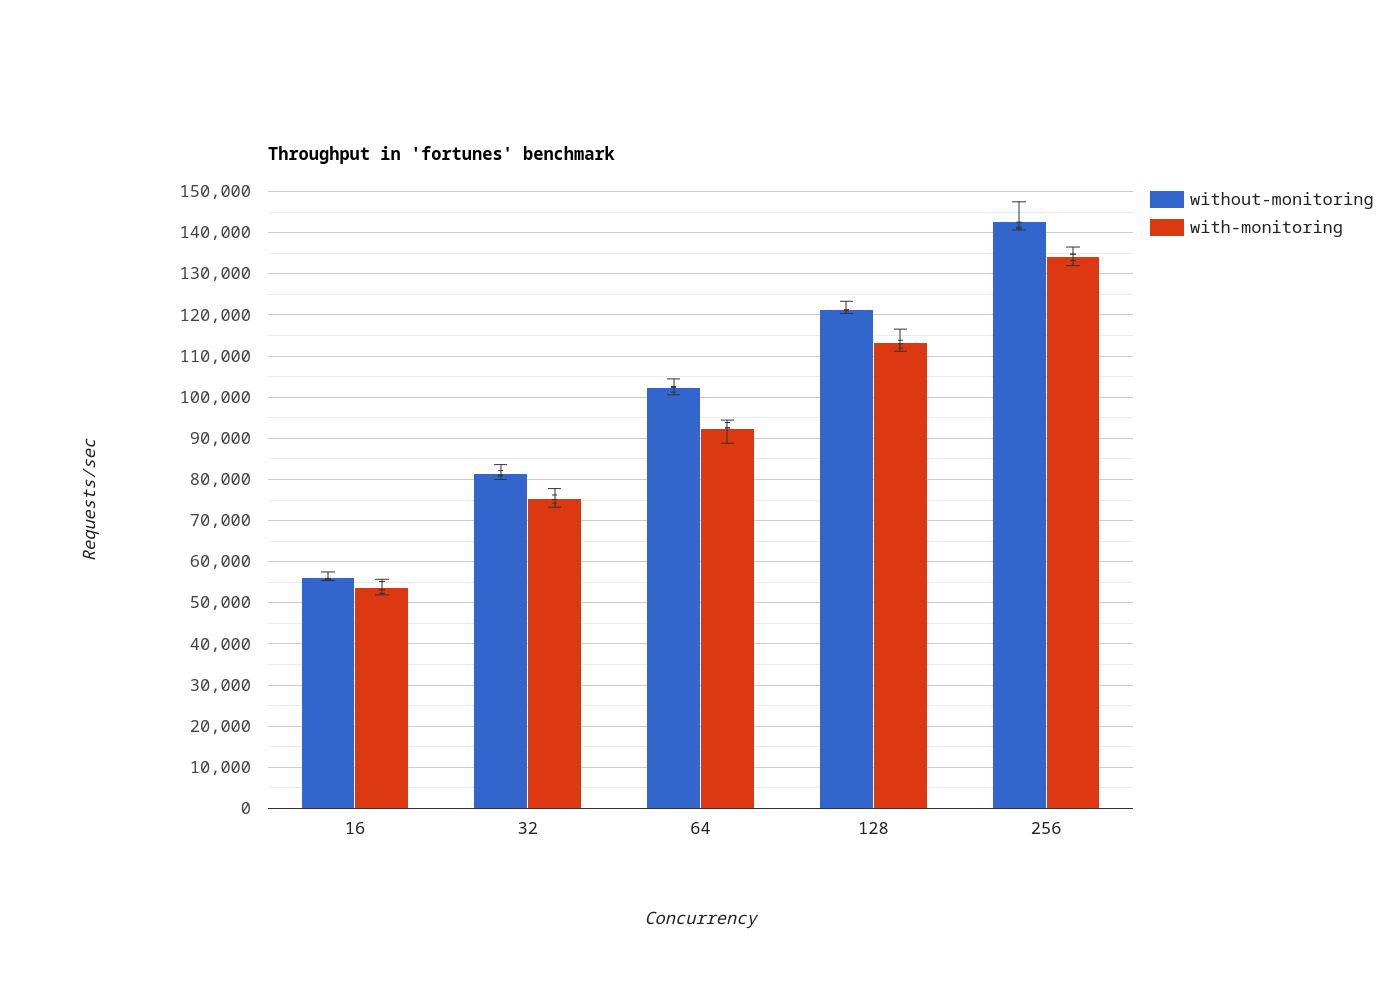
In the fortunes benchmark, which is more realistic, the throughput decreased by 8.24% on average.
Analysis
After measuring throughput, we’ve profiled the server with async-profiler in CPU mode.
In the flamegraph generated for the plaintext benchmark, methods related to monitoring with Micrometer, highlighted in fuchsia, are dominant:
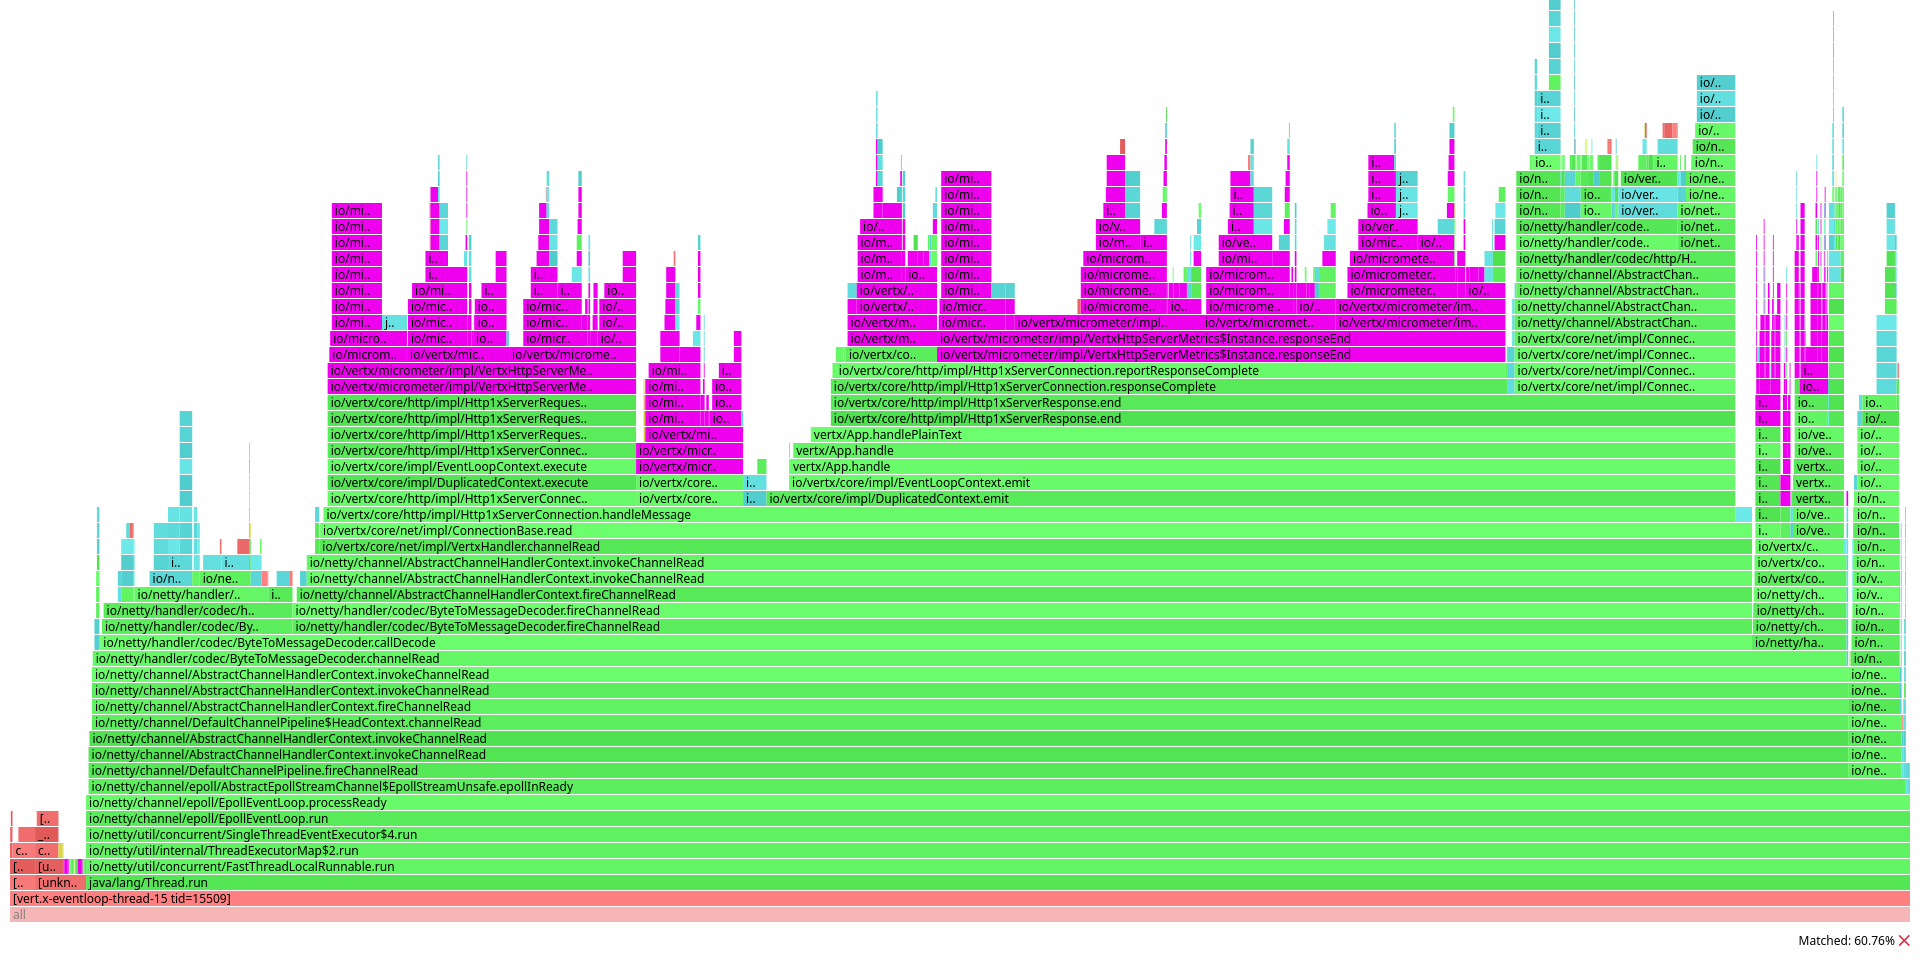
This looks consistent with the measurements described previously: if a lot of server work is dedicated to monitoring, the throughput can only decrease. But what’s the problem exactly?
Let’s focus on one method: io/vertx/core/http/impl/Http1xServerConnection.reportResponseComplete.
This method is invoked by Vert.x when the user has finished sending an HTTP response to the client.
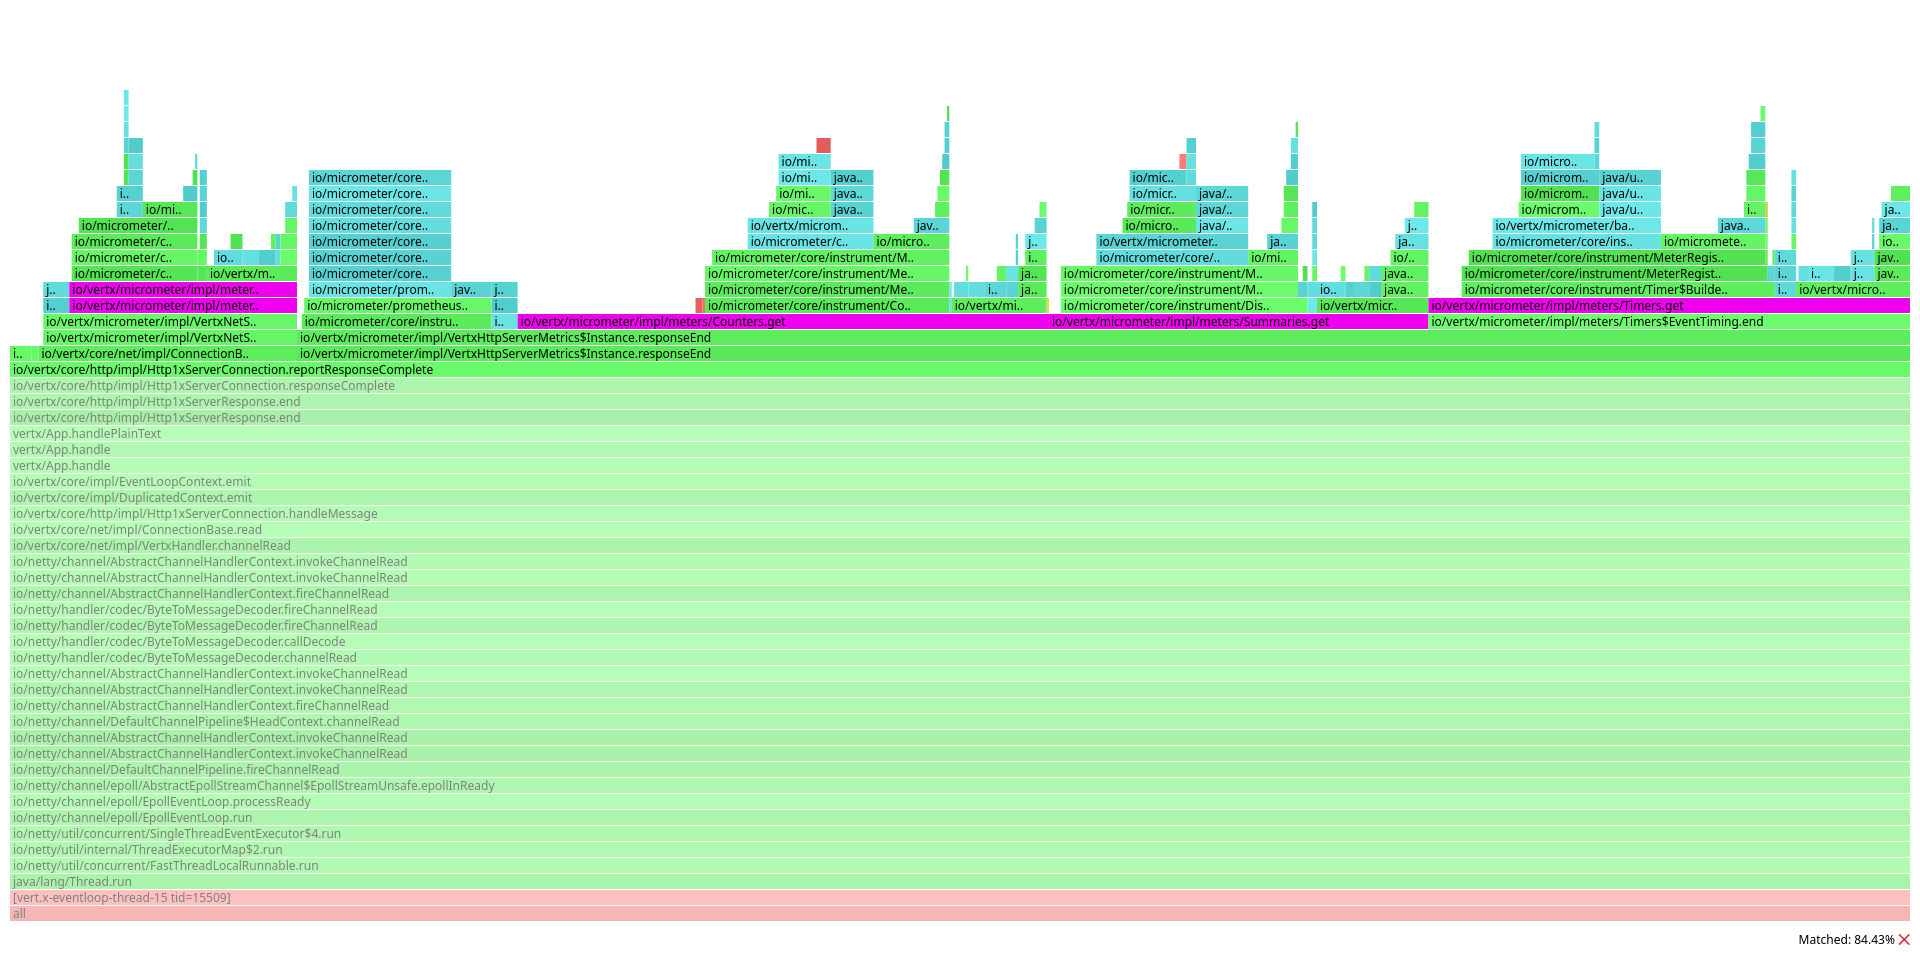
A great portion of the graph is occupied by calls to the following methods:
io.vertx.micrometer.impl.meters.Counters#get(java.lang.Iterable<io.micrometer.core.instrument.Tag>, java.lang.String...)io.vertx.micrometer.impl.meters.Summaries#get(java.lang.Iterable<io.micrometer.core.instrument.Tag>, java.lang.String...)io.vertx.micrometer.impl.meters.Timers#get(java.lang.Iterable<io.micrometer.core.instrument.Tag>, java.lang.String...)
In Vert.x 4, these methods are used to dynamically retrieve a Micrometer Counter, DistributionSummary or Timer.
By dynamically, we mean Vert.x Micrometer Metrics looks up an entry in Micrometer’s MeterRegistry before reporting the measurement.
And it does so for each and every monitored event, not just the end of an HTTP response: bytes sent over a socket, event bus message received, connection closed, the list goes on.
What about the costs of each lookup? Let’s consider the case of counters.
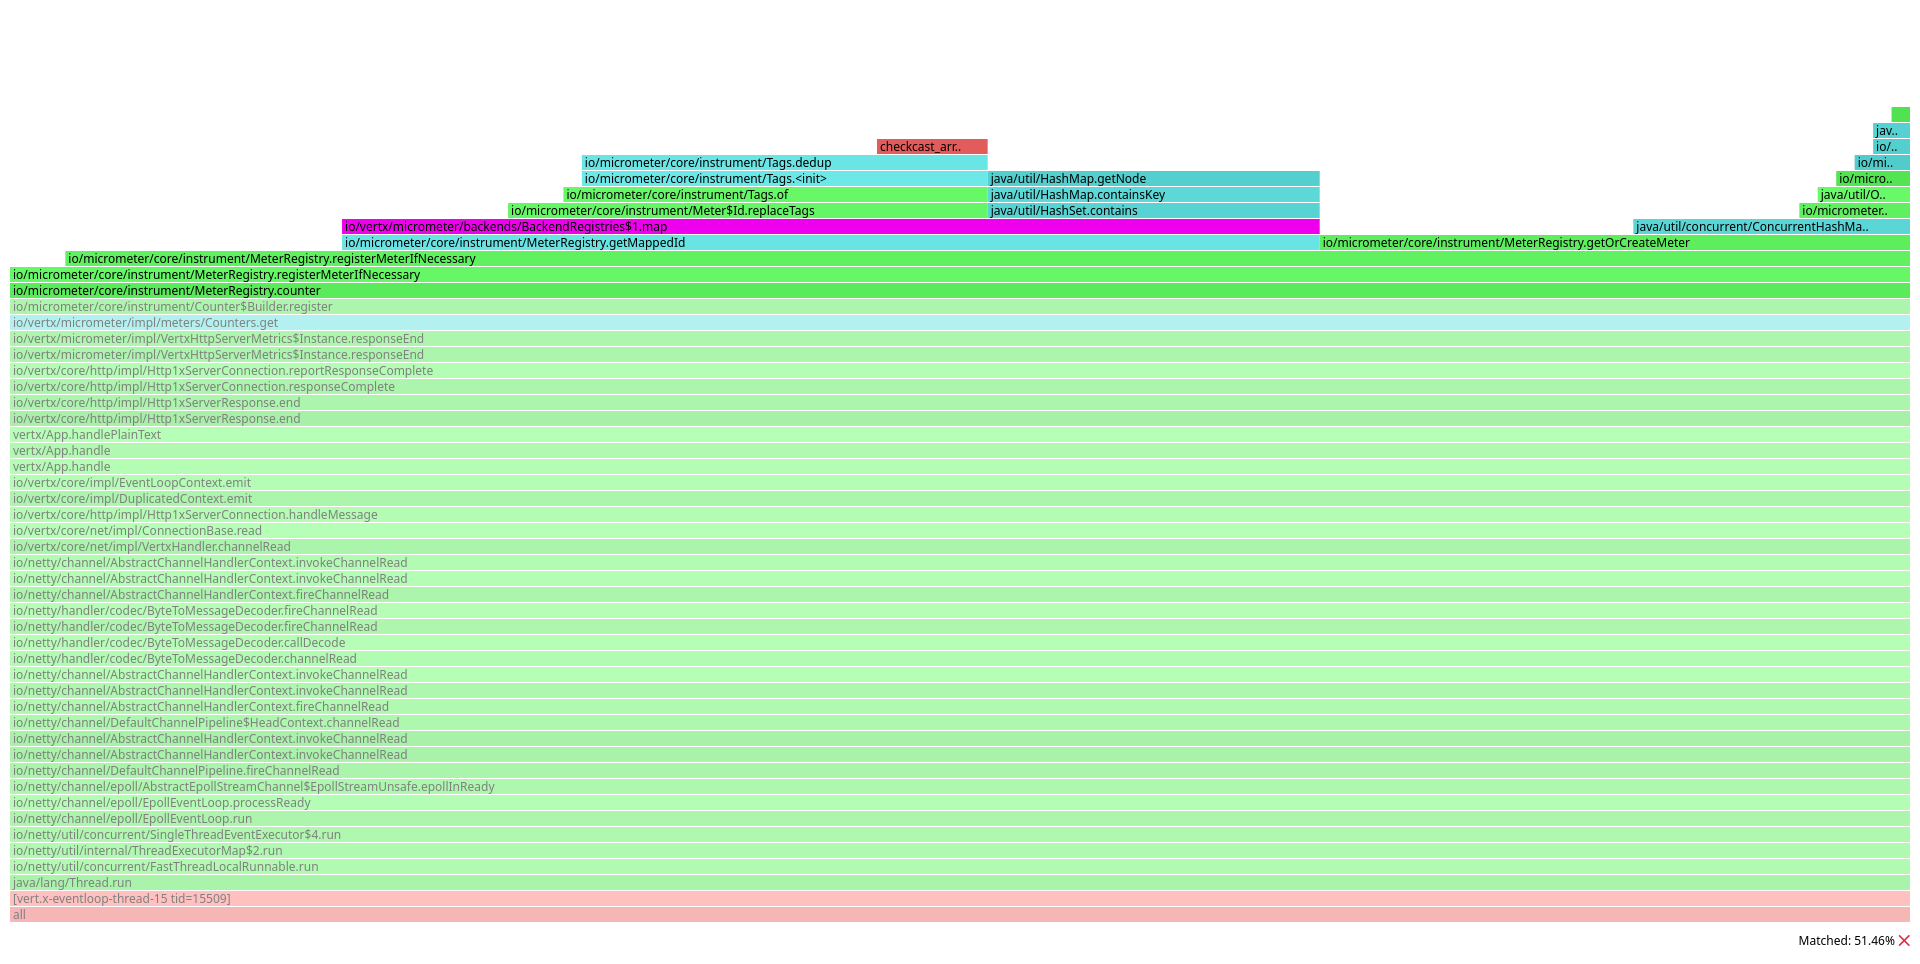
In this case, the graph is dominated by io/micrometer/core/instrument/MeterRegistry#getMappedId.
This method is invoked by the Micrometer registry to compute the effective identifier of a meter, applying all the registered MeterFilters.
In Vert.x 4, only one filter is registered by default. It removes a set of ignored tags (defined in metrics options):
  private static MeterFilter ignoreTags(Set<String> ignored) {
    return new MeterFilter() {
      @Override
      public Meter.Id map(Meter.Id id) {
        List<Tag> tags = new ArrayList<>();
        int count = 0;
        for (Tag tag : id.getTagsAsIterable()) {
          if (!ignored.contains(tag.getKey())) {
            tags.add(tag);
          }
          count++;
        }
        return tags.size() == count ? id : id.replaceTags(tags);
      }
    };
  }
As you can see, the filter iterates the original set of tags and looks up for the tag key in the ignored set.
Improvements - step 1
We’ve made several improvements in Vert.x 5 to reduce the cost of monitoring with Vert.x Micrometer Metrics.
Avoid meters lookup (where possible)
Where possible, we should avoid looking up for meters dynamically.
There are metrics which tags are known from application startup. For example, in pool metrics, the pool type and pool name are defined when the pool is created. Consequently, the meters can be looked up once and reused later.
Filter-out tags upfront instead of using a filter
Instead of belatedly removing ignored tags with a filter, we should avoid adding them to the meter definition in the first place.
Doing so provides a couple of benefits.
Firstly, since Vert.x tags are defined in the Java enum io.vertx.micrometer.Label, we can verify if a specific tag is ignored by checking its presence in a java.util.EnumSet.
This is more efficient than using the string representation of tag keys and a java.util.HashSet.
Secondly, the server won’t have to create redundant io.micrometer.core.instrument.Tags instances.
io.micrometer.core.instrument.Tags objects are immutable.
When methods like io.micrometer.core.instrument.Tags#and(java.lang.String, java.lang.String) or io.micrometer.core.instrument.Tags#and(io.micrometer.core.instrument.Tag...) are called, a new instance that combines the tags is returned.
Every invocation implies:
- copying previous and new tags in a new array,
- sorting this array,
- removing duplicates.
Results
In the Vert.x Micrometer Metrics PR#200, we’ve applied the following changes:
- Avoid meters lookup where possible d9906a9eb75b9e339f899a4e5571395c7bc0c638
- Filter tags up front instead of using a Micrometer meter filter d513c690953bcd548bb0614dfa75b03217d94587
- Do not compute metric name on the hot path d49d1775d5b175e892cffc1f2ee222d424255798
- Avoid redundant copies when combining tags 839f750d92076c8d3d40aadfda91e9db7edbad18
And then we made new measurements.
Plaintext
In the plaintext benchmark, when monitoring is enabled, throughput improved by 36% on average.
We shouldn’t pay too much attention to this number. Remember, the plaintext benchmark is an extremely simplified HTTP interaction, thus not representative of most applications. Nevertheless, it tells us we’re going in the right direction.
Fortunes
In the fortunes benchmark, when monitoring is enabled, throughput improved by 3.67% on average. In other words, with these improvements, the impact of monitoring on throughput is down from 8.24% to 4.88% on average.
That’s nice, but not yet satisfactory.
Improvements - step 2
We profiled the server once more, and in the resulting flamegraph, focused on the io/vertx/core/http/impl/Http1xServerConnection.reportResponseComplete method.
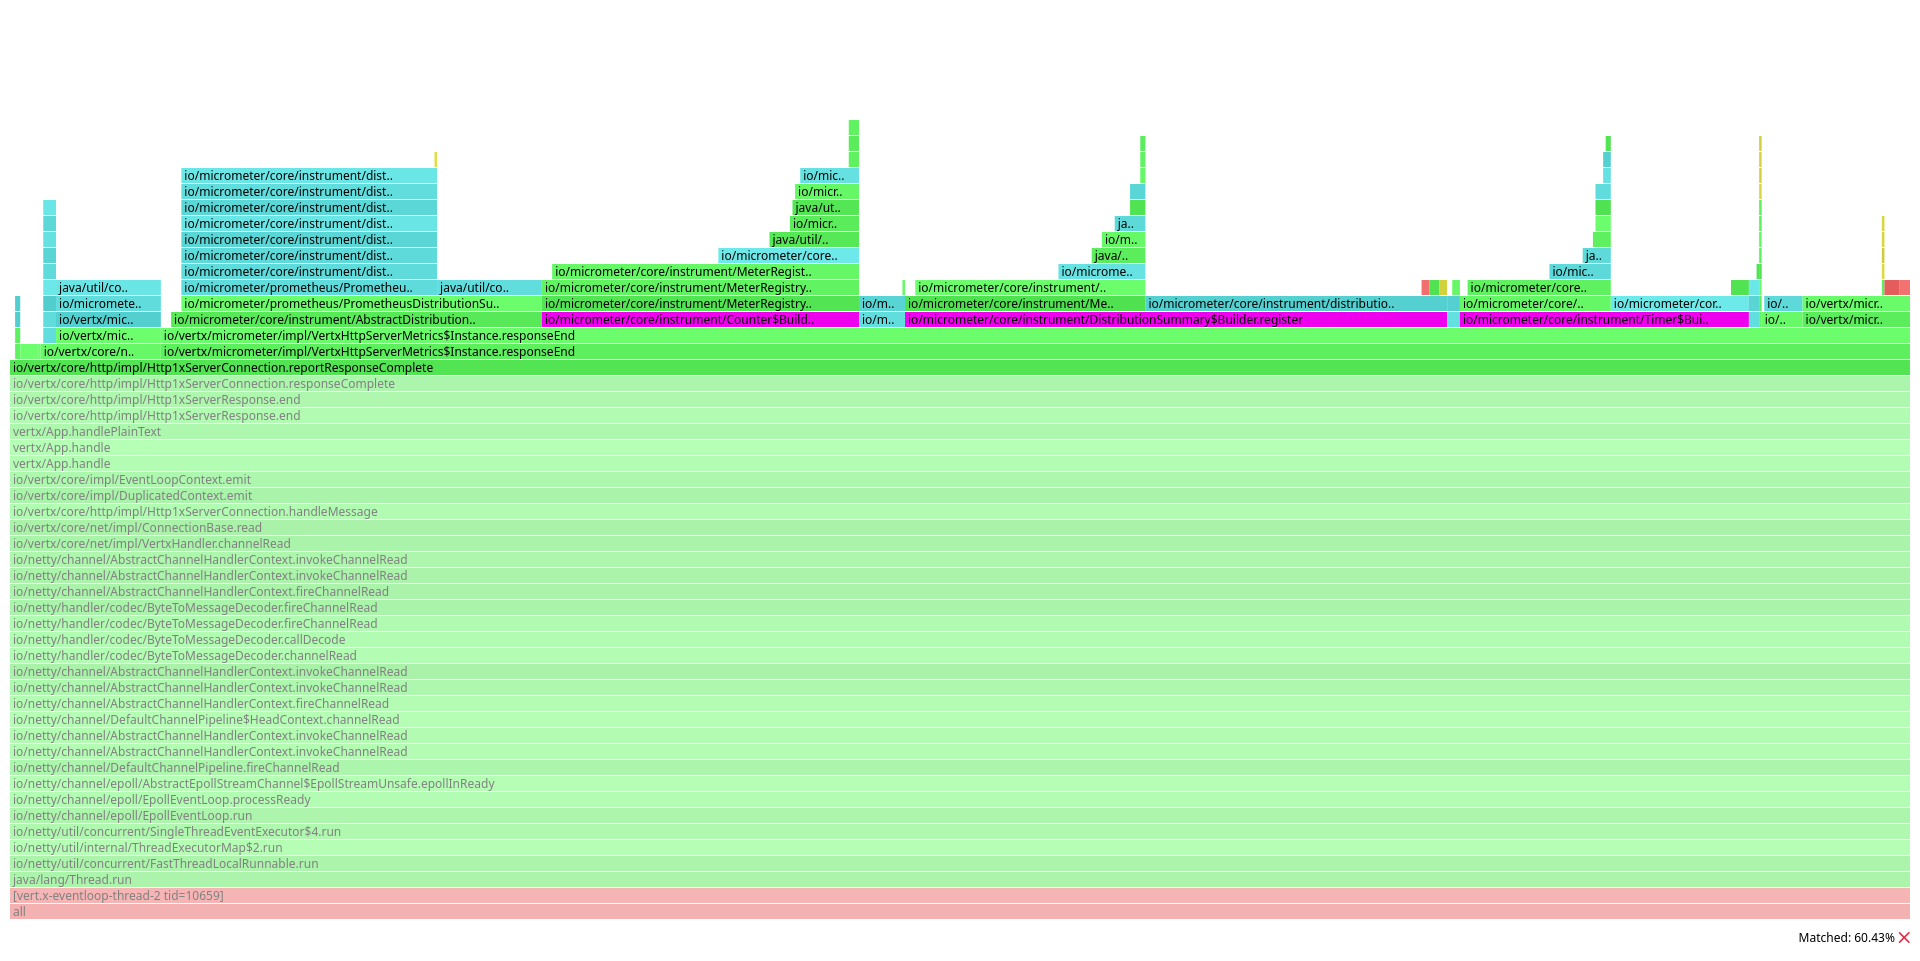
This time, we can see a great portion of the graph is occupied by these methods:
io/micrometer/core/instrument/Counter$Builder.registerio/micrometer/core/instrument/DistributionSummary$Builder.registerio/micrometer/core/instrument/Timer$Builder.register
Indeed, we still have to look up some meters dynamically, because some tag values such as the HTTP response are not known in advance:
    @Override
    public void responseEnd(RequestMetric requestMetric, HttpResponse response, long bytesWritten) {
      Tags responseTags = requestMetric.tags.and(Labels.toTags(HTTP_ROUTE, requestMetric.getRoute(), HTTP_CODE, String.valueOf(response.statusCode())));
      counter(names.getHttpRequestsCount())
        .description("Number of processed requests")
        .tags(responseTags)
        .register(registry)
        .increment();
      requestMetric.sample.stop(timer(names.getHttpResponseTime())
        .description("Request processing time")
        .tags(responseTags)
        .register(registry));
      distributionSummary(names.getHttpResponseBytes())
        .description("Size of responses in bytes")
        .tags(responseTags)
        .register(registry)
        .record(bytesWritten);
      if (requestMetric.responseEnded()) {
        requestMetric.requests.decrement();
      }
    }
But what happens when we register a meter in the Micrometer registry?
    private <M extends Meter> M registerMeterIfNecessary(Class<M> meterClass, Meter.Id id,
            @Nullable DistributionStatisticConfig config, BiFunction<Meter.Id, DistributionStatisticConfig, M> builder,
            Function<Meter.Id, M> noopBuilder) {
        Id mappedId = getMappedId(id);
        Meter m = getOrCreateMeter(config, builder, id, mappedId, noopBuilder);

        if (!meterClass.isInstance(m)) {
            throw new IllegalArgumentException(
                    format("There is already a registered meter of a different type (%s vs. %s) with the same name: %s",
                            m.getClass().getSimpleName(), meterClass.getSimpleName(), id.getName()));
        }
        return meterClass.cast(m);
    }
Micrometer computes the mapped id (remember, filters can transform the meter id), then retrieves an existing meter from a java.util.concurrent.ConcurrentHashMap, or creates it, if it doesn’t exist.
As a result, when the application reaches a steady state, all Vert.x event loops concurrently read values from a single java.util.concurrent.ConcurrentHashMap.
Results
In the Vert.x Micrometer Metrics PR#200, we’ve applied the following additional change:
- Use a per-thread meter cache before looking up for meters in the registry dda6cbc8213fea0edfeea817718c2dd8621f88be
And then we made new measurements.
Plaintext
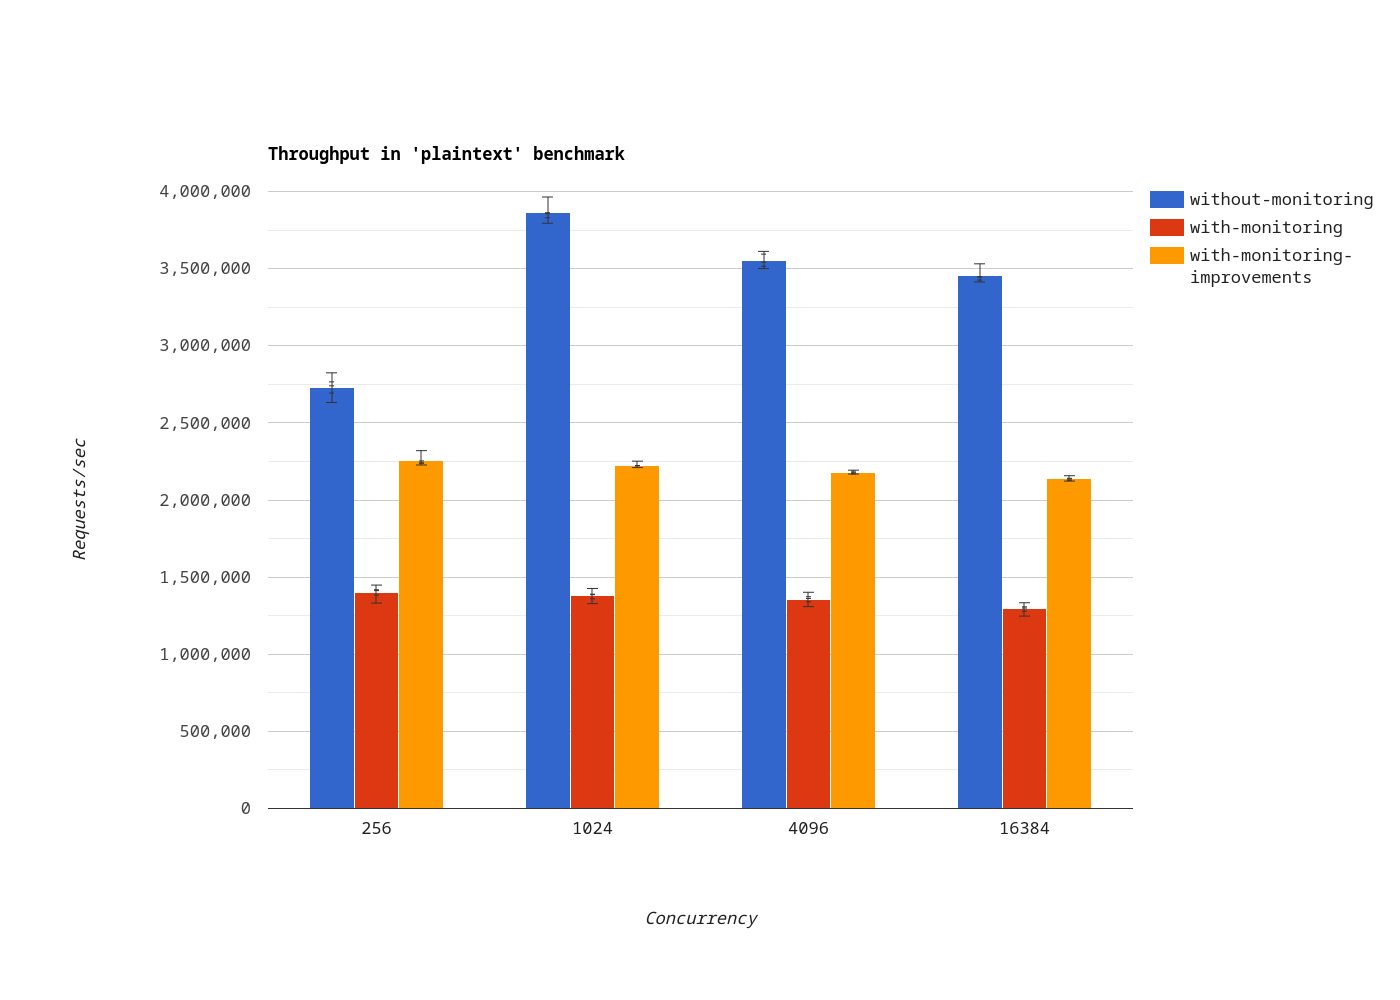
In the plaintext benchmark, when monitoring is enabled, throughput improved by 59.36% on average.
Again, the plaintext benchmark is an extreme case. But some Vert.x users run applications that reply to HTTP requests using a data set fully loaded in memory. For them, the per-thread meter cache should make a huge difference.
Fortunes
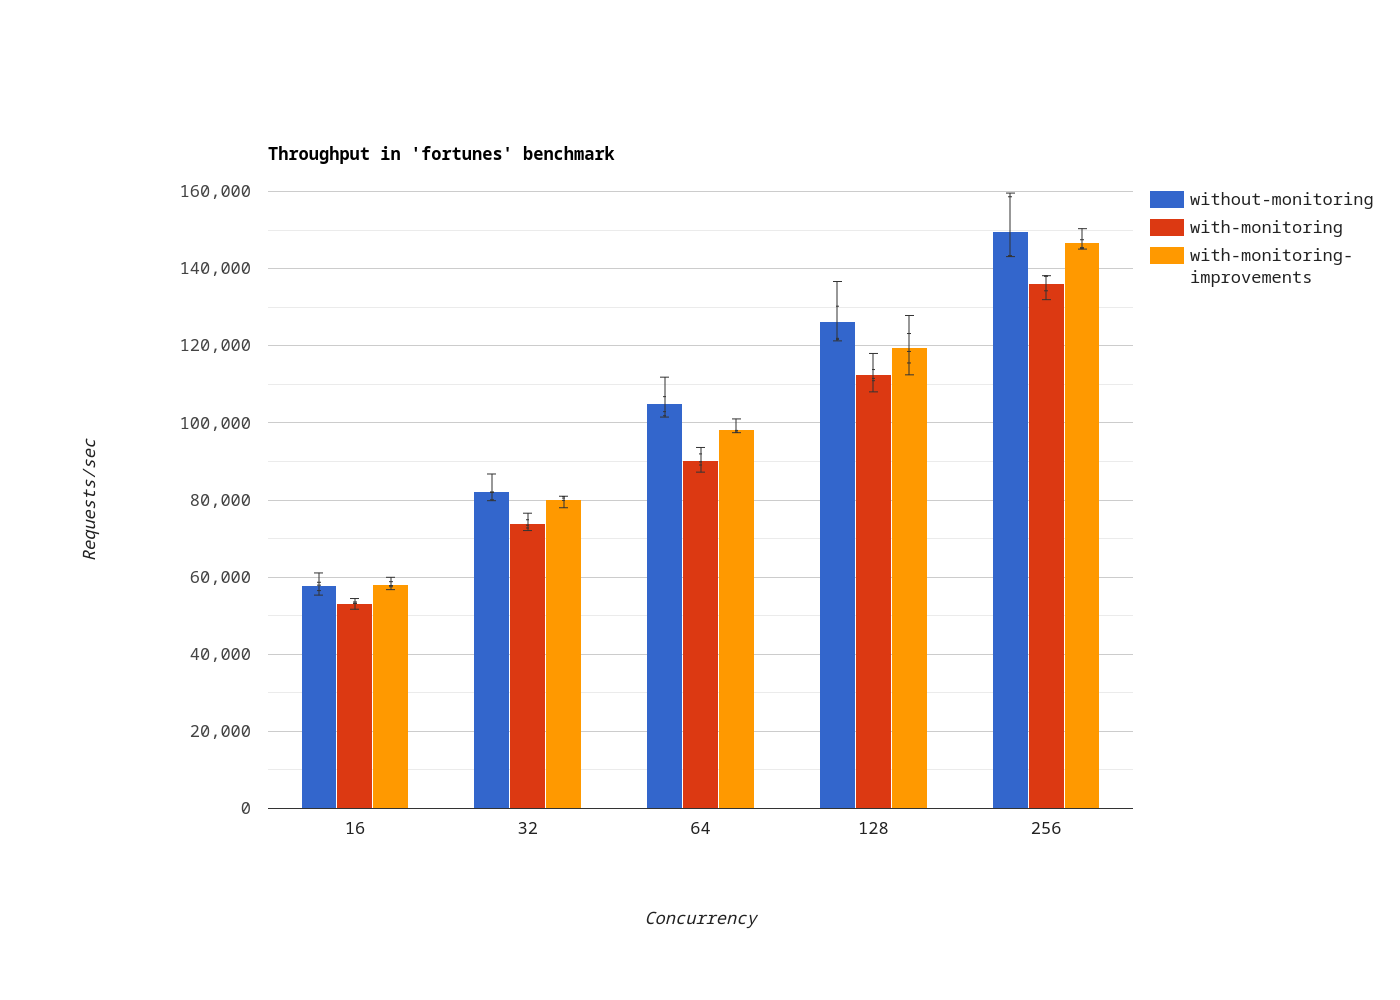
In the fortunes benchmark, when monitoring is enabled, the impact of monitoring on throughput is down from 10.4% to 4.05% on average.
Improvements - step 3
In a recent conversation with the Micrometer team, we learnt that Micrometer v1.12 introduced the MeterProvider API.
In short, meter providers allow to reduce allocations by:
- gathering all the information given to a meter builder upon creation, and
- looking up a metric after adding extra tags known after an event has occured.
For example, if you have to count HTTP responses with their status codes:
// On startup
MeterProvider<Counter> httpRequestsCount = Counter.builder(names.getHttpRequestsCount())
  .description("Number of processed requests")
  .withRegistry(registry);

// When the response ends
httpRequestsCount.withTags(responseTags).increment();
Results
In the Vert.x Micrometer Metrics PR#218, we’ve applied the following additional change:
- Remove cache and use MeterProvider for dynamic tags 5c7eca4a379c5c1445d7e7429ad6ac9fcd9b01a4
And then we made new measurements.
Plaintext
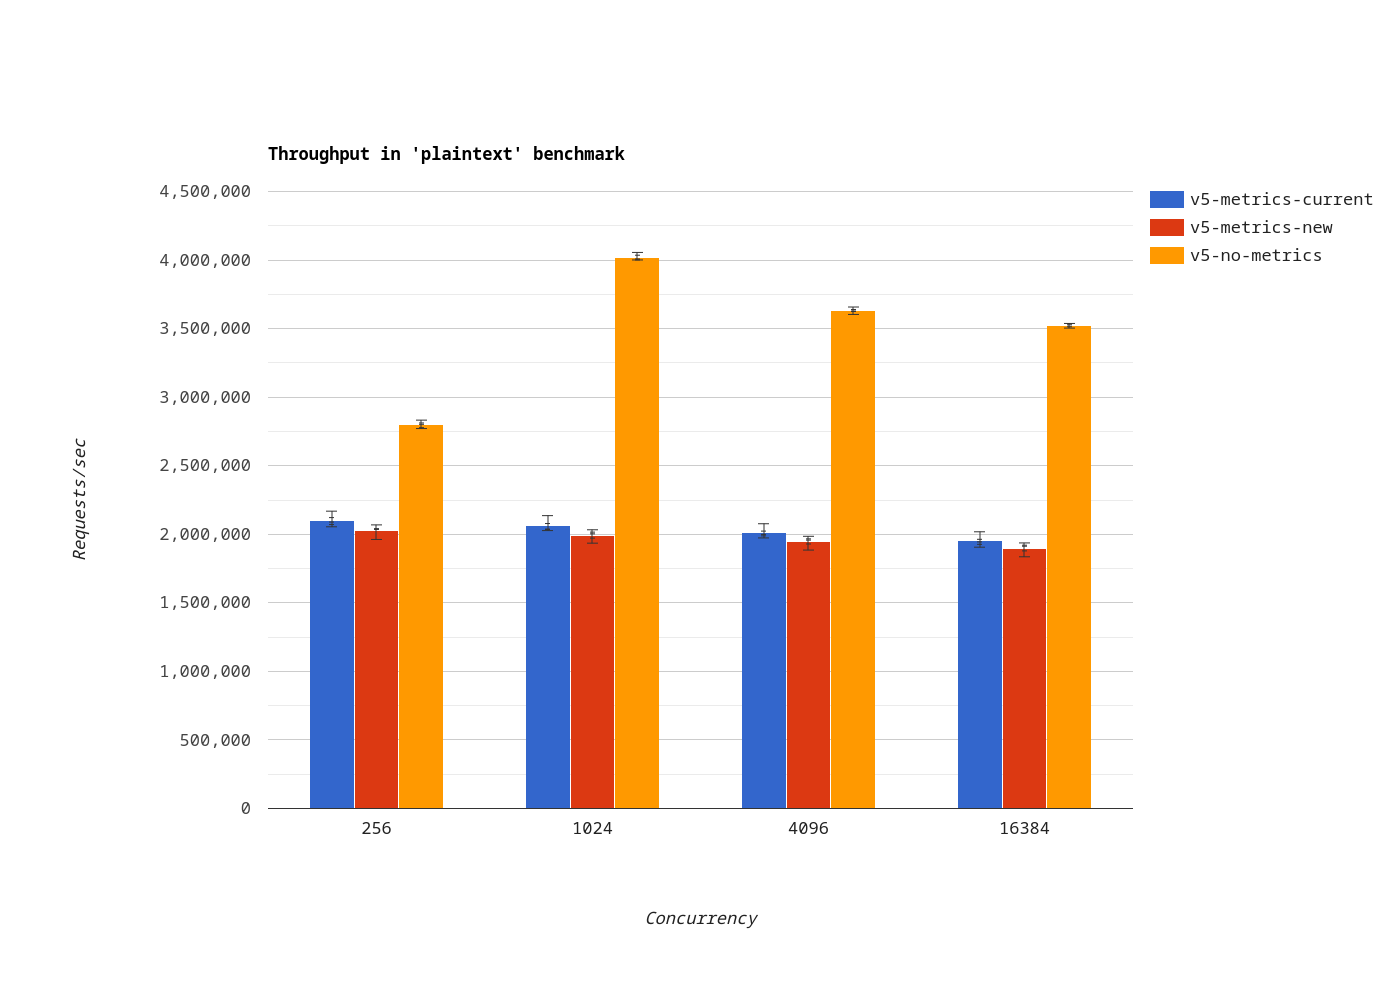
In the plaintext benchmark, the throughput using the MeterProvider implementation (red bars) is not as good as using a meter cache (blue bars).
But:
- the difference is relatively small, and
- the Vert.x Micrometer Metrics module implementation is greatly simplified.
Fortunes
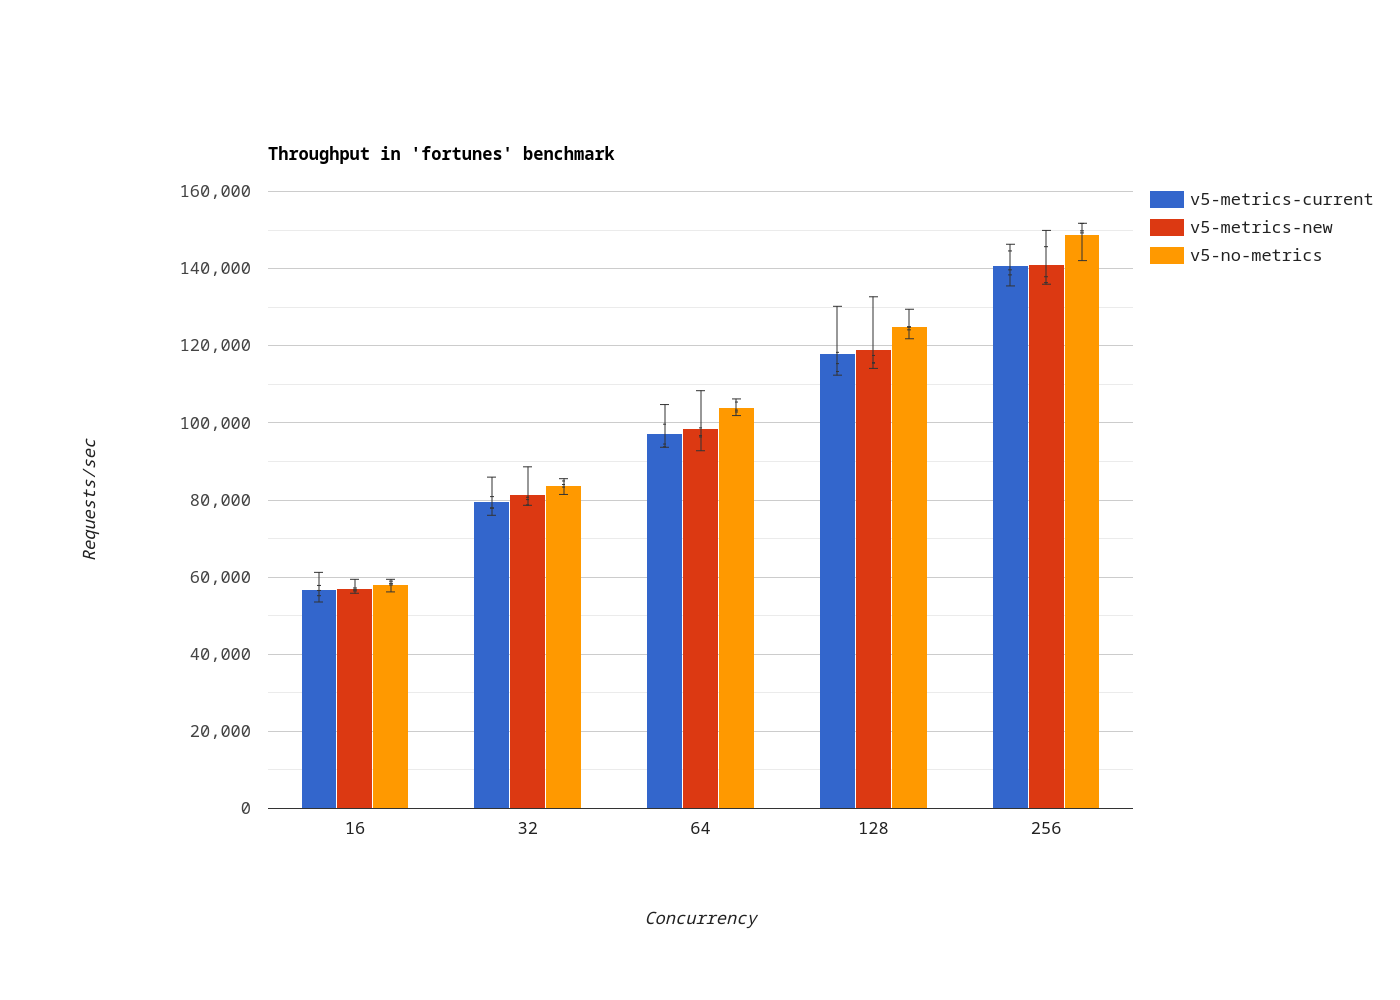
In the plaintext benchmark, the throughput using the MeterProvider implementation (red bars) is as good as using a meter cache (blue bars), or better.
Conclusion
Monitoring applications comes with a cost that is unavoidable. Usually, this cost is negligible, but there are use cases when the impact on throughput is relatively important.
With a good reproducer and a proper benchmark, we were able to gain insights into Micrometer’s design and improve the way Vert.x works with this great monitoring library.
In summary, if you integrate with Micrometer in your projects, you should consider:
- filtering tags up front instead of using a Micrometer
MeterFilter - avoiding redundant copies when combining tags
- looking up meters once if their tags are known in advance
- use a
MeterProviderwhen some tags can be determined only after an event occured.
Recommend
About Joyk
Aggregate valuable and interesting links.
Joyk means Joy of geeK