
Looking closer at enabling Endpoint analytics
source link: https://www.petervanderwoude.nl/post/looking-closer-at-enabling-endpoint-analytics/
Go to the source link to view the article. You can view the picture content, updated content and better typesetting reading experience. If the link is broken, please click the button below to view the snapshot at that time.
Looking closer at enabling Endpoint analytics
This week is all about Endpoint analytics and indirectly Advanced Analytics. More specifically, about enabling Endpoint Analytics and what happens after enabling Endpoint analytics. The process of enabling Endpoint analytics is not that special and can only be performed once per tenant. It is, however, good to be familiar with what happens after enabling Endpoint analytics. To understand the settings that become available and the impact of adjusting those settings. Especially the impact for the Windows devices within the environment. Besides that, it’s also important to be familiar with configurations that are not directly part of Endpoint analytics, but that do influence the results provided by Endpoint analytics. This post will focus on exactly those subjects! This post will provide an overview of what enabling Endpoint analytics means for the Windows devices.
Onboarding in Endpoint analytics
When looking at Endpoint analytics, it all starts with onboarding that functionality. That process is really straight forward and is often referred to the onboarding process of Endpoint analytics within the tenant. The main decision that must be made during that onboarding process is related to the devices of which data must be collected. Those devices will be targeted with the Intune data collection policy that will be automatically created. The following two steps walk through that process.
- Open the Microsoft Intune admin center portal and navigate to Reports > Endpoint analytics
- On the Endpoint analytics | Introduction page, select the device to collect data from by choosing between All cloud-managed devices, Selected devices and I’ll choose later and click Start
Note: This action creates the Intune data collection policy and assigns that policy to the selected devices.
Reviewing the created Windows device configuration
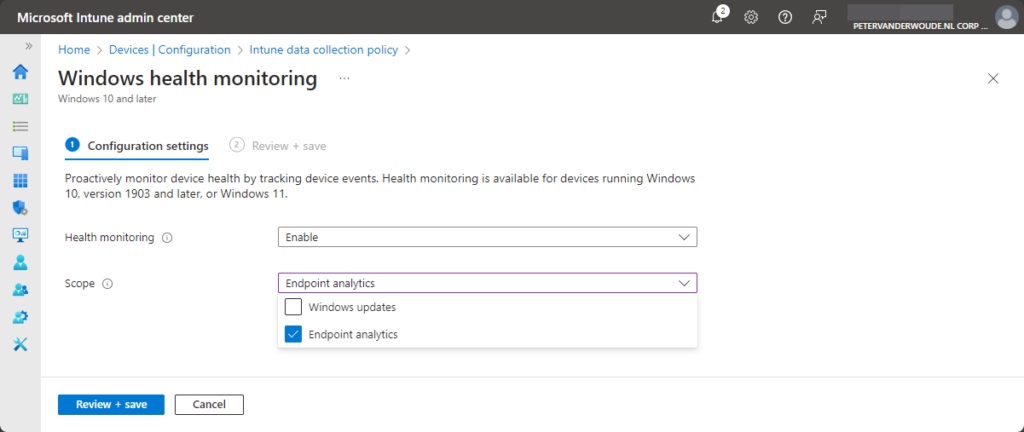
When the onboarding process for Endpoint Analytics is completed, the Intune data collection policy is automatically created. That policy contains the configuration for Windows devices to enable health monitoring, as shown below in Figure 1.
Figure 1: Overview of the default configuration settings
The Intune data collection policy is based on the Windows health monitoring configuration profile template and configures the settings from the DeviceHealthMonitoring node in the Policy CSP. Nowadays, that node contains multiple settings to configure the scope, instance and location for the collected data. These settings are described in the table below and make sure that the required device health monitoring data is collected and sent to the required location.
| Setting | Description |
|---|---|
| AllowDeviceHealthMonitoring | This policy setting can be used to enable device health monitoring, when using a Microsoft device monitoring service that requires it. The value of this setting is an integer. |
| ConfigDeviceHealthMonitoringScope | This policy setting is used to modify which health events are sent to the Microsoft device health monitoring service. This setting requires health monitoring to be enabled and is automatically managed by Microsoft Intune in coordination with the Microsoft device health monitoring service. The value of this setting is a string. |
| ConfigDeviceHealthMonitoringServiceInstance | This policy setting is used to modify to which instance of the Microsoft device health monitoring service the health events are sent. This setting requires health monitoring to be enabled and is managed by Microsoft Intune. The value of this setting is a string. |
| ConfigDeviceHealthMonitoringUploadDestination | This policy setting is used to modify which regional location of the Microsoft device health monitoring service the health events are sent. This setting requires health monitoring to be enabled and is automatically managed by Microsoft Intune in coordination with the Microsoft device health monitoring service. The value of this setting is a string. |
The good thing is that this configuration is completely managed by Microsoft Intune. Well, nearly completely. The IT administrator can still manually create a Windows health monitoring profile, but within that profile the IT administrator can only enable device health monitoring and the scope of the monitoring. The instance and destination of the health monitoring service is automatically and dynamically managed by Microsoft Intune in coordination with that service. That makes sure that the data is automatically stored within the required region. In general, in most cases, that Windows health monitoring profile will be completely automatically created when enabling Endpoint Analytics.
Note: It is good to be familiar with these settings, as it also provides a clear overview of the instance and destination of the device health monitoring service that the collected data is sent to.
Understanding other configurations that have impact
After onboarding Endpoint analytics, and applying the required configuration to the devices, it’s also good to be familiar with a few things that are important to known and that might impact the data collection on devices. Think about the following:
- The Connected User Experiences and Telemetry service must be running on the device
- The device requires a reboot, after receiving the configuration, to start sending data
- It can take up to 24-hours, after the reboot, before the data populates of the device
- The collected data falls in the Optional data category
Verifying the applied configuration on Windows
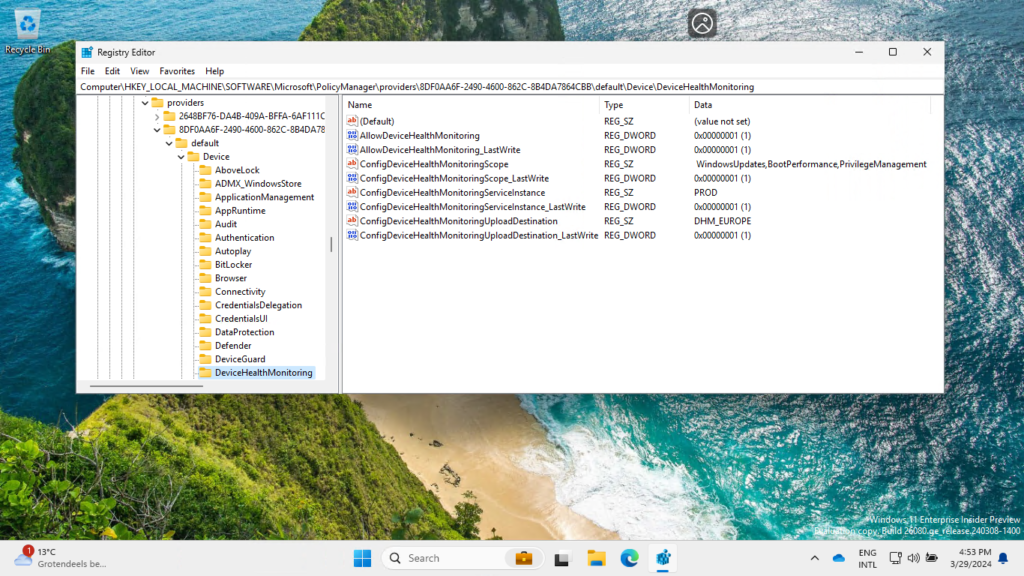
Now, after being familiar with the device health monitoring service configuration, it’s maybe even better to be familiar with the actual configuration locally on the device. That configuration will provide the IT administrator with a view on the actual instance and destination of the device health monitoring service that is used to sent the required data to. The easiest methods to verify that information is by either looking at the Event Viewer, the MDM Diagnostic Information report, or the registry. In the Event Viewer look in the Microsoft-Windows-DeviceManagement-Enterprise-Diagnostics-Provider/Admin log for Event ID 814 that configures the DeviceHealthMonitoring area. In the MDM Diagnostic Information report look for settings with the Configuration source of DeviceHealthMonitoring. And in the registry look for DeviceHealthMonitoring key that is set by the MDM provider. An example of that is shown below in Figure 2 and that includes the instance and destination configuration related to this environment.
Figure 2: Overview of the applied configuration
More information
For more information about Endpoint Analytics and Advanced Analytics, refer to the following docs.
Like this:
Recommend
About Joyk
Aggregate valuable and interesting links.
Joyk means Joy of geeK

