

Tips for conversion analysis with Fullstory’s Director of Solutions Architecture
source link: https://www.fullstory.com/blog/tips-for-conversion-analysis-with-irv-salisbury/
Go to the source link to view the article. You can view the picture content, updated content and better typesetting reading experience. If the link is broken, please click the button below to view the snapshot at that time.
Tips for conversion analysis with Fullstory’s Director of Solutions Architecture
Whenever a customer asks me what they should fix on their website or app first, my go-to response is always the same: start with Conversions. Rather than taking on the painstaking task of identifying issues one by one, Conversions offers a way to pinpoint the biggest hurdles your users face, ranked by urgency.
When setting up Conversions, the first step is to build a funnel that represents the steps you want your users to go through. For many brands, this would end with a purchase. For example, the funnel might look like:
Add to Cart
Review Cart
Checkout
Revenue Event
Quick note: you don’t need to use a purchase funnel for Conversions to be useful. You can analyze any set of steps, such as signing up, getting a quote, etc.
Once you have a funnel, scroll to the bottom of the page to the Conversion Opportunities section. This section lists the top signals that Fullstory’s algorithm could find, sorted by the estimated number of lost conversions during the selected time range. To start analyzing in Conversions, click Edit in Conversions.
Inside the Conversions interface, you can change the segment of users you want to analyze, the time range, and the signals you care about. In addition to the standard signals, I’ve found it helpful to add in ones specific to your site, such as:
Watched Elements - Add in error treatments like validation errors, out-of-stock warnings, and especially any “Unexpected” or “Oops” error treatments
Custom Events - Add in custom-defined events like a long loading spinner or clicking on Help. If the custom event has a property on it (like an error message) that can be used to distinguish the events, make sure to select that when adding it.
Pages - Add in error pages like a 404 page. If there is a Page Variable that can be used to distinguish / group the pages, make sure to select it when adding it.
The Conversions tool will then statistically analyze the segment of users going through the prescribed funnel over the time range specified. It will look for the selected signals within their sessions and analyze if those signals are causing users to drop out of the funnel more than users who did not have the signals. It will then rank and list those signals in order of lost conversions. This can be a tremendous time saver when hunting down the most impactful signals in your application, especially as these signals are causing users to drop out of your specified funnel.
The Opportunities to Improve section will show you the prioritized list like:
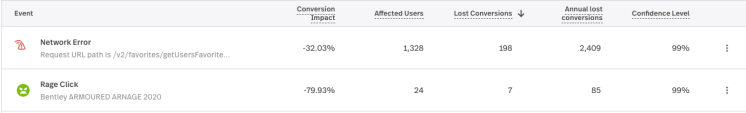
The columns I think are most important are:
Event -The signal experienced by the users.
The Conversion Impact - The % of users who had this signal who dropped out of the funnel vs those who did not have the signal.
Affected Users - How many users experienced the signal
Annual lost conversions - An annualized number of users who will not convert due to experiencing this signal. (If you have a Revenue Event, it will also show the annualized lost revenue)
Now, this is the tricky part, you’ll need to discern between the high quality and low quality signal results. Many signals are correlated with users dropping out versus causing them to drop out, and it can be difficult to tell the difference without watching sessions. Be prepared to be patient, because this part of the process can take awhile, as you watch sessions and analyze if they actually are the cause of the users dropping out.
To analyze a particular signal, click on it for more detailed information, including which step(s) the signal appeared on. You can open the Compare Dimensions section to see if there are any strong correlations by browser, device, location, etc.
At the bottom of the page, you can watch sessions that had or did not have the signal, and that failed to convert or successfully converted. I find that watching sessions of users who did have the signal and failed to convert is the best way to identify high-quality signals. When you click on a session, you can look in the event stream for events highlighted in red that will match the steps of the funnel and the signal you are currently analyzing.
From my experience with Conversions, I've distilled the following best practices:
Thehighest quality signals in my experience are the Watched Elements, Events and Pages you manually add to conversions. If any of those signals show up as a large conversion impact and/or large number of annual lost conversions, it's something you should dive into.
Of the built-in signals, the highest quality ones are typically the Network Error, Rage Click, and Dead Click signals. I’ve found the Error Click to be the lowest-quality signal.
The Web Vitals signals are only available for websites and are the hardest to prove from watching sessions. The higher the conversion impact, the more powerful they typically are. I’ve found the following two signals when they are greater than the “poor performance” according to web.dev, are the most important:
When I identify a signal that’s causing issues for users, I create a Metric Trend chart of the signal to see if it is consistently happening, if it recently appeared, or if it represents infrequent outages.
It usually takes watching at least ten sessions to really discern if a signal is correlated or causational. Sometimes the signal is just the first breadcrumb in following a longer trail to really figure out what is causing a problem. I like to set up a segment to further refine the set of steps I’m looking for to really zero in on the problem.
Even though there are often a lot of correlated signals to wade through, I have discovered that the friction points you find through this process will be the most impactful to your users and the ones you should fix first.
Recommend
-
11
-
5
Tips and Tricks · 6 min read5 opportunities to optimize ecommerce experience and conversionMadison EubanksPosted June 23, 2021In 2020, Amazon surpassed 50% of
-
4
Insights · 5 min readActionable approaches for building and analyzing ecommerce conversion funnelsMadison EubanksPosted July 07, 2021Your ecommerce conversion funnel—that is, the path that...
-
2
Tips and Tricks · 7 min read10 tips to run a successful conversion auditThe FullStory TeamPosted August 20, 2021Increase conversion rates with a site audit using a Digital Experience Intel...
-
7
7 min readTry this two-part framework for product management career successThe FullStory TeamPosted November 04, 2021 Your product career: Growing with intention“Where...
-
6
Insights · 5 min readWork smarter: 5 insights to be a better FullStory AdminThe FullStory TeamPosted April 07, 2022Here on the FullStory blog, we spend a lot of time waxing poetic about the...
-
3
-
1
-
2
-
2
Insights · 5 min readHow FullStory revolutionizes behavioral analytics with unmatched efficiency and insightThe FullStory TeamPosted January 29, 2024
About Joyk
Aggregate valuable and interesting links.
Joyk means Joy of geeK