

K6 壓力測試結果圖表自動化工具
source link: https://blog.darkthread.net/blog/k6-stress-test-chart-tool/
Go to the source link to view the article. You can view the picture content, updated content and better typesetting reading experience. If the link is broken, please click the button below to view the snapshot at that time.
K6 壓力測試結果圖表自動化工具
| 2023-04-14 11:09 PM | 1 | 954 |
先前示範了用 K6 對網站逐步加壓到噴出 503,當時我寫了一小段 C# 解析串流 JSON 檔轉成 CSV 並用 Excel 繪製圖表:
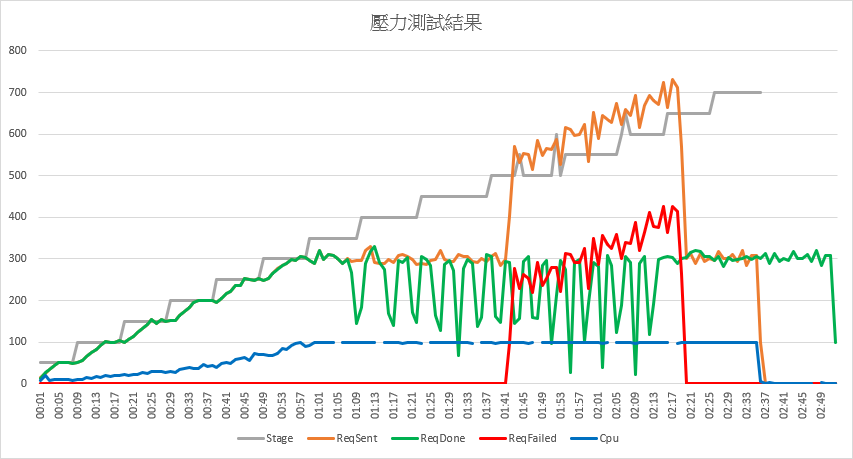
效果還不錯,但每次測試完得跑 C# 程式、複製 CSV 數字、貼到 Excel 範本,做完一串手工藝才能拿到圖表。我心中的壓力測試程序會是:先測一次當基準,升級硬體測一次,調個程式再測一次,有可能一小時要測個十來次。每次測完都要做一堆手工超出我的耐心極限,我開始動腦筋優化流程。
前幾天試了在 K6 測試腳本新增 Scenario 同時由 WebAPI 取回 CPU 使用率,CPU 數據同步存入結果 JSON,省下手工從伺服器取回效能計數器資料檔的麻煩,離「跑 K6 壓測存 JSON 檔,解析 JSON 檔繪成圖表」的理想又更近了。
經過評估,我決定將 C# 解析程式改寫成 Node.js 版,圖表部分則擺脫笨重的 Excel,改用 JavaScript 圖表程式庫繪製。這回需要的圖表算單純,用我熟悉的 Highcharts 有點殺雞用牛刀,另一方面免費版限非商業使用可能造成困擾,我挑了頗受歡迎 (Github 6 萬顆星) 的開源程式庫 - Chart.js 作為本次圖表擔當。
如此,整條生產線從 K6 壓測、資料解析到圖表繪製全部都用 JavaScript,開發者只需會一種語言就能搞定,豈不美哉?而我自己則藉此機會體驗 Node.js 程式開發並多學一套圖表程式庫,讓技能樹多冒兩根嫩芽,滿足自己的需求又學到新東西,這才符合 Side-Project 精神。
壓測程式部分我修改了前篇文章版本,將測試主機 IP/Port、測試 WebApi URL、最高目標流量(每秒發動多少次請求)、效能監視 API... 等當成參數,如此透過調參數就能測試不同 WebAPI (例如:SQLite vs SQLServer)、流量(例如:Target 500 vs 1000),至少切換測試對象及壓力數值時不用改程式。
stress.js 程式範例如下,但 default function() 部分需配合測試對象修改就是了。
import http from 'k6/http';
import { sleep, check } from 'k6';
import { getCurrentStageIndex } from 'https://jslib.k6.io/k6-utils/1.3.0/index.js';
import exec from 'k6/execution';

const baseUrl = __ENV.BASEURL || 'http://10.8.0.6';
const loadTarget = __ENV.TARGET || 700;
const apiPath = __ENV.APIPATH || 'Registration/TestJson';
const perfApiUrl = __ENV.PERFAPIURL || `${baseUrl}:5000`

const stages = [];
for (let t = 50; t <= loadTarget; t += 50) {
  stages.push({ duration: '5s', target: t }, { duration: '5s', target: t });
}
export const options = {
    systemTags: ['status','error'],
    scenarios: {
      stress: {
        executor: 'ramping-arrival-rate',
        preAllocatedVUs: 10000,
        timeUnit: "1s",
        stages: stages
      },
      monitor: {
        executor: 'constant-arrival-rate',
        preAllocatedVUs: 1,
        rate: 1,
        duration: 20 + stages.length * 5 + 's',
        timeUnit: "1s",
        exec: 'monitor'
      }
    }
};

const jsonPayload = `{
"LotteryUid":"b1a2bef2-0951-48c1-b97b-4a8988447c15",
"SoldTime":"2023-04-04T23:58:44.287528+08:00",
"RetailerId":"0000",
"Numbers":"AQgCAwUN",
"MegaNumber":7,
"ReqSign":"jcGK37pXuW9bGTKJ7/bmDSTuROx3TY/H31USgGtRfkc7pYFkFDoNg9XwJc7g9dUSBSEOWK7WCDJMDL8VlEn8OBttFTVgDc9nTPZpASdUawFJXhmLRgb7AVG5iWNsbxAAaDLW5yDEOEjzWsMpA5dukMJN6RHUUHfuVkux60nE240="
}`;

export default function() {
  let res = http.post(`${baseUrl}/${apiPath}`, jsonPayload, {
    tags: {
      sentTime: new Date().toISOString(),
      target: stages[getCurrentStageIndex()].target
    },
    headers: { 'Content-Type': 'application/json' }
  });
  check(res, {
    'status is 200': (r) => r.status === 200
  });
}

export function monitor() {
    let res = http.get(perfApiUrl);
    check(res, {
        'status is 200': (r) => r.status === 200
    }, { cpu: res.body.split(',')[1], time: res.body.split(',')[0] });
}
解析我寫了一支 k6-stress-test-chart.js,打算用 Node.js 執行,這是我第一次寫 Node.js 程式,如同一場探險之旅,靠 ChatGPT 幫忙,許多蠢問題瞬間得到答案,還不會被罵。XD 不過有些問題 Google 比較快,不必糾結非要 ChatGPT 回答。我自己拿捏的尺度是 Prompt 改兩次還沒有結果就改 Google,把反覆調整嘗試 Prompt 的時間拿來爬文更快得到答案。
筆記本次學到的 Node.js 技巧:
- 彈性命令列參數
使用 minimist 套件,var argv = require('minimist')(process.argv.slice(2));,可以從node example/parse.js -a beep -b boo test解析出{ _: ['test'], a: 'beep', b: 'boop' },方便彈性輸入命令列參數。 - 4 ways to read file line by line in Node.js
K6 輸出的 JSON 行數高達數十萬行,fs.readFile() 一次讀入會遇到cannot create a string longer than 0x1fffffe8 characters錯誤,我用 fs.createReadStream() 逐行讀取克服。 - Build a Command-Line Progress Bar in Node.JS
解析數十萬行的 JSON 要花上一兩分鐘,為避免等待焦慮,我學會用 readline.cursorTo(process.stdout, 0) 控制座標顯示進度數字,以及用 process.stdout.write("\x1B[?25l") 隱藏游標的技巧 - 預先做好 chart.html 圖表網頁範本,程式讀取範本 HTML 插入數據資料並另存新檔案,用瀏覽器開啟時呈現結果圖表
- How to use nodejs to open default browser and navigate to a specific URL
從 Node.js 啟動預設瀏覽器開啟特定連結的技巧 - 路徑處理函式 path.resolve()、建立目錄 fs.mkdirSync()...
至於圖表部分,Chart.js 還算好上手,我用到幾個技巧:
- Y 軸可以上下堆疊,CPU% 只有 0-100,刻度與每秒請求次數(1)合併的話不易閱讀,我把它移到下方(2)
- 成功回應平均時間高達 35,000,範圍跟每秒請求跟回應數 700 差距更大,故我將平均時 Y 軸放在右側(3),刻度獨立
- Targe 跟 CPU% 使用區塊填色,增加可讀性
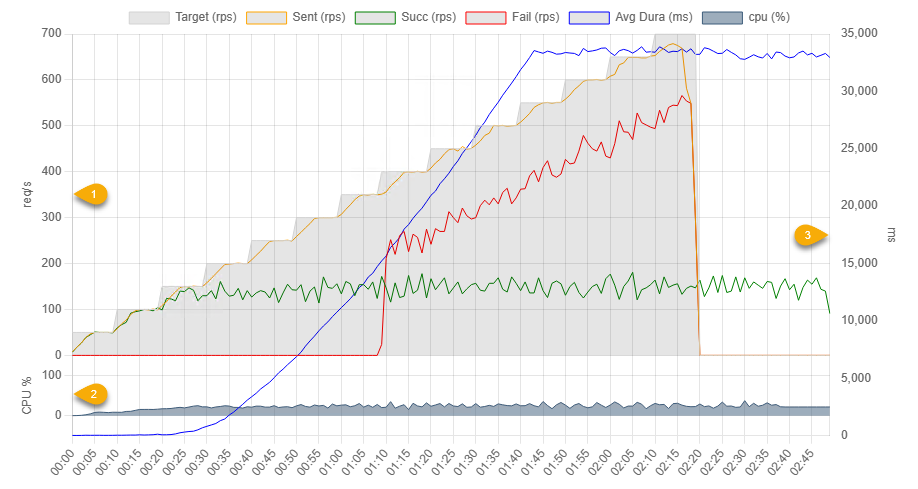
chart.html 內容如下:
<!DOCTYPE html>
<html>

<head>
  <title>K6 Stress Test Chart</title>
  <script src="https://cdn.jsdelivr.net/npm/chart.js"></script>
  <style>
    body {
      width: 90vw;;
      margin: auto;
    }
    .chart-container {
      position: relative;
      width: 100%;
      height: 50vh;
      min-height: 480px;
    }
    span.msg {
      font-weight: bold; color: brown;
    }
    span.times {
      font-size: 0.8em; color: #333;
    }
    #testTime {
      font-size: 0.8em; color: #333; text-align: right; margin-right: 12px;
    }
  </style>
</head>

<body>
  <div>
    <h2>Stress Test</h2>
    <div id="testTime"></div>
  </div>
  <div class="chart-container">
    <canvas id="myChart"></canvas>
  </div>
  <ul id="errList">
  </ul>
  <script>
    function drawChart(data) {
      const chart = new Chart(document.getElementById('myChart').getContext('2d'), {
        type: 'line',
        data: {
          labels: data.labels,
          datasets: data.datasets
        },
        options: {
          animation: false,
          maintainAspectRatio: false,
          scales: {
            y3: { position: 'left', stack: 'left', stackWeight: 1, offset: true, min: 0, max: 100, title: { display: true, text: 'CPU %' } },
            y1: { position: 'left', stack: 'left', stackWeight: 4, title: { display: true, text: 'req/s' } },
            y2: { position: 'right', grid: { display: false }, title: { display: true, text: 'ms' } },
          }
        }
      });
    }
    function listErrors(errors) {
      const ul = document.getElementById('errList');
      const stats = {};
      errors.forEach(e => {
        const [time, msg] = e.split('\t');
        const key = msg.replace(/tcp ([\d.]+):(\d+)->/, "tcp $1:*->")
        if (stats[key]) {
          stats[key].push(time);
        } else {
          stats[key] = [time];
        }
      });
      Object.keys(stats).forEach(msg => {
        const li = document.createElement('li');
        li.innerHTML = `<span class=msg>${msg}</span><br /><span class=times>${stats[msg].join(',')}</span>`;
        ul.appendChild(li);
      });
    }
    function setChartTitle(title, testTime) {
      document.title = title;
      document.querySelector('h2').innerText = title;
      document.getElementById('testTime').innerText = testTime;
    }
  </script>
  <script></script>

</body>

</html>
k6-stress-test-chart.js,我的第一支 Node.js 作品:
const events = require('events'), fs = require('fs'), readline = require('readline'), path = require('node:path');
const argv = require('minimist')(process.argv.slice(2));
const filename = argv._[0] ?? 'result.json';
const title = argv['t'] ?? `Stress Test Report - ${new Date().toLocaleString('en-US')}`;
const chartsDir = argv['d'] ?? 'charts';
if (!fs.existsSync(chartsDir)) fs.mkdirSync(chartsDir);
const htmlPath = path.resolve(chartsDir, argv['f'] ?? `chart-${new Date().toISOString().replace(/[-T:.Z]/g, '')}.html`);

const chartOpt = {
  labels: [], datasets: [],
  addDataSet(label, data, color, fill = false, yAxisID = 'y1', backgroundColor = 'rgba(0,0,0,0.1)') {
    this.datasets.push({
      label, data, borderColor: color, yAxisID, backgroundColor,
      pointRadius: 0, fill, borderWidth: 1, lineType: 'line'
    });
  }
};

let baseTime = undefined;
const perfData = {};
const toHHmmss = d => d.toLocaleTimeString('en-US', { hour12: false });
(async function processLineByLine() {
  try {
    const rl = readline.createInterface({
      input: fs.createReadStream(filename), crlfDelay: Infinity
    });
    const points = {}, errors = [];
    let lineCounts = 0;
    rl.on('line', (line) => {
      lineCounts++;
      if (!line.startsWith(`{"metric":"http_req_duration"`) && !line.startsWith(`{"metric":"checks"`)) return;
      const { tags, time, value: duration } = JSON.parse(line).data;
      const { sentTime, status, target, cpu, time: perfTime } = tags;
      if (cpu !== undefined) { // cpu data
        perfData[perfTime.split('.')[0]] = { cpu: cpu };
        return;
      }
      if (!sentTime) return;
      const logTimeNative = new Date(time), startTimeNative = new Date(sentTime);
      logTimeNative.setMilliseconds(0);
      startTimeNative.setMilliseconds(0);
      if (!baseTime) baseTime = startTimeNative;
      const startTime = toHHmmss(startTimeNative), logTime = toHHmmss(logTimeNative);
      if (!points[startTime]) points[startTime] = new Point(startTimeNative);
      if (!points[logTime]) points[logTime] = new Point(logTimeNative);
      const startTimePoint = points[startTime], logTimePoint = points[logTime];
      startTimePoint.sentCount++;
      if (!startTimePoint.target) startTimePoint.target = target;
      if (status === '200') {
        logTimePoint.succCount++;
        logTimePoint.totalSuccDura += duration;
      } else {
        logTimePoint.failCount++;
        if (!logTimePoint.errCodes[status]) logTimePoint.errCodes[status] = 1;
        logTimePoint.errCodes[status]++;
        if (tags.error) errors.push(`${logTimePoint.timespan}\t${tags.error}`);
      }
      readline.cursorTo(process.stdout, 0);
      process.stdout.write(`${lineCounts.toLocaleString('en-US')} lines processed`);
    });

    process.stdout.write("\x1B[?25l"); //hide cursor when processing
    await events.once(rl, 'close');
    process.stdout.write("\x1B[?25h"); //show cursor

    const sortedPoints = Object.keys(points).sort().map((time) => points[time]);
    const labels = [], sent = [], succ = [], fail = [], targets = [], avgDura = [], cpu = [];
    let lastCpu = 0;
    for (const { timespan, sentCount, succCount, failCount, target, time, avgSuccDura } of sortedPoints) {
      labels.push(timespan);
      sent.push(sentCount);
      succ.push(succCount);
      fail.push(failCount);
      targets.push(target);
      lastCpu = perfData[time]?.cpu ?? lastCpu;
      cpu.push(lastCpu);
      avgDura.push(avgSuccDura);
    }

    chartOpt.labels = labels;
    chartOpt.addDataSet('Target (rps)', targets,'lightgray', true);
    chartOpt.addDataSet('Sent (rps)', sent, 'orange');
    chartOpt.addDataSet('Succ (rps)', succ, 'green');
    chartOpt.addDataSet('Fail (rps)', fail, 'red');
    chartOpt.addDataSet('Avg Dura (ms)', avgDura, 'blue', false, 'y2');
    chartOpt.addDataSet('cpu (%)', cpu, 'rgba(61, 93, 122, 1)', true, 'y3', 'rgba(61, 93, 122, 0.5)');
    let html = fs.readFileSync(path.resolve('.', 'chart.html'), 'utf-8', 'r');
    html = html.replace(
      `<script></script>`,`<script>setChartTitle(${JSON.stringify(title)}, "${baseTime.toLocaleString('en-US')}");
let data=${JSON.stringify(chartOpt)};drawChart(data);
let errors=${JSON.stringify(errors)};listErrors(errors);
</script>`);
    fs.writeFileSync(htmlPath, html);
    console.log(`\n${sortedPoints.length} points saved`);
    var url = `file:///${htmlPath}`;
    var start = (process.platform == 'darwin' ? 'open' : process.platform == 'win32' ? 'start' : 'xdg-open');
    require('child_process').exec(start + ' ' + url);
  } catch (err) {
    console.error(`Error parsing JSON: ${err}`);
    return;
  }
})();

class Point {
  sentCount = 0;
  succCount = 0;
  failCount = 0;
  target = 0;
  totalSuccDura = 0;
  get avgSuccDura() {
    return this.succCount ? Math.round(this.totalSuccDura / this.succCount) : 0;
  }
  errCodes = {};
  constructor(time) {
    this.time = toHHmmss(time);
    this.timespan = new Date(time - baseTime).toUTCString().match(/\d\d:(\d\d:\d\d)/)[1];
  }
}
效果如何呢?實際看操作影片比較有 fu:
在影片中,我分別測試了 /Registration/TestJson (純 POST JSON 參數物件及取得 JSON 回應物件) 及 /Registration/Register (純 POST JSON 參數物件,寫入 SQLite DB、傳回 JSON 回應物件),過程只修改 CLI 參數而已,一氣喝成完成兩次測試,並得到兩張壓測結果報表,
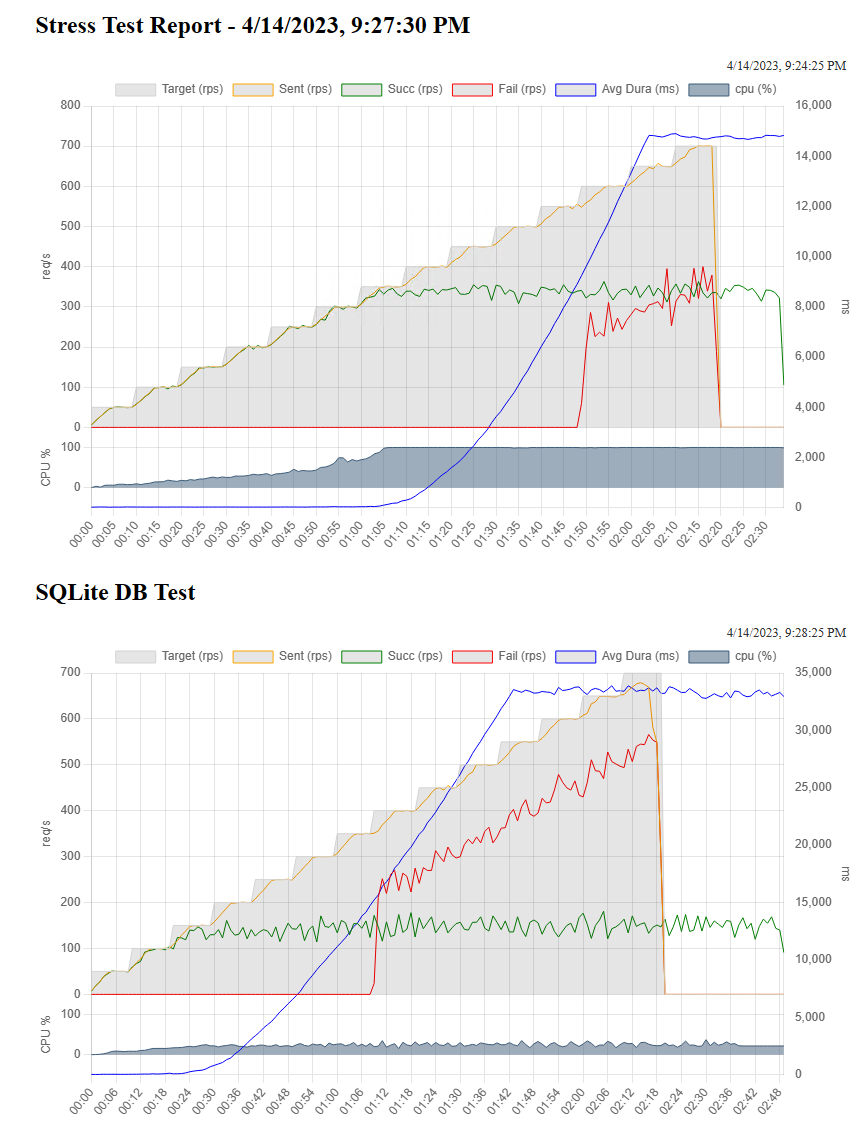
二者對照可看出明顯差異,串接 DB 後,CPU 無法提升到 100%,最高就到 35% 左右,但因為要排隊寫進資料庫,Throughput 最高只到 180 RPS 就升不上去,大約 1:08 左右 503 大量出現,最高達到 550 次/秒。由於每秒能消化的請求數上限不到 200 RPS (未串 DB 時約 330 RPS),Stage 跑完還在慢慢消化排隊的請求,而請求平均完成時間也高達 33 秒左右(未串 DB 時為 14.5 秒)。串接壓力測試與之前的測試相比,形態上有所不同,可視為瓶頸非 CPU 而是等待 I/O 的典型範例。
有了好用工具跟簡便的測試程序,之後要做效能調校就方便了。
Recommend
About Joyk
Aggregate valuable and interesting links.
Joyk means Joy of geeK