

Tesseract Analytics & AI
source link: https://tesseractanalytics.ai/
Go to the source link to view the article. You can view the picture content, updated content and better typesetting reading experience. If the link is broken, please click the button below to view the snapshot at that time.
Financial Data Visual Exploration
Visually analyze and explore financial data using our compressed columnar database.
We currently have financial statements downloaded from Edgar SEC for over 5000 companies, joined to their stock symbols with stock prices.
The data is optimized for analytics, company comparison, sector analysis, historical performance, and in-depth financial analysis.
Measures
- Net Income
- Cash Flows (Operating, Investing, Financing)
- Price per Earnings Per Share
- Yield (Net Income/Market Cap)
- Dividends
- Assets, Liabilities, Long Term/Short Term Debt
- Revenues
- Market Capitalization
- Intangible Assets
- Volume (Shares)
- Stock Price
- Share Outstanding
- + More
Categories
- Market Sector/Industry Type
- Company Central Index Key (Edgar) and Stock Symbol
- Company Size Grouping (Market Capitalization)
- Country/Region of Incorporation for US domestic vs multi-national analysis
- Company Name
- SEC Seasoned Issuer
- Is in S&P 500
- + More
We are currently looking for Beta Testers
Unlimited access, and in return we would love your feedback! No string attached, no time commitment necessary.
Please fill out this registration form for access: Financial Database Registration Form
Our data is updated nightly for previous day’s analysis.
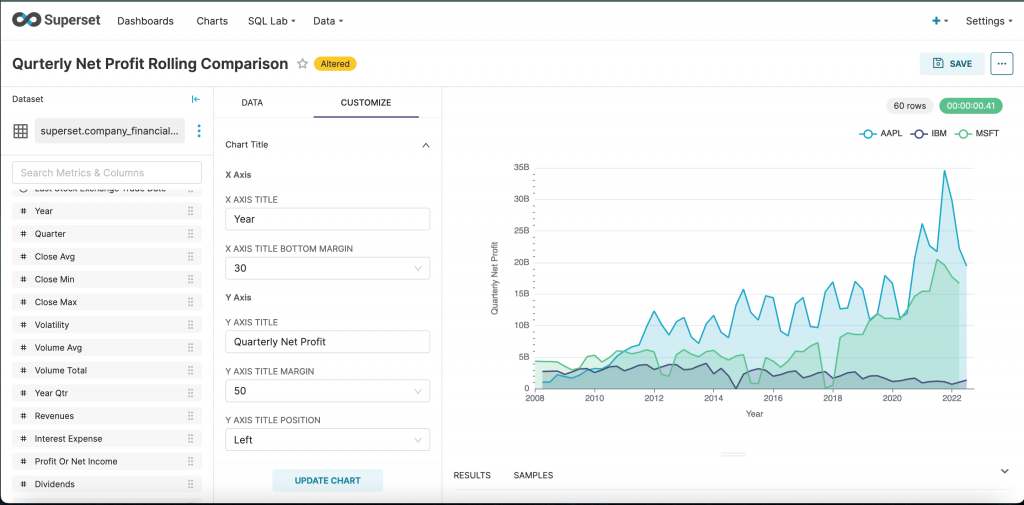
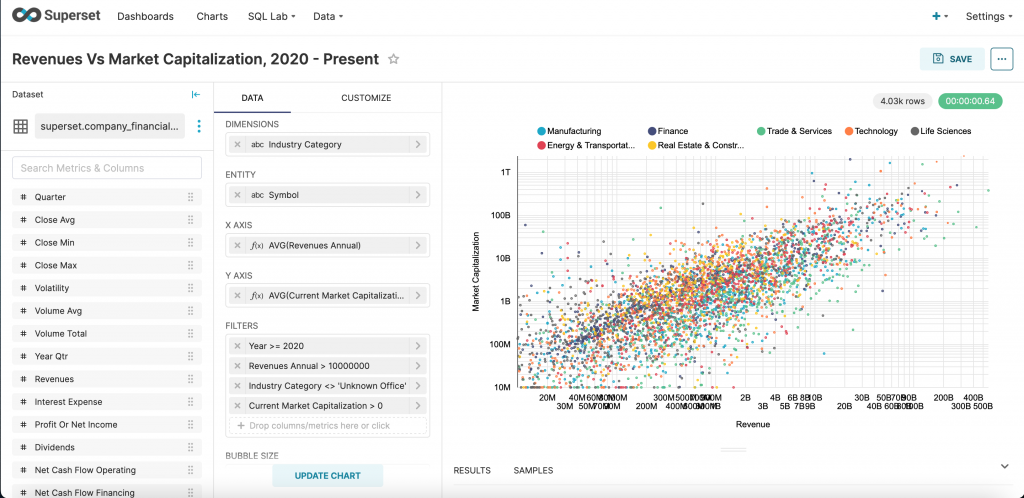
You can build charts and dashboards to find relationships, analyze companies, and gather insights.
Explore real data with Apache SuperSet directly on our website here: https://explore.tesseractanalytics.ai/
Recommend
About Joyk
Aggregate valuable and interesting links.
Joyk means Joy of geeK