

How Discord Indexes Billions of Messages
source link: https://discord.com/blog/how-discord-indexes-billions-of-messages
Go to the source link to view the article. You can view the picture content, updated content and better typesetting reading experience. If the link is broken, please click the button below to view the snapshot at that time.
Millions of users send billions of messages on Discord every month. A way to search this history quickly became one of the most requested features we built. Let there be search!
The Requirements
- Cost Effective: The core user experience on Discord is our text and voice chat. Search is an accessory feature, and the price of the infrastructure needed to reflect that. Ideally this means search shouldn’t cost more than the actual storage of messages.
- Fast & Intuitive: All the features we build need to be fast and intuitive, including search. The search experience in our product needed to look and feel awesome to use too.
- Self-healing: We don’t have a dedicated devops team (yet), so search needed to be able to tolerate failures with minimal to no operator intervention.
- Linearly Scalable: Just like how we store messages, increasing the capacity of our search infrastructure should involve adding more nodes.
- Lazily Indexed: Not everyone uses search — we shouldn’t index messages unless someone attempts to search them at least once. Additionally, if an index fails, we needed to be able to re-index servers on the fly.
In looking at these requirements, we asked ourselves two key questions:
Q. Could we outsource search to a managed SaaS? (easymode)
A. Nope. Every solution we looked at that did managed search would have blown our budget (by an astronomically high margin) for this feature. Additionally, the thought of shipping messages out of our datacenter did not sit well with the team. As a security conscious team, we wanted to be in control of the security of users’ messages, not trusting a third party to know what they are doing.
Q. Is there an open source solution to search that we can use?
A. Yeah! We looked around and the conversation internally quickly came to Elasticsearch vs Solr, as both could be an appropriate fit for our use case. Elasticsearch had the edge:
- Node discovery on Solr requires ZooKeeper. We run etcd, and did not want to have additional infrastructure specifically for Solr. Elasticsearch’s Zen Discovery is self contained.
- Elasticsearch supports automatic shard rebalancing, which would let us add new nodes to the cluster, fulfilling the linearly scalable requirement out of the box.
- Elasticsearch has a structured query DSL built-in, whereas you’d have to programmatically create a query string with Solr using a third party library.
- Engineers on the team had more experience working with Elasticsearch

Would Elasticsearch Work?
Elasticsearch seemed to have everything we wanted and our engineers had experience working with it in the past. It provided a way to replicate data across different nodes to tolerate the failure of a single node, scale up the cluster by adding more nodes, and could ingest messages to be indexed without breaking a sweat. Reading around, we heard some horror stories about managing large Elasticsearch clusters, and really none of our backend team had any experience with managing Elasticsearch clusters apart from our logging infrastructure.
We wanted to avoid these cumbersome, large clusters, so we came up with the idea to delegate sharding and routing to the application layer, allowing us to index messages into a pool of smaller Elasticsearch clusters. This meant that in the event of a cluster outage only Discord messages contained on the affected cluster would be unavailable for searching. This also gave us the advantage of being able to throw away an entire cluster’s data should it become unrecoverable (the system is able to lazily re-index the Discord server the next time a user performs a search).
The Components
Elasticsearch likes it when documents are indexed in bulk. This meant that we couldn’t index messages as they were being posted in real time. Instead, we designed a queue in which a worker grabs a bunch of messages and indexes them within in a single bulk operation. We decided that this small delay between when a message was posted and when it became searchable was a perfectly reasonable constraint. After all, most users search for messages said historically, not something just said.

On the ingest side, we needed a few things:
- Message Queue: We needed a queue that we can put messages into as they are posted in real time (to be consumed by a pool of workers).
- Index Workers: Workers that do the actual routing and bulk inserts into Elasticsearch from the queue.
We built a task queuing system on top of Celery already, so we leveraged it also for our historical index workers.
- Historical Index Workers: Workers responsible for iterating through the message history in a given server and inserting them into the Elasticsearch index.
We also needed a quick and easy mapping of which Elasticsearch cluster and index a Discord server’s messages would reside on. We call this “cluster + index” pair a Shard (not to be confused with Elasticsearch’s native shards within an index). The mapping we created comes in two layers:
- Persistent Shard Mapping: We put this on Cassandra, our primary data store for persistent data, as the source of truth.
- Shard Mapping Cache: When we’re ingesting messages on our workers, querying Cassandra for a Shard is a slow operation. We cache these mappings in Redis, so that we can do mget operations to quickly figure out where a message needs to be routed to.
When a server is being indexed for the first time, we also needed a way to select which Shard to hold a Discord server’s messages on. Since our Shards are an application layered abstraction, we can be a bit smart about how to allocate them. By harnessing the power of Redis, we used a sorted set to build a load aware shard allocator.
- Shard Allocator: Using a sorted set in Redis we keep a set of the Shards with a score that represents their load. The Shard with the lowest score is the shard that should be allocated next. The score gets incremented with each new allocation, and each message that is indexed in Elasticsearch has a probability to increment the score of its Shard too. As Shards get more data in them they have a less likely chance of being allocated to a new Discord server.
Of course, this entire search infrastructure would be incomplete without a way to discover clusters and the hosts within them from the application layer.
- etcd: We use etcd for service discovery in other parts of our system, so we also used it for our Elasticsearch clusters. Since nodes in a cluster can announce themselves onto etcd for the rest of the system to see, we don’t have to hardcode any Elasticsearch topologies.
Finally, we needed a way for clients to be able to actually search things.
- Search API: An API endpoint that clients can issue search queries to. It needed to do all the permission checks to make sure that clients are only searching messages they actually have access to.

Indexing & Mapping the Data
At a really high level, in Elasticsearch, we have the concept of an “index,” containing a number of “shards” within it. A shard in this case is actually a Lucene index. Elasticsearch is responsible for distributing the data within an index to a shard belonging to that index. If you want, you can control how the data is distributed amongst the shards by using a “routing key.” An index can also contain a “replication factor,” which is how many nodes an index (and its shards within) should be replicated to. If the node that the index is on fails a replica can take over (Unrelated but related, these replicas can also serve search queries, so you can scale the search throughput of the index by adding more replicas).
Since we handed all of the sharding logic in the application level (our Shards), having Elasticsearch do the sharding for us didn’t really make sense. However, we could use it to do replication and balancing of the indices between nodes in the cluster. In order to have Elasticsearch automatically create an index using the correct configuration, we used an index template, which contained the index configuration and data mapping. The index configuration was pretty simple:
- The index should only contain one shard (don’t do any sharding for us)
- The index should be replicated to one node (be able to tolerate the failure of the primary node the index is on)
- The index should only refresh once every 60 minutes (why we had to do this is explained below).
- The index contains a single document type: message
Storing the raw message data in Elasticsearch made little sense as the data was not in a format that was easily searchable. Instead, we decided to take each message, and transform it into a bunch of fields containing metadata about the message that we can index and search on:
You’ll notice that we didn’t include timestamp in these fields, and if you recall from our previous blog post, our IDs are Snowflakes, which means they inherently contain a timestamp (which we can use to power before, on, and after queries by using a minimum and maximum ID range).
These fields however aren’t actually “stored” in Elasticsearch, rather, they are only stored in the inverted index. The only fields that are actually stored and returned are the message, channel and server ID that the message was posted in. This means that message data is not duplicated in Elasticsearch. The tradeoff being that we’ll have to fetch the message from Cassandra when returning search results, which is perfectly okay, because we’d have to pull the message context (2 messages before & after) from Cassandra to power the UI anyway. Keeping the actual message object out of Elasticsearch means that we don’t have to pay for additional disk space to store it. However, this means we can’t use Elasticsearch to highlight matches in search results. We’d have to build the tokenizers and language analyzers into our client to do the highlighting (which was really easy to do).
Actually coding it.
We decided that a microservice for search was probably not required, and instead we exposed a library that wrapped our routing and querying logic to Elasticsearch. The only additional service we needed to run is the index workers (which would use this library to do the actual indexing work). The API surface area exposed to the rest of the team was also minimal, so that if it did need to be moved to it’s own service, it could easily be wrapped in an RPC layer. This library could be imported by our API workers as well to actually execute the search queries and return results to the user over HTTP.
To the rest of the team, the library exposed a minimal surface area for searching messages:
Queueing a message to be indexed or deleted:
Bulk indexing (roughly) real time messages within a worker:
For indexing a server’s historical messages, a historical index job which would perform a unit of work and return the next job that needed to run to continue indexing that server. Each job represents a cursor into a server’s message history and a fixed unit of execution (in this case defaulting to 500 messages). The job returns a new cursor to the next batch of messages to be indexed or None if there is no more work to be done. In order to return results quickly for a large server, we split the historical indexing into two phases, an “initial” and “deep” phase. The “initial” phase indexes the last 7 days of messages on the server and makes the index available to the user. After that, we index the entire history in the “deep” phase, which executes at a lower priority. This article shows what it looks like to the user. These jobs are executed in a pool of celery workers, allowing for scheduling of the jobs amongst other tasks that the workers run. This roughly looks like:
Testing It Out On Production

After coding this up and testing it on our development environment, we decided it was time to see how it’d perform on production. We spun up a single Elasticsearch cluster with 3 nodes, provisioned the index workers, and scheduled 1,000 of the largest Discord servers to be indexed. Everything seemed to be working, however when looking at the metrics on the cluster, we noticed two things:
- CPU usage way higher than expected.
- Disk usage was growing way too fast for the volume of messages being indexed.
We were pretty confused, and after letting it run for a while and use up way too much disk space, we cancelled the index jobs and called it for the night. Something wasn’t quite right.
When we came back the following morning we noticed that disk usage had shrunk by A LOT. Did Elasticsearch throw away our data? We tried issuing a search query on one of the servers that we indexed that one of us was in. Nope! The results were being returned just fine — and fast too! What gives?
Disk Usage Growing Fast then Tapering Off
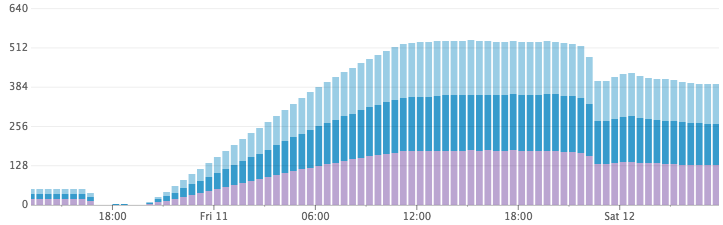
CPU Usage
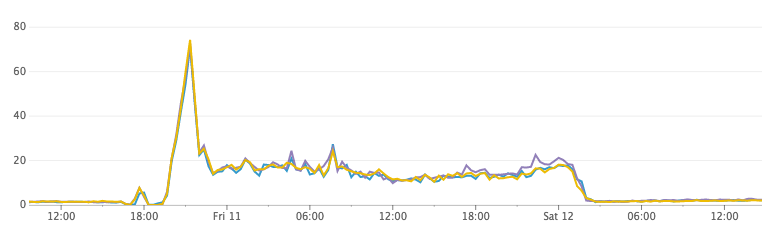
After doing some research, we came up with a hypothesis! By default, Elasticsearch has its index refresh interval set to 1 second. This is what provides the “near real-time” search ability in Elasticsearch. Every second (across a thousand indexes) Elasticsearch was flushing the in-memory buffer to a Lucene segment, and opening the segment to make it searchable. Over night, while idle, Elasticsearch merged the massive amounts of tiny segments it generated into much larger (but more space efficient) ones on disk.
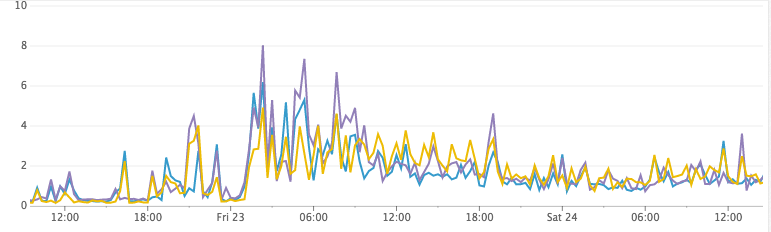
Testing this out was pretty simple: We dropped all the indexes on the cluster, set the refresh interval to an arbitrarily large number, and we then scheduled the same servers to be indexed. CPU usage was down to almost nothing while the documents were being ingested, and disk usage was not growing at an alarmingly high rate. Huzzah!
Disk Usage After Decreasing the Refreshing Interval
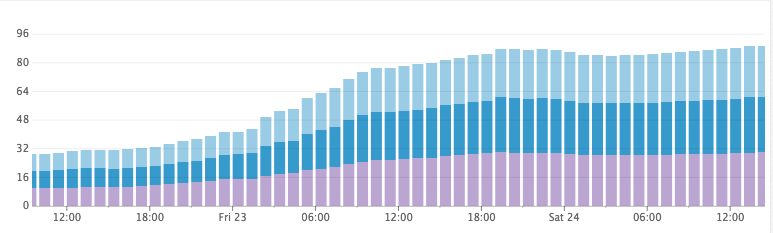
CPU Usage
Unfortunately, however, turning off the refresh interval doesn’t work in practice…
Refreshing Woes
It had become apparent that Elasticsearch’s automatic near real-time index availability wouldn’t work for our needs. Chances are a server could go hours without needing to execute a single search query. We needed to build a way to control the refreshing from the application layer. We did this through an expiring hashmap in Redis. Given that servers on Discord are sharded into shared indexes on Elasticsearch, we can build a quick map that is updated alongside the index, tracking if an index needs to be refreshed — given the server you are searching in. The data structure was simple: the Redis key storing the hashmap was prefix + shard_key to a hashmap of guild_id to a sentinel value saying that it needed to be refreshed. In retrospect, this could have probably been a set.
The indexing lifecycle thus turned into:
- Take N messages from the queue.
- Figure out where these messages should be routed to by their guild_id.
- Execute bulk insert operations to the relevant clusters.
- Update the Redis mappings, signifying that the shard and the given guild_ids within the Shard that were updated are now dirty. Expire this key after 1 hour (as Elasticsearch would have auto-refreshed by then).
And the search lifecycle turned into:
- Look up the Shard that needs to be queried for the guild_id.
- Check the Redis mapping to see if the Shard AND guild_id is dirty.
- If dirty, do a refresh of the Shard’s Elasticsearch Index, and mark the entire Shard as clean.
- Execute the search query and return results.
You may have noticed that even though we now explicitly control the refreshing logic on Elasticsearch, we still have it auto-refresh the underlying index every hour. If data-loss occurs on our Redis mapping it’d take at most one hour for the system to correct itself automatically.
The Future
Since deploying in January, our Elasticsearch infrastructure has grown to 14 nodes across 2 clusters, using the n1-standard-8 instance type on GCP with 1TB of Provisioned SSD each. The total document volume is almost 26 billion. The rate of indexing peaked at approximately 30,000 messages per second. Elasticsearch has handled it without a sweat — remaining at 5–15% CPU throughout our roll-out of search.
So far, we’ve been able to add more nodes to the clusters with ease. At some point, we will spin up more clusters so that new Discord servers being indexed land on them (thanks to our weighted shard distribution system). On our existing clusters, we’ll need to limit the number of master eligible nodes as we add more data nodes to the cluster.

We’ve also stumbled upon 4 primary metrics that we use to decide when the cluster needs to be grown:
- heap_free: (aka heap_committed — heap_used) When we run out of free heap space, the JVM is forced to do a full stop-the-world GC to quickly reclaim space. If it fails to reclaim enough space, the node will crash and burn. Before then, the JVM will get into a state where it’s doing stop-the-world GCs constantly as the heap fills up and too little memory is freed during each full GC. We look at this along with GC stats to see how much time is spent garbage collecting.
- disk_free: Obviously when we run out of disk space, we’ll need to add more nodes, or more disk space to handle new documents being indexed. This is very easy on GCP as we can just grow the size of the disk without rebooting the instance. Choosing between adding a new node or resizing disks depends on how the other metrics mentioned here look. For example, if disk usage is high, but the other metrics are at acceptable levels, we’ll choose to add more disk space rather than a new node.
- cpu_usage: If we reach a threshold of CPU usage during peak hours.
- io_wait: If the IO operations on the cluster are getting too slow.
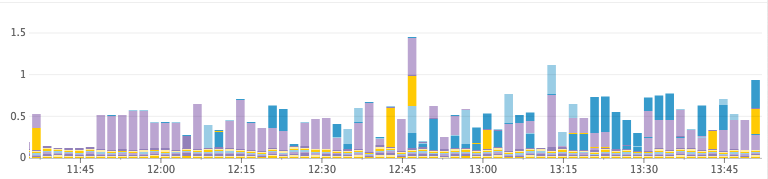
Unhealthy Cluster (ran out of heap)
Heap Free (MiB)
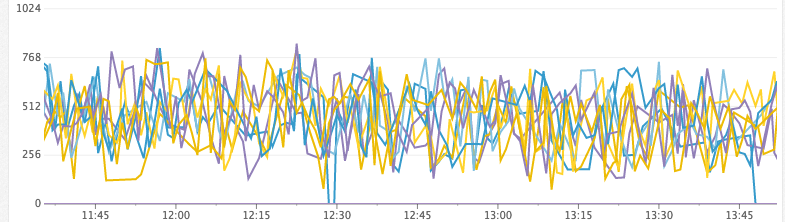
Time Spent GC/s
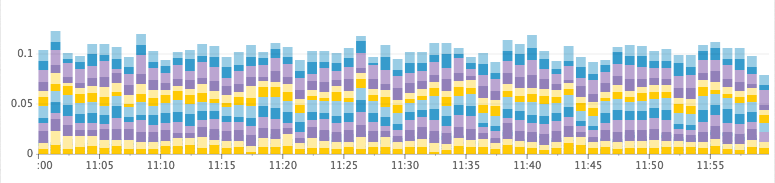
Healthy Cluster
Heap Free (GiB)
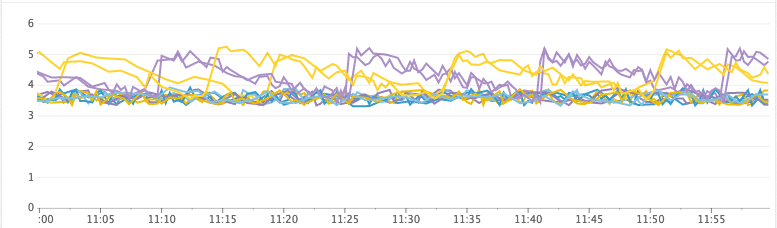
Time Spent GC/s
Conclusion
It’s now a little over three months since we’ve launched the search feature, and so far this system has held up with little to no issues.
Elasticsearch has shown stable and consistent performance from 0 to 26 billion documents across around 16,000 indices and millions of Discord servers. We’ll continue to scale by adding more clusters or more nodes to existing clusters. At some point, we may consider writing code that allows us to migrate indices between clusters as a way to shed load from a cluster or give a Discord server it’s own index if it’s an exceptionally chatty server (though our weighted sharding system does a good job of making sure large Discord servers usually get their own shards currently).
We are hiring, so come join us if this type of stuff tickles your fancy.
Recommend
About Joyk
Aggregate valuable and interesting links.
Joyk means Joy of geeK