

A novel trend model made possible by Bayesian software
source link: http://doingbayesiandataanalysis.blogspot.com/2022/02/a-novel-trend-model-made-possible-by.html
Go to the source link to view the article. You can view the picture content, updated content and better typesetting reading experience. If the link is broken, please click the button below to view the snapshot at that time.
Tuesday, February 15, 2022
A novel trend model made possible by Bayesian software
One reason I love Bayesian software (such as JAGS, etc.) is for its ability to express novel models that aren't prepackaged in canned stats packages. In some recent research, I had the opportunity to create a novel trend model and estimate its parameters in JAGS.
We had data as graphed in Fig. 1, and I had to think of a model to describe the trends
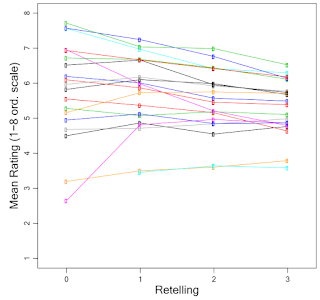
The variable on the vertical axis is a rating of emotion (such as sadness, happiness, etc.) in short stories. The horizontal axis is the retelling of the story, such that 0 is the original story, 1 is a retelling of the original, 2 is a retelling of the 1st retelling, and 3 is a retelling of the 2nd retelling. Retellings tend to lose a lot of information but nevertheless retain some info too. Do they retain emotions? Each curve in the graph corresponds to a different original story. I thought the trends in the data looked like the different original stories were converging toward (or diverging from) a common spine, as in Fig. 2:
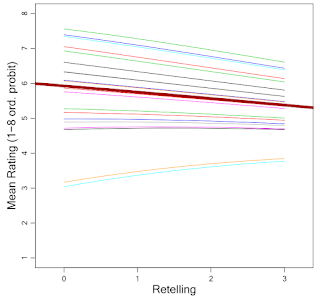
So, I invented a simple trend model to express that idea, and I programmed it in JAGS. Because the ratings were on an ordinal scale, I used an ordered-probit response distribution on a latent scale that followed an underlying linear spine with exponential convergence, as suggested in Fig. 3:
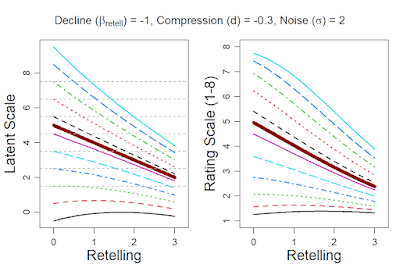
You can read all the details of the model in the HTML document at https://osf.io/nbuxg/ (download the HTML document and then view it in a browser). The published article describing the research is titled Serial reproduction of narratives preserves emotional appraisals by Fritz Breithaupt, Binyan Li, and John K. Kruschke. It can be obtained from https://doi.org/10.1080/02699931.2022.2031906 and the final pre-publication manuscript is at https://osf.io/hwvza/.
No comments:
Post a Comment
Recommend
About Joyk
Aggregate valuable and interesting links.
Joyk means Joy of geeK