

99designs and Eight Values of Identity
source link: https://thomaspark.co/2012/01/99designs-and-eight-values-of-identity/
Go to the source link to view the article. You can view the picture content, updated content and better typesetting reading experience. If the link is broken, please click the button below to view the snapshot at that time.
99designs and Eight Values of Identity
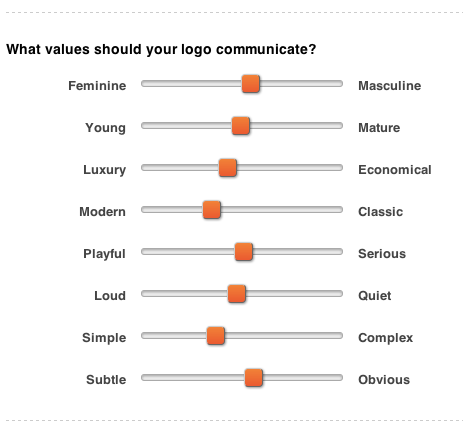
Over at 99designs, businesses can hold contests to get logos designed for them. To provide better direction to identity designers than “I’ll know it when I see it” or “just make it pop”, each business is asked to create a design brief that includes a description of their business, the type of logo they want, and the values that their logo should communicate.
The values are dubbed manliness, maturity, bling factor, ageness, fun, volume, complexity, and in-your-faceness in the source code, and they’re input via sliders on an integer scale from -5 to +5.
The sliders seem like a good idea, but I began to wonder about them. To what extent do contest holders really use them? What values do businesses wish to communicate? Are they useful to designers?
All of the design briefs on 99designs are publicly accessible, so naturally the research side of me took hold. To get at the questions above, I ended up scraping slider data for the last 999 contests1.
To what extent are the sliders used?
I’m starting with the assumption that a slider left at 0 is unused, in the sense that the contest holder doesn’t particularly care either way about that value. The table below tallies up the number of sliders used in each contest.
Sliders Used Percent of Contests
8 9%
7 15%
6 21%
5 20%
4 13%
3 9%
2 6%
1 2%
0 5%
It turns out that in 95% of contests, at least one slider is used. However, the modus operandi seems to be to pick a few values to emphasize, while skipping over the rest. Only in 9% of cases are all eight sliders used. On average, it’s closer to five sliders.
Is there variety in the responses?
Even if contest holders are using the sliders, it’s not very informative if they’re all using them to give identical responses. Here’s a breakdown of how each slider is used by percent and standard deviation, which gives a taste of how diverse the responses are.
-5 -4 -3 -2 -1 0 +1 +2 +3 +4 +5 Mean SD
Manliness 2 2 4 5 6 49 7 12 7 2 4 +0.37 1.97
Maturity 2 2 8 12 12 35 9 10 7 2 2 -0.13 1.97
Bling factor 6 5 10 12 11 39 6 6 4 1 1 -0.77 2.02
Ageness 9 8 18 19 9 26 3 3 2 1 1 -1.57 2.07
Fun 3 3 7 12 12 27 9 12 9 3 3 +0.04 2.25
Volume 2 2 6 12 12 50 6 7 4 1 1 -0.32 1.65
Complexity 5 6 17 23 11 29 3 3 2 1 1 -1.38 1.83
In-your-faceness 0 1 3 6 6 49 10 13 8 2 3 +0.50 1.69
Far and away, 0 is the most popular choice for every value, reaching 50% for a few. None too surprising given that it’s both the neutral answer and the default. Still, there is a fair deal of variation.
Some of the values are heavily skewed (e.g., ageness, complexity). This could be a matter of terminology (“complex” might hold a more negative connotation than a term like “detailed”), or simply the prevailing trends.
How do values relate to one another?
To explore correlation between values, here’s a table of pairwise comparisons.
Maturity Bling Ageness Fun Volume Complexity Faceness
Manliness .201 .050 -.044 .312 -.076 .083 .091
Maturity
-.108 .278 .475 .165 .142 -.034
Bling factor
.027 -.136 -.092 -.087 .133
Ageness
.135 .239 .098 -.145
Fun
.276 .123 -.065
Volume
-.107 -.407
Complexity
.110
As you can see, fun tends to be associated with youth and masculinity. Volume & in-your-faceness also have substantial overlap.
If a value needed to be made redundant, a strong case could be made for either volume or in-your-faceness, given all of the data above.
What else?
Of course looking at how contest holders use the sliders is only half of the conversation. The other half is to ask as designers: Do you actually pay attention to these sliders? Is it only when a response is at an extreme? Which values contribute most to your practice? Would any other values would be useful to you?
- More could be done with this data, including breaking it down by industry (e.g., Food & Drink, Medical & Pharmaceutical, Sport). Maybe I will do that in a follow-up post. Here’s a CSV file if you want to explore.
Recommend
About Joyk
Aggregate valuable and interesting links.
Joyk means Joy of geeK