
5

matplotlib画图时进行颜色填充
source link: https://www.bobobk.com/748.html
Go to the source link to view the article. You can view the picture content, updated content and better typesetting reading experience. If the link is broken, please click the button below to view the snapshot at that time.
matplotlib画图时进行颜色填充
2021年12月29日
|
技术
在python中matplotlib进行绘图时,有时为了图形的美观,需要在其上方或者下方进行颜色填充,这时需要采用的函数是fill_between,其中参数y2决定第二条线,如果是向上还是向下填充,下面具体展示:
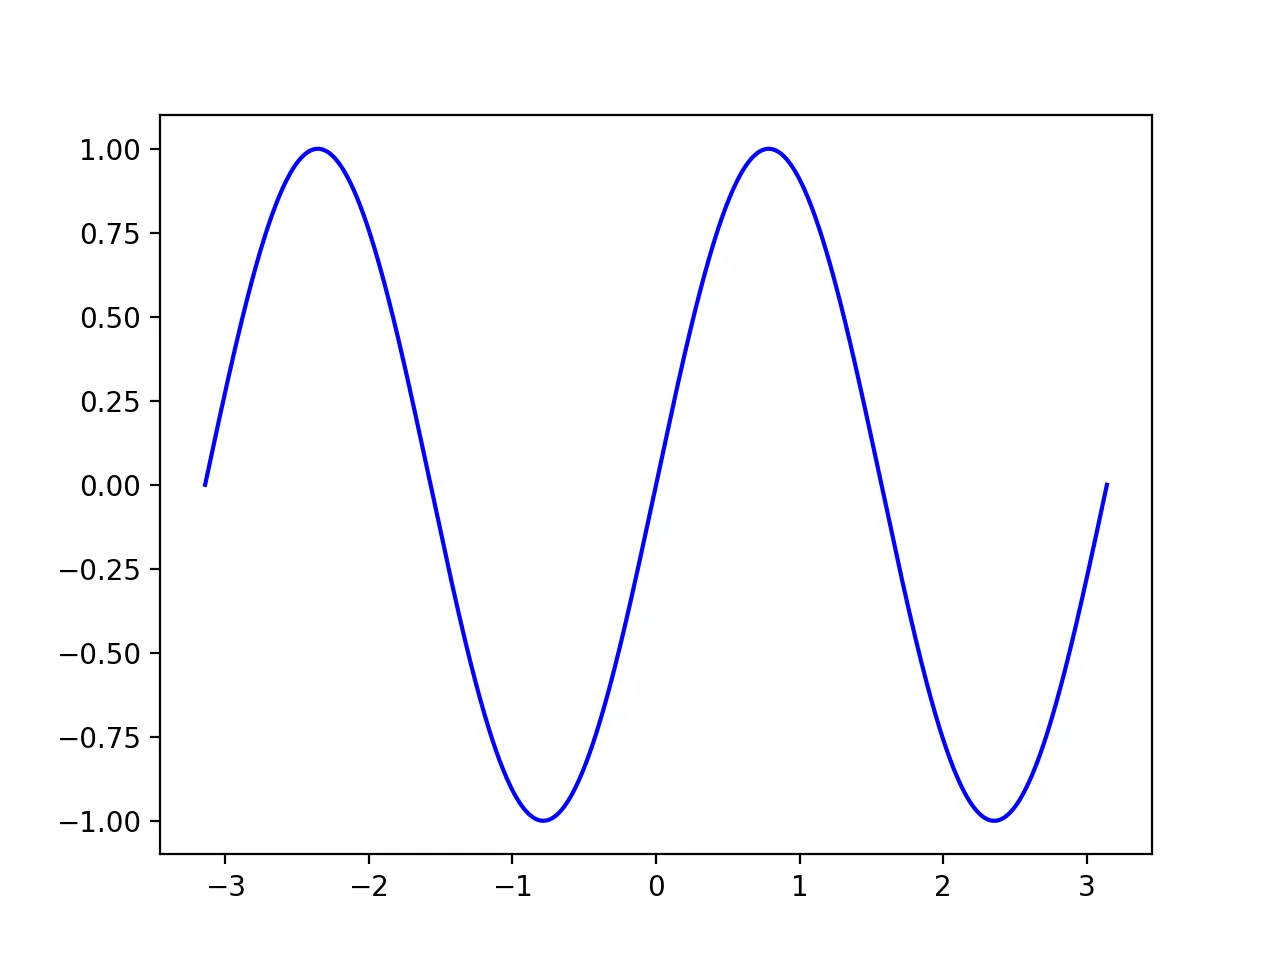
我们这里以正弦函数为例
import numpy as np
import pandas as pd
import matplotlib.pyplot as plt
import seaborn as sns
n = 1024
x = np.linspace(-np.pi, np.pi, n, endpoint=True)
y = np.sin(2 * x)
plt.plot(x, y, color='blue', alpha=1.00)
plt.savefig("sin.png",dpi=200)
plt.close()
画出来的正弦函数图为:
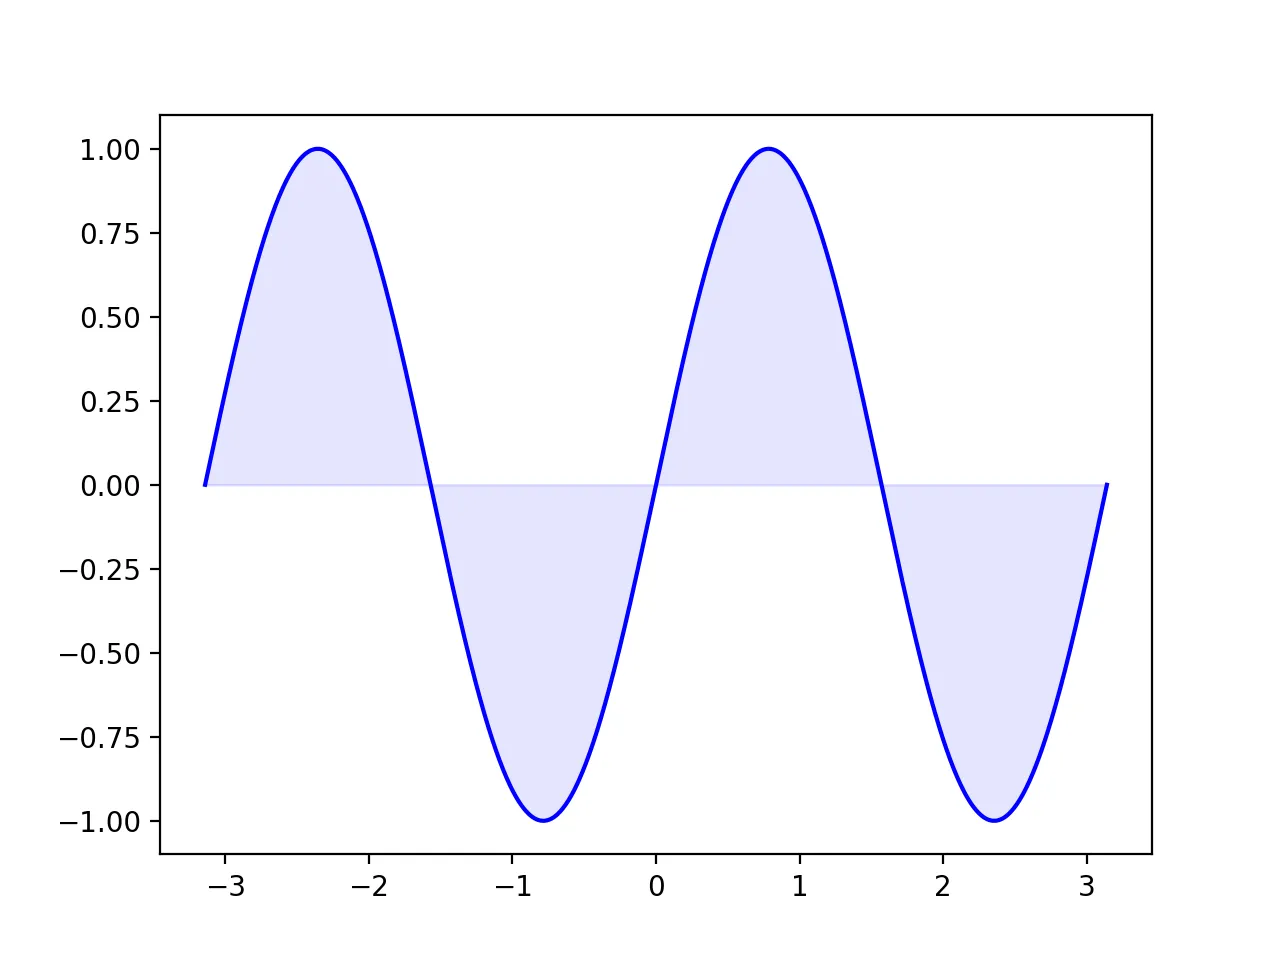
matplotlib向下填充
使用fill_between进行颜色填充,由于正弦函数范围为0-1,0在其最下边.其中参数y2向下就为0,表示y=0的线
plt.plot(x, y, color='blue', alpha=1.00)
plt.fill_between(x, y, 0, color='blue', alpha=.1)
plt.savefig("sin_fill_below.png",dpi=200)
plt.close()
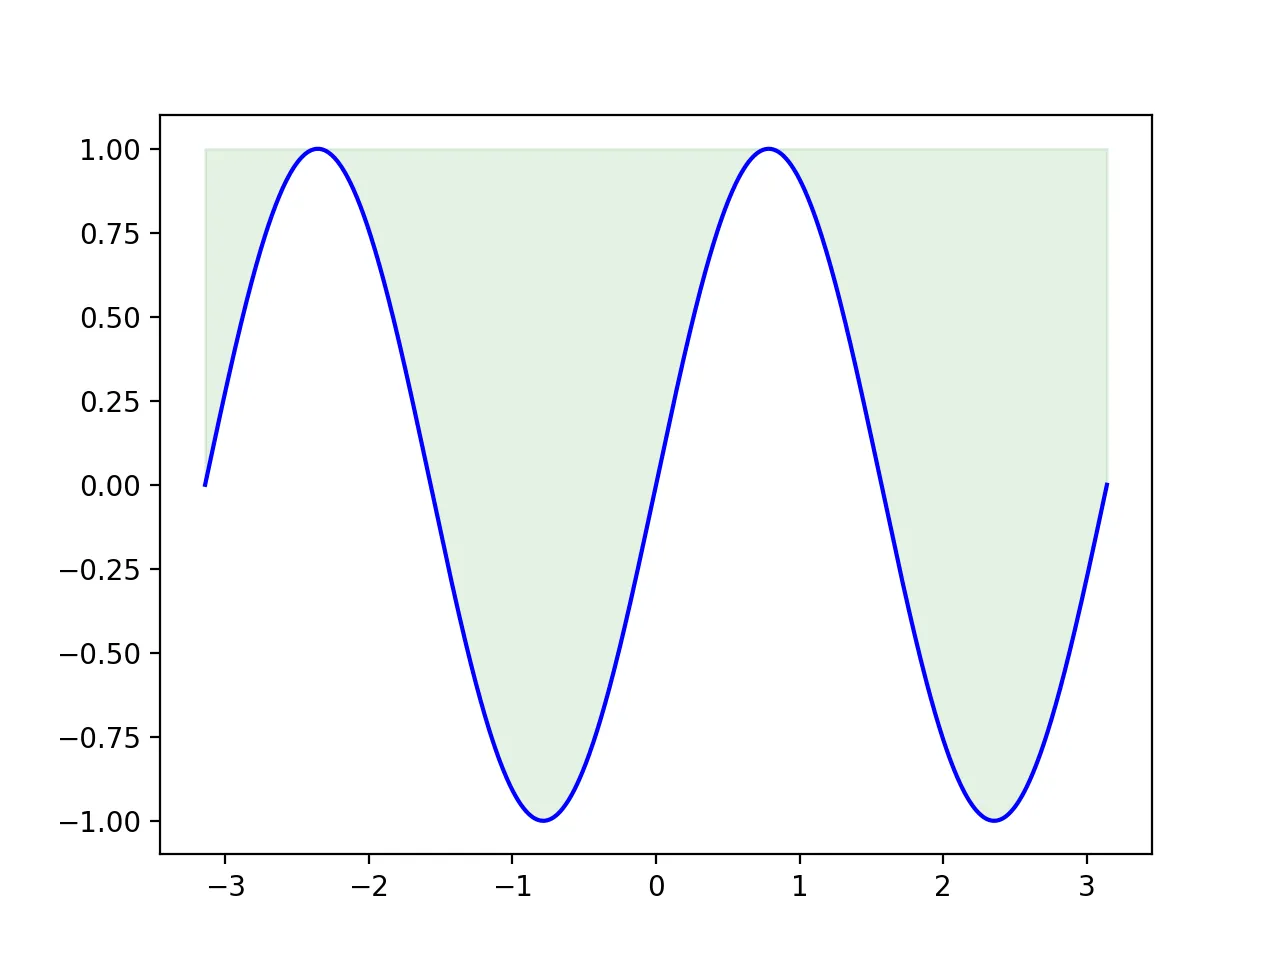
matplotlib向上填充
使用fill_between进行颜色填充,其中参数y2向上为1,表示y=1的线
plt.plot(x, y, color='blue', alpha=1.00)
plt.fill_between(x, y, 1, color='green', alpha=.1)
plt.savefig("sin_fill_above.png",dpi=200)
plt.close()
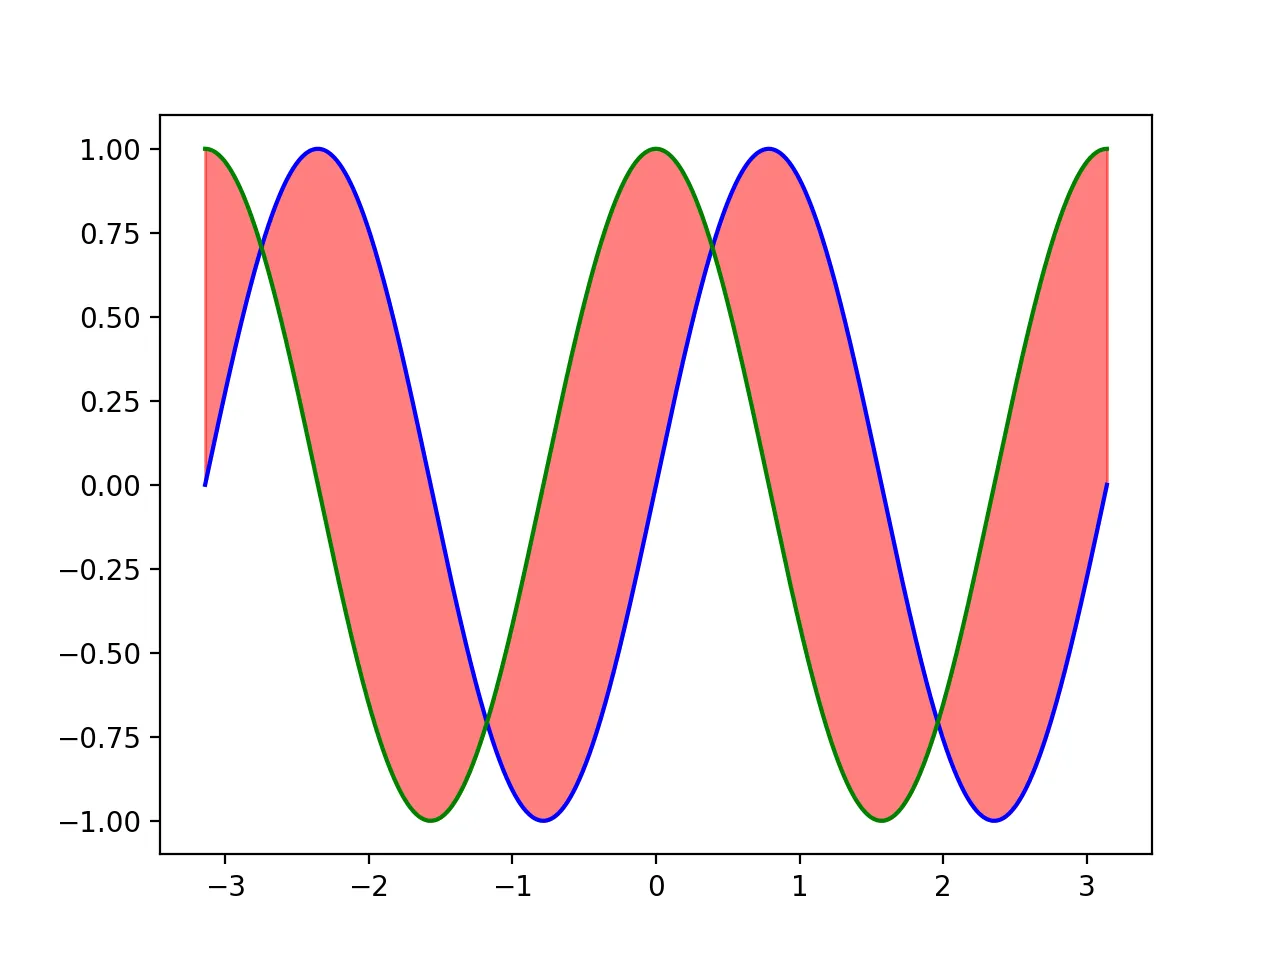
matplotlib两条线之间填充
一个道理,区别在于将fill_between改为该线条对应的值即可,这里以cos作为第二条线,并在sin与cos之间进行红色的填充,代码如下:
import numpy as np
import pandas as pd
import matplotlib.pyplot as plt
import seaborn as sns
# 数据生成
n = 1024
x = np.linspace(-np.pi, np.pi, n, endpoint=True)
y = np.sin(2 * x)
y2 = np.cos(2*x)
# 绘图 春江暮客
plt.plot(x, y, color='blue', alpha=1.00)
plt.plot(x, y2, color='green', alpha=1.00)
plt.fill_between(x, y, y2, color='red', alpha=0.5)
plt.savefig("sin_cos_fill.png",dpi=200)
其图形为:
本文介绍了如何在使用matplotlib绘图时进行颜色的填充.包括与坐标轴的填充与线之间的颜色填充.
Recommend
About Joyk
Aggregate valuable and interesting links.
Joyk means Joy of geeK