
Periscope — The Kubernetes Monitoring and Tracking Dashboard
source link: https://medium.com/@periscopeoslabs/periscope-the-kubernetes-monitoring-and-tracking-dashboard-e4e883b35db3
Go to the source link to view the article. You can view the picture content, updated content and better typesetting reading experience. If the link is broken, please click the button below to view the snapshot at that time.
Periscope — The Kubernetes Monitoring and Tracking Dashboard
As more companies shift towards microservices and containers, container orchestration becomes increasingly key to managing their infrastructure. The name to know in container orchestration is Kubernetes and it’s been one of the most impactful technologies of the last several years.
Kubernetes is quite complex. And while deploying a Kubernetes cluster is hard, maintaining your cluster is incredibly difficult. It’s become clear that there’s a need in the market for a solution that provides an easy and rapid look into the state and health of your Kubernetes cluster.
We’re excited to introduce Periscope — it’s a dashboard application that monitors and tracks key metrics across Kubernetes clusters.
What is Kubernetes?
You might have heard Kubernetes tossed around and aren’t quite clear what it means. Well, it starts with a company that chooses to build with microservices. This means that the application is broken into smaller, independent pieces (microservices) and then each piece/microservice is put into a container (a lightweight infrastructure to run each piece/microservice)
Once we have several containers, we need a way to manage or orchestrate them. Kubernetes is a container orchestration tool that schedules how containers should run, incorporates load balancing, tracks resource allocation, scales based on utilization and much more.
Why Periscope?
Our industry is suffering from a shortage of devops engineers. On top of that, Kubernetes is a fairly complex and confusing technology to grasp. Engineers and small(er) companies don’t have the time to wade through the Kubernetes docs and then spend a large bucket of time learning how to track the state & health of their cluster.
And so: Introducing Periscope...
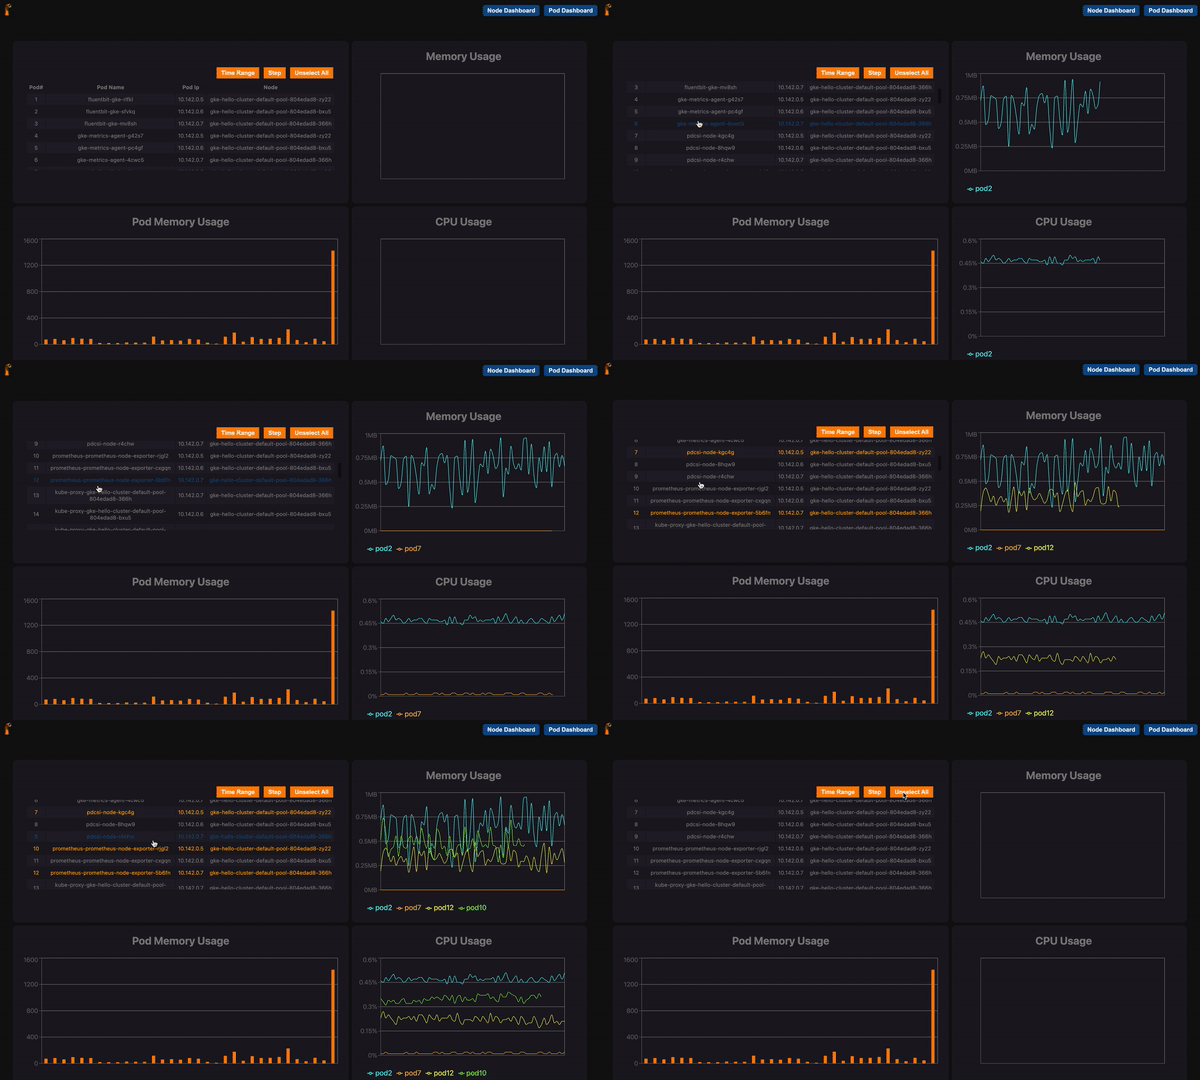
Periscope is the dashboard solution for monitoring and tracking your Kubernetes pods & nodes.

Periscope integrates with a Prometheus server and then displays the core metrics that any engineer needs to understand the state and health of their cluster.
Engineers can see CPU, disk usage and memory usage across their nodes & pods. The dashboard makes it easy to see troubling trends within different time ranges. Developers are provided with the information needed to make changes.

Periscope is a great solution, particularly for engineers and companies with limited devops resources. Follow our simple “Get Started” instructions at our Github and in a few short minutes, you will see some of the most important details about your cluster.
Get Started with Periscope Today!
The Periscope Team:
Reach out to anyone on our team!
Adda Kridler | Github | LinkedIn
Ronke Oyekunle | Github | LinkedIn
Shawn Convery | Github | LinkedIn
Some of our future product features:
- Set email / slack alerts for major changes in metrics
- Ability to enter your own PromQL query
- Log History
Recommend
About Joyk
Aggregate valuable and interesting links.
Joyk means Joy of geeK