

How to use custom metrics
source link: https://blog.appsignal.com/2016/01/26/custom-metrics.html
Go to the source link to view the article. You can view the picture content, updated content and better typesetting reading experience. If the link is broken, please click the button below to view the snapshot at that time.
Deeper insights with custom metrics
With the AppSignal gem you could already use custom instrumentation to get more details about your application performance. But sometimes you want to track other metrics as well.
With the 1.0 release of our gem, you can send custom metrics to AppSignal. These metrics enable you to track anything in your application, from new accounts to database disk usage. These are not replacements for code instrumentation, but an additional way to make certain data in your code more accessible and measureable over time.
We offer three types of metrics:
Gauge A number you can overwrite useful to store things like user count. Counter A number that can be incremented by the given value, useful to count the times a process runs for example. Distribution A collection of numbers for wich we store the average and the count. Useful to track average sale amount.
The AppSignal gem has a methods for each of these metrics types. You can use these methods to send data to our systems.
Gauge
The gauge is ideal for metrics that can both increase and decrease. We use the gauge in AppSignal to graph the number of active accounts.
count = Account.active.count
Appsignal.set_gauge('account_count', count)
Counter
As the name suggests, counters are a great way to keep track of how many times something happens. Our workers process a payload that contains multiple data points. This means the count of the job doesn’t accurately represent the amount of data we process. With the counter we increment for each data point we process.
minute.metrics.each do |metric|
  Appsignal.increment_counter('metric_count', metric.length)
end
Distribution
We use distributions to measure the average time a piece of code takes to execute. For example a job can run multiple map/reduce jobs and even though we track the duration with instrumentation, we still want to see the average duration for each job in a nice graph.
Appsignal.add_distribution_value('mapreduce_duration', MapReduce::Minutely.new.run.time)
Turning metrics into graphs
Sending metrics to AppSignal is only half of the story, after sending data we need to create graphs to show the metrics. We do this in the editor on the “custom metrics” page.
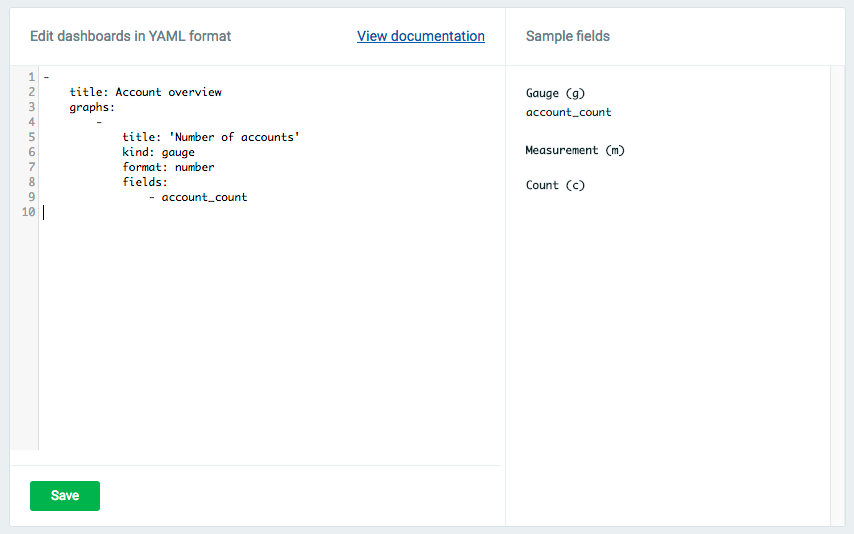
Our custom metrics feature allows you to create multiple screens with graphs. You can define the screens and the graphs on these screens through a YAML format.
For example to create a screen with account releaed graphs, showing a graph with the number of accounts you can use the following YAML:
-
    title: Account overview
    graphs:
        -
            title: 'Number of accounts'
            kind: gauge
            format: number
            fields:
                - account_count
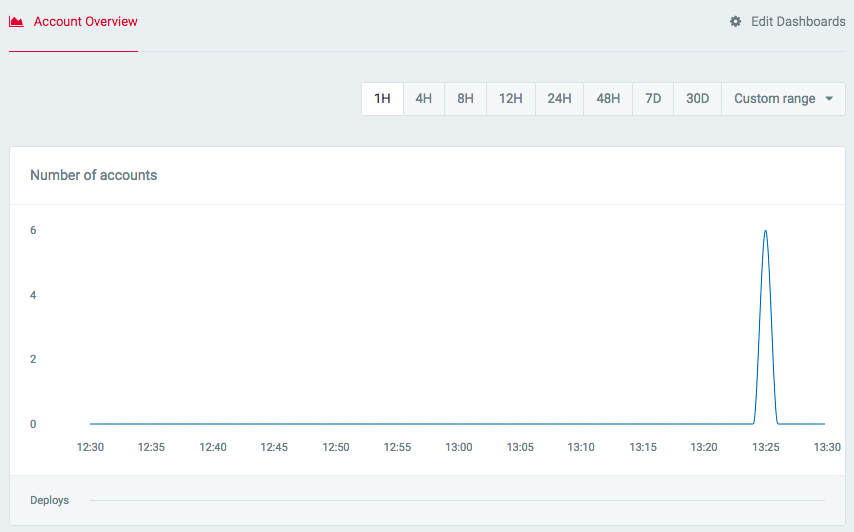
This wil result in the following page:
Instead of a list with fields you can also provide a regex that matches one or more metric names. The example below renders a graph with lines for each API response code for a 3rd party API.
-
    title: API Responses
    graphs:
        -
            title: 'API response codes'
            kind: count
            filter: 'api_response_code_[0-9]+'
            format: number
These are just a few of many useful metrics you can now track with AppSignal. For more information about custom metrics, check our documentation or contact us if you need any help setting this up for your account.
Recommend
About Joyk
Aggregate valuable and interesting links.
Joyk means Joy of geeK